Open Journal of Modern Hydrology, 2013, 3, 75-78
http://dx.doi.org/10.4236/ojmh.2013.32010 Published Online April 2013 (http://www.scirp.org/journal/ojmh) 75
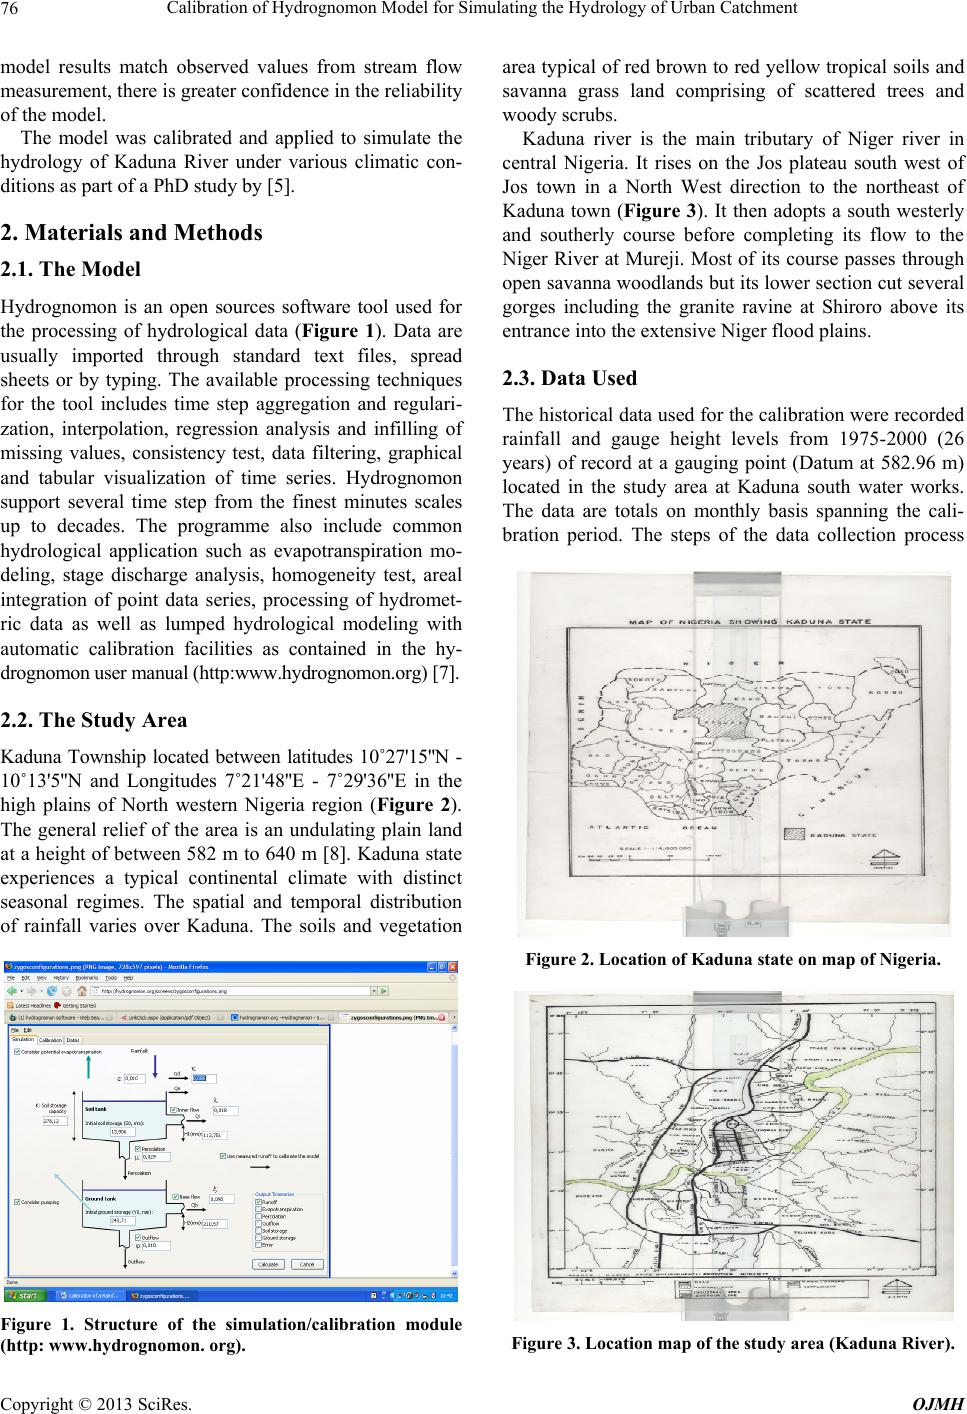
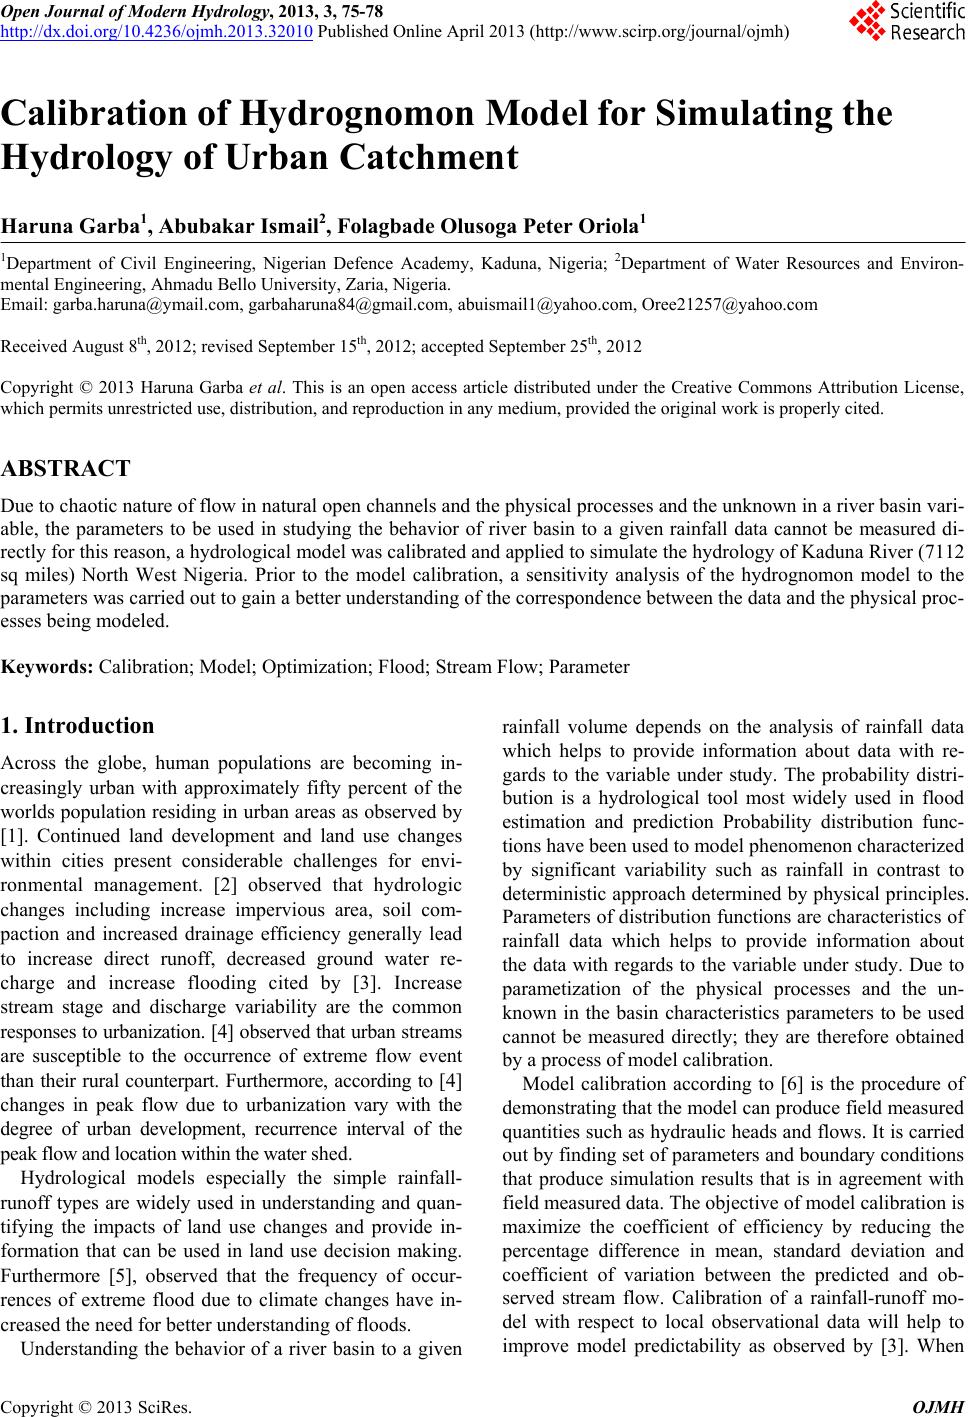
Calibration of Hydrognomon Model for Simulating the
Hydrology of Urban Catchment
Haruna Garba1, Abubakar Ismail2, Folagbade Olusoga Peter Oriola1
1Department of Civil Engineering, Nigerian Defence Academy, Kaduna, Nigeria; 2Department of Water Resources and Environ-
mental Engineering, Ahmadu Bello University, Zaria, Nigeria.
Email: garba.haruna@ymail.com, garbaharuna84@gmail.com, abuismail1@yahoo.com, Oree21257@yahoo.com
Received August 8th, 2012; revised September 15th, 2012; accepted September 25th, 2012
Copyright © 2013 Haruna Garba et al. This is an open access article distributed under the Creative Commons Attribution License,
which permits unrestricted use, distribution, and reproduction in any medium, provided the original work is properly cited.
ABSTRACT
Due to chaotic nature of flow in natural open channels and the physical processes and the unknown in a river basin vari-
able, the parameters to be used in studying the behavior of river basin to a given rainfall data cannot be measured di-
rectly for this reason, a hydrological model was calibrated and applied to simulate the hydrology of Kaduna River (7112
sq miles) North West Nigeria. Prior to the model calibration, a sensitivity analysis of the hydrognomon model to the
parameters was carried out to gain a better understanding of the correspondence between the data and the physical proc-
esses being modeled.
Keywords: Calibration; Model; Optimization; Flood; Stream Flow; Parameter
1. Introduction
Across the globe, human populations are becoming in-
creasingly urban with approximately fifty percent of the
worlds population r esiding in urban areas as observed by
[1]. Continued land development and land use changes
within cities present considerable challenges for envi-
ronmental management. [2] observed that hydrologic
changes including increase impervious area, soil com-
paction and increased drainage efficiency generally lead
to increase direct runoff, decreased ground water re-
charge and increase flooding cited by [3]. Increase
stream stage and discharge variability are the common
responses to urbanization. [4] observed that urban strea ms
are susceptible to the occurrence of extreme flow event
than their rural counterpart. Furthermore, according to [4]
changes in peak flow due to urbanization vary with the
degree of urban development, recurrence interval of the
peak flow and location within the water shed.
Hydrological models especially the simple rainfall-
runoff types are widely used in understanding and quan-
tifying the impacts of land use changes and provide in-
formation that can be used in land use decision making.
Furthermore [5], observed that the frequency of occur-
rences of extreme flood due to climate changes have in-
creased the need for bett e r understanding of flo o ds.
Understanding the behavior of a river basin to a given
rainfall volume depends on the analysis of rainfall data
which helps to provide information about data with re-
gards to the variable under study. The probability distri-
bution is a hydrological tool most widely used in flood
estimation and prediction Probability distribution func-
tions have been used to model phenomenon characterized
by significant variability such as rainfall in contrast to
deterministic approach determin ed by physical principles.
Parameters of distribution functions are characteristics of
rainfall data which helps to provide information about
the data with regards to the variable under study. Due to
parametization of the physical processes and the un-
known in the basin characteristics parameters to be used
cannot be measured directly; they are therefore obtained
by a process of model calibration.
Model calibration according to [6] is the procedure of
demonstrating that the model can produce field measured
quantities such as hydrau lic heads and flows. It is carried
out by finding set of parameters and boundary co nditions
that produce simulation results that is in agreement with
field measured data. The objective of model calibration is
maximize the coefficient of efficiency by reducing the
percentage difference in mean, standard deviation and
coefficient of variation between the predicted and ob-
served stream flow. Calibration of a rainfall-runoff mo-
del with respect to local observational data will help to
improve model predictability as observed by [3]. When
Copyright © 2013 SciRes. OJMH