Paper Menu >>
Journal Menu >>
 Psychology, 2010, 1, 261-272 doi:10.4236/psych.2010.14035 Published Online October 2010 (http://www.SciRP.org/journal/psych) Copyright © 2010 SciRes. PSYCH 261 The Measurement of Social Competence in Children Using the Rorschach Inkblot Test: A Validation Study ——The Rorschach Test & Children’s Social Competence Sandra A. Soenning1, Gary D. Fireman2, James R. Clopton3 1The Menninger Clinic, Houston, USA; 2Department of Psychology, Suffolk University, Boston, USA; 3Department of Psychology, Texas Tech University, Lubbock, USA. Email: jim.clopton@ttu.edu Received May 13th, 2010; revised June 3rd, 2010; accepted June 10th, 2010. ABSTRACT The current study evaluated the validity of Rorschach variables in assessing interpersonal competence in children. Par- ticipants were three groups of 4th-5th- and 6th-grade children identified by a peer nomination measure: 24 popular chil- dren, 9 rejected, aggressive children, and 20 rejected, non-aggressive children. ANOVAs, chi-square analyses, and Fisher’s Exact Test were used to analyze data for validity indices, human representational responses, and other Ror- schach variables relevant to social competence [1]. There were no significant differences between popular children and the two peer-rejected groups of children for Rorschach variables related to prosocial skills (Good Human Representa- tion and Cooperative responses). In contrast, group differences did provide some support for Rorschach variables re- lated to deficits in interpersonal competence (Poor Human Representation and Aggressive responses; D scores). Until more validity research is conducted, examiners should be cautious when drawing conclusions about social competence on the basis of children’s Rorschach responses. Keywords: Children’s Social Competence, Peer Rejection, Popular Children, Rorschach Inkblot Test, Peer Nomination 1. Introduction The Rorschach Inkblot Test is a popular, but controver- sial assessment instrument. Despite the effort of Exner [1] and other Rorschach researchers to provide a solid em- pirical basis for the Rorschach, it has been frequently criticized for having limited construct and criterion va- lidity (e.g., [2]). Some psychologists have suggested a suspension in the use of the Rorschach test in psycho- logical assessment of children and adults, but it continues to be “one of the most used and researched tests in clini- cal psychology” [3], and new features continue to be added to Exner’s Comprehensive System (CS). For ex- ample, Human Representational Variables have been added and promoted as useful in evaluating social com- petence and the quality of an individual’s interpersonal relationships [1]. The Human Representational Variables have been primarily based on the work of Viglione (e.g., [4,5]). That research was conducted exclusively with adults. In fact, the majority of validation studies supporting the interpretation of scores in the Interpersonal Perception and Behavior Cluster of Exner’s CS have been conducted with participants who were 18 years old or older [1]. The current study is the first to examine the validity for the two Human Representational Variables—Good Human Representation (GHR) and Poor Human Representation (PHR)—among children. Another goal of the current study was to examine the validity of several other Ror- schach CS variables related to interpersonal functioning in children. The Human Representational Variables were first ex- amined in research on the Ego Impairment Index con- ducted by Perry et al., [5], Perry and Viglione [6]. Perry and Viglione [6] developed the Human Experience Variable (HEV), which was derived by subtracting the standardized sum of good human experience responses (GHR) from the standardized sum of poor human ex- perience responses (PHR). The authors conceptualized the GHR and PHR scores as representing how a person  The Measurement of Social Competence in Children Using the Rorschach Inkblot Test: A Validation Study Copyright © 2010 SciRes. PSYCH 262 perceives his or her interactions with others, but the ini- tial studies did not directly test that assumption. To ad- dress this limitation, Burns and Viglione [4] conducted a validation study to determine if the HEV was associated with “the quality of an individual’s interpersonal rela- tionships” (p. 92). Adult non-patient women were di- vided into two groups depending on whether they were high or low in the quality of their interpersonal relation- ships, based on measures of attitudes toward others and actual interpersonal behaviors as rated by each woman and her spouse. Results suggested that the GHR, PHR, and HEV were significantly related to which group (high or low interpersonal relationship quality) a woman be- longed to. Burns and Viglione [4] also conducted good- ness-of-fit tests and found that the GHR, PHR, and HEV scores were better at differentiating the two groups than the other variables they examined (e.g., specific Ror- schach scores and demographic variables), indicating that GHR and PHR were related in a “practically meaningful” way (p. 97) to the quality of a woman’s interpersonal relationships. Despite the apparent support for the validity of the HEV offered by the Burns and Viglione [4] study, it was criticized in several different ways by Wood, Nezworski, Stejskal, Garven, & West [7]. They questioned the valid- ity of the measure of interpersonal relationship quality, they pointed out limitations in excluding participants from the study if they scored in the middle range of in- terpersonal relationship quality, and they suggested that some statistical techniques were used in an inappropriate way by Burns and Viglione [4]. For example, one spe- cific criticism made by Wood et al. [7] was that Burns and Viglione [4] had combined self-report questionnaires that measure different constructs to establish a score of interpersonal relatedness, creating a variable that was “nearly impossible to interpret” (p. 118). Wood et al. [7] re-examined the data published by Burns and Viglione [4] and determined that the results did not support the au- thors’ hypothesis that the HEV is a useful predictor of human relationship quality. Even though the Burns and Viglione [4] study had been criticized in several ways by Wood et al. [7], Exner [8] introduced the GHR and PHR variables into the CS. GHRs are human content responses that are conventional (P) or have appropriate form quality (+, o, or u) and lack aggressive content or any cognitive special scores (ex- cept DV). In contrast, PHRs are human content responses that have poor form quality (– or no form), aggressive content, or special scores (such as FABCOM or MOR). Exner [8] changed the calculation of the HEV variable, eliminating the weighting of the raw scores. Exner [1] believed that the GHR and PHR scores provide informa- tion about interpersonal effectiveness and are best inter- preted in terms of their relationship to each other, rather than as a raw score difference. In addition, he suggested that the scores are best interpreted if a participant has at least three human representational responses in his or her protocol. With regard to interpretation, Exner ([1], p. 511) explained that when individuals have several GHR responses in their protocol, it is likely that they are “well regarded by others and their interpersonal activities tend to be relatively free of chaos.” According to Exner ([1] p. 511), people who give multiple responses coded PHR tend to have “patterns of interpersonal behavior that are ineffective or maladaptive” and “interpersonal histories that are marked by conflict and/or failure.” If an individ- ual gives relatively more GHR responses than PHR re- sponses, Exner ([1], p. 512) stated, “It can be assumed that the individual generally engages in forms of inter- personal behaviors that are likely to be adaptive for the situation.” On the other hand, Exner ([1], p. 512) said that an individual who gives more PHR responses than GHR responses “is prone to engage in forms of interper- sonal behaviors that are likely to be less adaptive for the situation than might be desirable.” These claims were stated as being true for all participants, children as well as adults. However, no evidence has been offered to support the use of the GHR and PHR scores with chil- dren. The current study directly addressed this limitation by examining the relationship between social competence, as measured by sociometric status in a sample of non- clinical, elementary school-aged children, and the Hu- man Representational Variables, GHR and PHR, in the Rorschach CS. Children in three social status groups, as determined by peer nomination, were studied: popular children; rejected, aggressive children; and rejected, non-aggressive children. If the GHR and PHR scores of the children in this study are found to be related to their membership in the three social status groups, some initial support for the validity of the Human Representational Variables will be established. The current study was designed to address several specific criticisms of the Burns and Viglione [4] study that had been made by Wood et al. [7]. The groups were determined using a well-established means of predicting children’s social adjustment [9]. Extensive research has shown that sociometric status, especially peer rejection, relates to the quality of children’s behaviors, communi- cation, and experience in their interactions with others (for a review of this research, see [10]). The three groups used in the current study were selected to accentuate re- liable differences in social competence: children identi- fied as popular by their peers, children who are rejected by their peers and are also aggressive, and children who are rejected by their peers but are not aggressive. Chil-  The Measurement of Social Competence in Children Using the Rorschach Inkblot Test: A Validation Study Copyright © 2010 SciRes. PSYCH 263 dren in the popular group are those who are not aggres- sive, who receive a high number of positive nominations and a small number of negative nominations from their peers in the classroom, and who are typically perceived as social leaders by their peers [11]. Children in the re- jected group are those who receive a small number of positive nominations and a large number of negative nominations from their classroom peers. The rejected group in this study was subdivided into aggressive and non-aggressive subtypes based on research that shows that these two subgroups differ in the reasons for their rejection [12,13]. 2. Method 2.1. Participants Before beginning any data collection, this study was ap- proved by the institutional review boards of Texas Tech University and the Lubbock Independent School District (LISD). A peer nomination measure, adapted from the Peer Assessment of Relational Aggression and Other Aspects of Social Adjustment [9], was administered in 3rd-, 4th- and 5th-grade classrooms during the Spring term in nine elementary schools within LISD. Children were asked which classmates they liked to play with the most and the least, and this information was used to identify children who were popular or rejected by their peers [14]. Other items asked about overt and relational aggression. Children whose scores for either type of aggression were greater than one standard deviation above the mean were considered aggressive, and all other children were con- sidered non-aggressive [9]. The only children invited to participate further in this study were those who fit into three social status groups: 1) popular and non-aggressive, 2) rejected and non-aggres- sive, or 3) rejected and aggressive. Consent forms were sent to the parents or guardians of 247 children. Signed consent forms were returned for 72 popular children, 22 rejected, non-aggressive children, and 12 rejected, ag- gressive children. Of these potential participants, data were gathered from 56 children during the Fall term fol- lowing the Spring administration of the peer nomination measure. However, data for three participants were de- leted because of their unusually high scores for lambda (explained below), leaving 53 children as participants in this study (24 popular, 20 rejected, non-aggressive, and 9 rejected, aggressive; 26 girls and 27 boys; 1 4th-grader, 30 5th-graders, and 22 6th graders). The first author at- tempted to collect data from all children in the two re- jected groups, but five of them were unavailable or un- willing to participate. The ethnicity of the participants was 47 Caucasian children (88.7%), 3 Hispanic children (7.5%), and 3 Asian children (3.8%). Among the three peer social status groups, there were no significant dif- ferences in the proportions of Caucasian and minority children, p = 0.99 (Fisher Exact Probability Test), or of boys and girls, 2 (2, N = 53) = 1.65, p > 0.05. 2.2. Procedure After parents mailed signed consent forms back to the first author, they were contacted to arrange a time for their children to complete the Rorschach Inkblot Test. Most children were tested at their school at the end of the school day, but one popular child and three rejected, ag- gressive children were tested at their homes. Children who completed the Rorschach were paid five dollars for their participation. The Rorschach was administered to the children by the first author and three other graduate students who had completed a course on the administration and scoring of the Rorschach using Exner’s Comprehensive System [1]. Beforehand, the four examiners had practiced adminis- tering the Rorschach and scoring responses with children similar to the participants. The first and the second au- thors had also worked together in scoring the Rorschach records for several children who were not participants in this study, and they had discussed those instances when their scoring differed. The Rorschach responses of the participants in this study were transcribed verbatim, and all responses were scored by the first author, using the standard Exner [15] rules. To adequately assess interrater reliability, Weiner [16] suggested that two or more examiners should each score at least 20 protocols in a study to monitor scoring reli- ability. That procedure was used in the current study. The second author randomly selected the Rorschach protocols for 20 children (10 popular, 5 rejected, non-aggressive, and 5 rejected, aggressive) and independently scored each variable that was examined in this study. 2.3. Measures The Peer Assessment of Relational Aggression and Other Aspects of Social Adjustment [9]. The 20-item, pa- per-and-pencil peer nomination measure used in this study was based on the procedures recommended by Pope, Bierman, and Mumma [17] and by Crick and Grot- peter [9]. The 12-month test-retest reliability of this measure ranges from 0.55 to 0.70 [18]. The internal con- sistency of the subscales that measure relational and overt aggression is good (Cronbach’s > 0.80; [9]). The Rorschach Inkblot Test [1]. The average interrater reliability of the Rorschach variables in Exner’s (2003) Comprehensive System is excellent ( = 0.90; [19]). In- terrater reliability for most Rorschach variables in the current study was calculated using intraclass correlation [20], and the data were centred in computing those intra-  The Measurement of Social Competence in Children Using the Rorschach Inkblot Test: A Validation Study Copyright © 2010 SciRes. PSYCH 264 class correlations [21]. All of those correlations indicated “outstanding” agreement. The lowest intraclass correla- tion was 0.86 for Adjusted D, and the highest intraclass correlation was 1.00 for S, indicating perfect agreement between the two raters in scoring white space responses. Percent agreement was used to assess interrater agr- eement instead of intraclass correlation for five Ror- schach variables with low frequencies of occurrence (AG, COP, Pure C, Fd, and T). There was perfect agreement between the first and the second authors in the scoring of food and texture responses, and their agreement for the other three variables was either 95% (aggressive move- ment responses) or 90% (cooperative responses and pure color responses). When the independent scoring of the two raters differed for a Rorschach response in the 20 protocols they both scored, they discussed the scoring and reached a consensus. The consensus scoring was used in the remaining data analyses. 3. Results Preliminary analyses were conducted to assess whether the children who were participants in this study had valid Rorschach results by providing enough responses and by avoiding giving responses that merely dealt with the form of the inkblots. After that, differences among the three groups (popular children; rejected, aggressive chil- dren; and rejected, non-aggressive children) were exam- ined for GHR and PHR responses and for other Ror- schach variables that assess interpersonal perception and behavior, such as aggressive and cooperative responses. For these variables, the means for the three groups were compared with analyses of variance (ANOVAs), and Tukey’s HSD (Honestly Significant Difference) method was used for post-hoc comparisons when the ANOVA indicated that the means of the three groups differed sig- nificantly [22]. Table 1 presents the means and standard deviations for variables evaluated with ANOVAs and Tukey HSD tests. Comparisons were also made with chi-square analyses of the number of children in each of the three groups who obtained Rorschach scores that are believed to provide important information about social competence [1]. Ta- ble 2 presents the frequencies and percentages for those categorical Rorschach variables that were evaluated with either chi-square analyses or the Fisher Exact Probability Test, which was used when expected cell frequencies were too low for chi-square analyses to be performed [23]. 3.1. Validity Indices Number of Rorschach responses (R). There was a sig- nificant difference in the number of responses (R) given by children in the three groups, F (2, 50) = 3.38, p < 0.05. Post-hoc comparisons with the Tukey HSD test indicated that rejected, aggressive children gave significantly more responses (M = 23.89) than rejected, non-aggressive children (M = 17.60), but that the number of responses given by children in those two groups did not differ sig- nificantly from the number of responses given by popular children (M = 20.42). Because of the significant differ- ence in R among the children in the three groups, it was used as a covariate when significant differences were found among the three groups for other variables. Lambda. Lambda is the proportion of an individual’s Rorschach responses that are pure F responses. Accord- ing to Exner [1], children may obtain high Lambda (Lambda > 1.5) due to a “tactic of avoidance or simplifi- cation” aimed at helping them “deal with a more easily managed world.” The authors decided to include any child’s data if Lambda did not exceed 4.0. That decision led us to exclude the data for three popular children with extremely high Lambda (9.0, 17.0, and 33.0). After data for those three children had been excluded, Lambda did not differ significantly for popular children (M = 1.39), rejected, aggressive children (M = 1.09), and rejected, non-aggressive children (M = 1.12), F (2, 50) = 0.50, p > 0.05. The number of children with high (> 1.5) Lambda did not differ significantly for popular children (29.2%), rejected, aggressive children (22.2%), and re- jected, non-aggressive children (20.0%), χ2 (2, N = 53) = 0.53, p > 0.05. Human Representational Responses (GHR and PHR) The GHR scores for popular children (M = 2.79), re- jected, aggressive children (M = 2.11), and rejected, non-aggressive children (M = 1.85) did not differ sig- nificantly, F (2, 50) = 1.55, p > 0.05. In contrast, PHR scores differed significantly for children in the three groups, F (2, 50) = 4.17, p < 0.05. Tukey HSD compari- sons indicated that children in the rejected, aggressive group (M = 5.22) produced significantly more PHR re- sponses than children in the rejected, non-aggressive group (M = 1.95), but that the PHR scores of children in the popular group (M = 3.00) did not differ significantly from the scores of children in the other two groups. When this analysis was repeated with R as a covariate, PHR scores were no longer significantly different for children in the three groups, F (2, 49) = 1.37, p > 0.05. According to Exner [1], adaptive interpersonal behav- ior is indicated when the number of human representa- tional responses is three or greater and GHR is greater than PHR. On the other hand, when the number of hu- man representational responses is three or greater and PHR is equal to or greater than GHR, it is likely that the person engages in less effective interpersonal behavior. For the 43 participants with at least three human repre- sentational responses, there was no significant difference  The Measurement of Social Competence in Children Using the Rorschach Inkblot Test: A Validation Study Copyright © 2010 SciRes. PSYCH 265 Table 1. Means and standard deviations for the Rorschach variables that were evaluated by ANOVAs Group Popular (n = 24) Rejected Aggressive (n = 9) Rejected Non-aggressive (n = 20) ANOVA Rorschach Variable M SD M SD M SD F ω2 Validity indices R 20.42a,b 6.60 23.89a 9.19 17.60b 3.33 3.38* 0.08 Lambda 1.39 1.05 1.09 0.91 1.12 1.03 0.50 <0.01 Good Human Representation (GHR) and Poor Human Representation (PHR) responses GHR 2.79 1.93 2.11 1.90 1.85 1.60 1.55 0.02 PHR 3.00a,b 3.15 5.22b 3.46 1.95a 1.99 4.17* 0.11 Other variables related to interpersonal perception and behavior AG 0.21a 0.51 0.78b 0.97 0.20a 0.41 3.67* 0.09 COP 0.54 0.93 0.67 1.00 0.50 0.69 0.12 <0.01 CDI 3.54 1.06 3.33 1.50 3.60 1.23 0.15 <0.01 Active-Passive 2.29 2.78 4.56 4.69 2.20 2.93 1.92 0.03 Human Contents 5.38 3.76 6.67 4.24 3.50 2.37 3.15 0.08 Pure H 1.92 2.19 1.44 1.01 1.55 1.43 0.35 <0.01 Percent Pure H 29.92 29.78 21.07 16.56 36.93 30.82 1.00 <0.01 Isolation index 0.17 0.13 0.26 0.16 0.27 0.18 2.26 0.05 S 3.62 2.39 5.00 4.03 3.00 1.57 2.02 0.04 Egocentricity 0.33 0.20 0.33 0.12 0.39 0.19 0.68 <0.01 FC 2.08 1.50 1.33 1.23 1.90 1.52 0.86 0.01 CF + C 0.92 1.41 2.00 1.23 1.20 1.36 2.07 0.04 (CF + C) – FC –1.17 2.28 0.67 2.12 –0.70 2.05 2.34 0.05 D –0.25a 1.15 –1.89b 1.83 –0.80a 1.11 5.50** 0.15 Adj D 0.08 1.06 –0.56 1.42 –0.30 0.80 1.48 0.02 Note. Means with common subscripts were not significantly different ( = 0.05) when calculated with the Tukey HSD procedure. df = 2, 50 for all ANOVAs. ω2 is the proportion of the variability in scores produced by differences among the groups [24]; *p < 0.05. **p < 0.01. in the proportions of participants in the three groups that had GHR greater than PHR, 2 (2, N = 43) = 1.81, p > 0.05, even though rejected, aggressive children (22.2%) were much less likely than popular children (47.6%) and rejected, non-aggressive children (46.2%) to have GHR greater than PHR. 3.2. Other Variables Assessing Interpersonal Perception and Behavior Aggressive (AG) Movement and Cooperative (COP) Movement responses. According to Exner [1], aggressive responses (AG) indicate that an individual expects that interactions with others will include aggressive or com- petitive behavior whereas cooperative responses (COP) indicate that an individual’s interpersonal interactions will be positive. Children in the three groups differed significantly in the number of AG responses they pro- duced, F (2, 50) = 3.67, p < 0.05. This difference re- mained statistically significant when the analysis was repeated with R as a covariate, F (2, 49) = 4.42, p < 0.05. Tukey HSD comparisons indicated that children in the rejected, aggressive group (M = 0.78) produced signifi- cantly more AG responses than children in the popular group (M = 0.21) and children in the rejected, nonaggres- 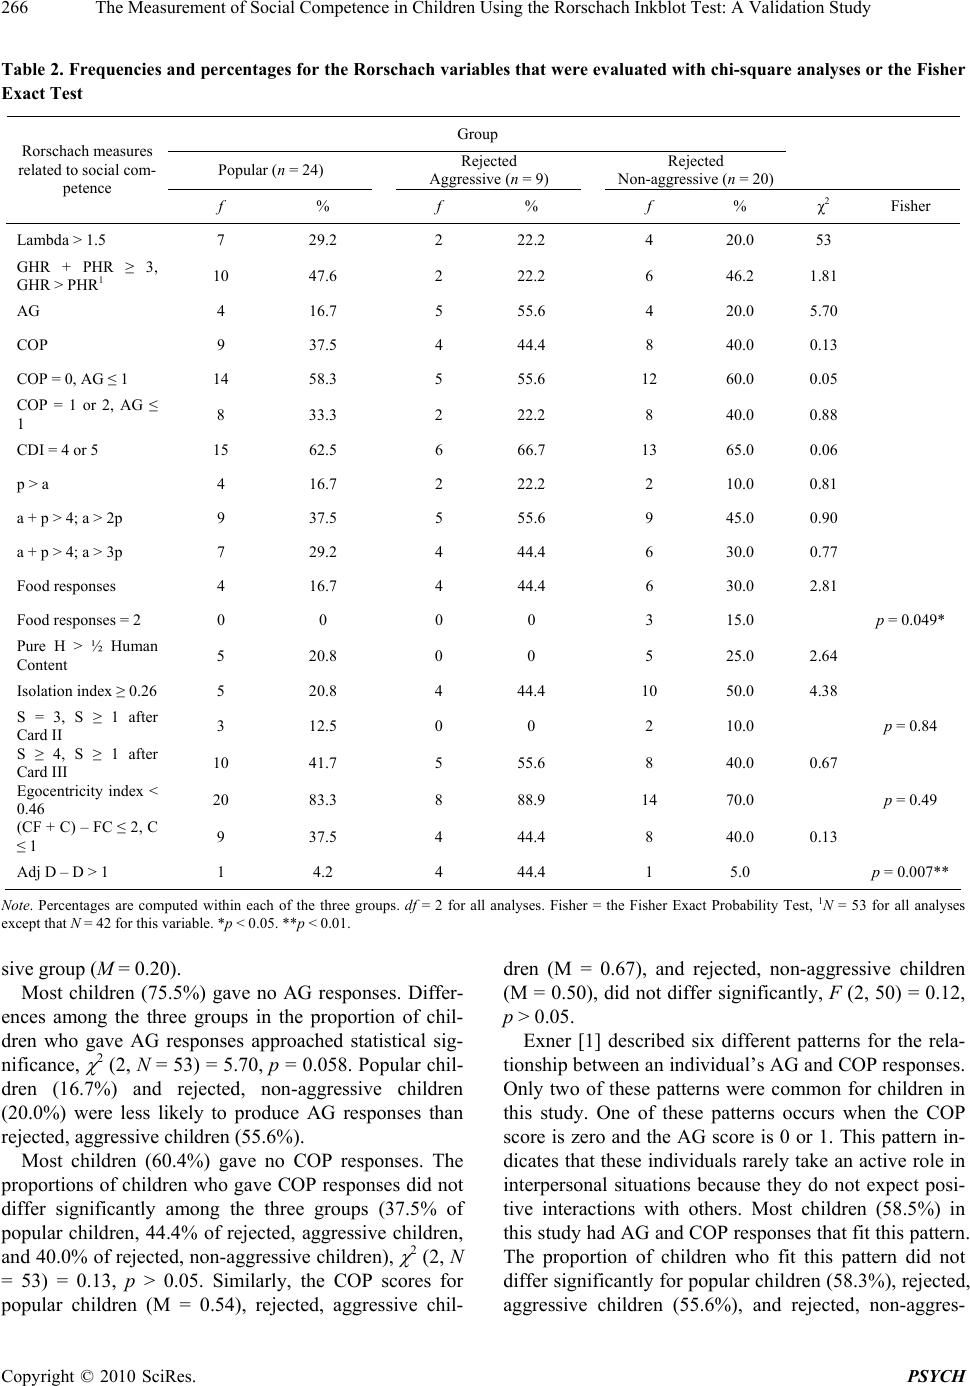 The Measurement of Social Competence in Children Using the Rorschach Inkblot Test: A Validation Study Copyright © 2010 SciRes. PSYCH 266 Table 2. Frequencies and percentages for the Rorschach variables that were evaluated with chi-square analyses or the Fisher Exact Test Group Popular (n = 24) Rejected Aggressive (n = 9) Rejected Non-aggressive (n = 20) Rorschach measures related to social com- petence f % f % f % χ2 Fisher Lambda > 1.5 7 29.2 2 22.2 4 20.0 53 GHR + PHR ≥ 3, GHR > PHR1 10 47.6 2 22.2 6 46.2 1.81 AG 4 16.7 5 55.6 4 20.0 5.70 COP 9 37.5 4 44.4 8 40.0 0.13 COP = 0, AG ≤ 1 14 58.3 5 55.6 12 60.0 0.05 COP = 1 or 2, AG ≤ 1 8 33.3 2 22.2 8 40.0 0.88 CDI = 4 or 5 15 62.5 6 66.7 13 65.0 0.06 p > a 4 16.7 2 22.2 2 10.0 0.81 a + p > 4; a > 2p 9 37.5 5 55.6 9 45.0 0.90 a + p > 4; a > 3p 7 29.2 4 44.4 6 30.0 0.77 Food responses 4 16.7 4 44.4 6 30.0 2.81 Food responses = 2 0 0 0 0 3 15.0 p = 0.049* Pure H > ½ Human Content 5 20.8 0 0 5 25.0 2.64 Isolation index ≥ 0.26 5 20.8 4 44.4 10 50.0 4.38 S = 3, S ≥ 1 after Card II 3 12.5 0 0 2 10.0 p = 0.84 S ≥ 4, S ≥ 1 after Card III 10 41.7 5 55.6 8 40.0 0.67 Egocentricity index < 0.46 20 83.3 8 88.9 14 70.0 p = 0.49 (CF + C) – FC ≤ 2, C ≤ 1 9 37.5 4 44.4 8 40.0 0.13 Adj D – D > 1 1 4.2 4 44.4 1 5.0 p = 0.007** Note. Percentages are computed within each of the three groups. df = 2 for all analyses. Fisher = the Fisher Exact Probability Test, 1N = 53 for all analyses except that N = 42 for this variable. *p < 0.05. **p < 0.01. sive group (M = 0.20). Most children (75.5%) gave no AG responses. Differ- ences among the three groups in the proportion of chil- dren who gave AG responses approached statistical sig- nificance, 2 (2, N = 53) = 5.70, p = 0.058. Popular chil- dren (16.7%) and rejected, non-aggressive children (20.0%) were less likely to produce AG responses than rejected, aggressive children (55.6%). Most children (60.4%) gave no COP responses. The proportions of children who gave COP responses did not differ significantly among the three groups (37.5% of popular children, 44.4% of rejected, aggressive children, and 40.0% of rejected, non-aggressive children), 2 (2, N = 53) = 0.13, p > 0.05. Similarly, the COP scores for popular children (M = 0.54), rejected, aggressive chil- dren (M = 0.67), and rejected, non-aggressive children (M = 0.50), did not differ significantly, F (2, 50) = 0.12, p > 0.05. Exner [1] described six different patterns for the rela- tionship between an individual’s AG and COP responses. Only two of these patterns were common for children in this study. One of these patterns occurs when the COP score is zero and the AG score is 0 or 1. This pattern in- dicates that these individuals rarely take an active role in interpersonal situations because they do not expect posi- tive interactions with others. Most children (58.5%) in this study had AG and COP responses that fit this pattern. The proportion of children who fit this pattern did not differ significantly for popular children (58.3%), rejected, aggressive children (55.6%), and rejected, non-aggres- 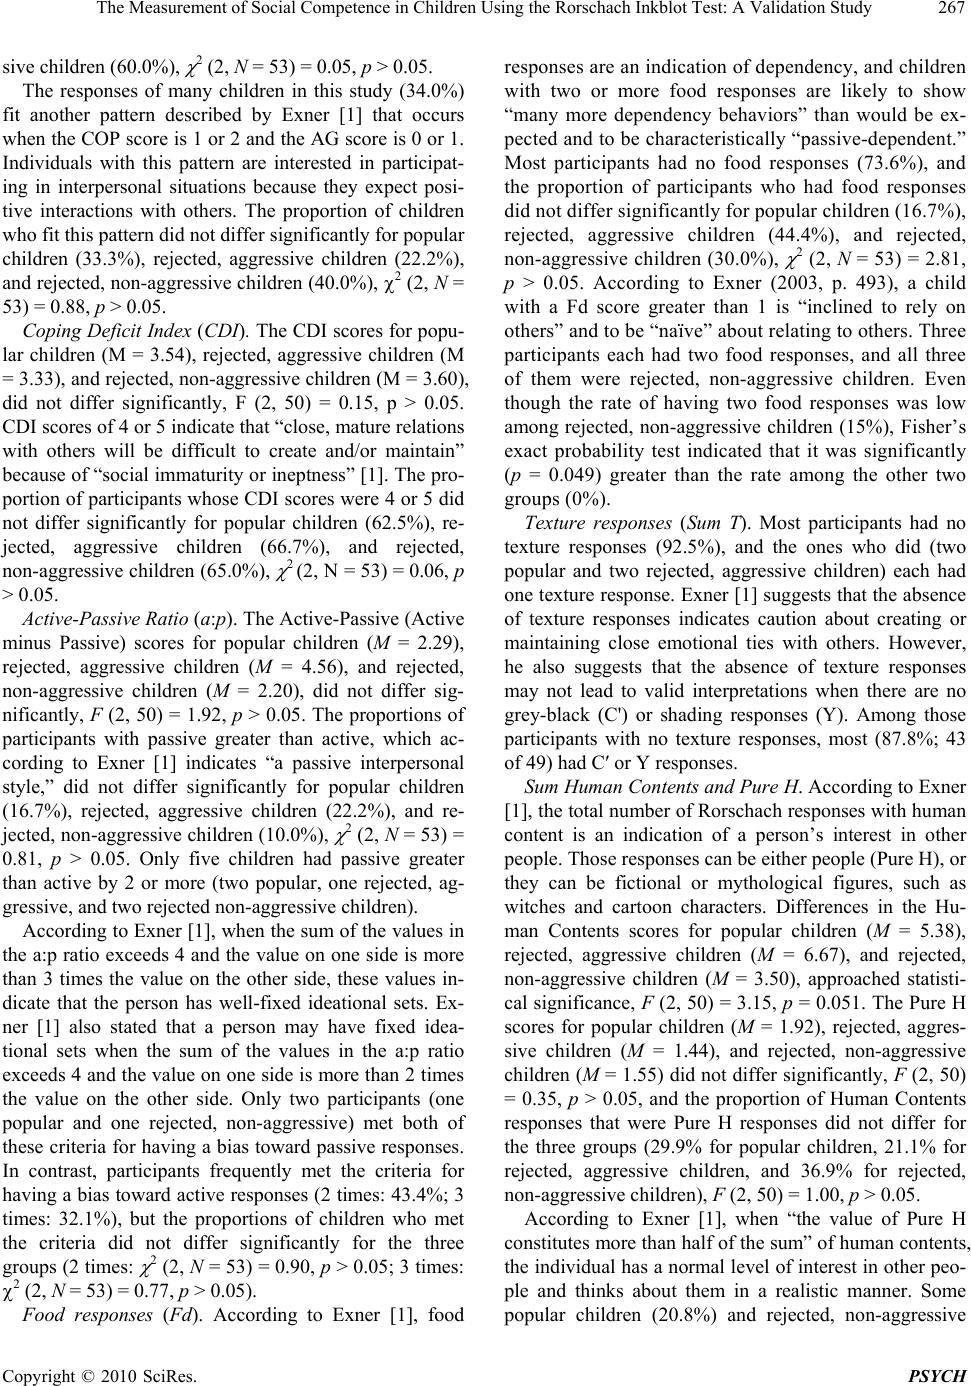 The Measurement of Social Competence in Children Using the Rorschach Inkblot Test: A Validation Study Copyright © 2010 SciRes. PSYCH 267 sive children (60.0%), 2 (2, N = 53) = 0.05, p > 0.05. The responses of many children in this study (34.0%) fit another pattern described by Exner [1] that occurs when the COP score is 1 or 2 and the AG score is 0 or 1. Individuals with this pattern are interested in participat- ing in interpersonal situations because they expect posi- tive interactions with others. The proportion of children who fit this pattern did not differ significantly for popular children (33.3%), rejected, aggressive children (22.2%), and rejected, non-aggressive children (40.0%), 2 (2, N = 53) = 0.88, p > 0.05. Coping Deficit Index (CDI). The CDI scores for popu- lar children (M = 3.54), rejected, aggressive children (M = 3.33), and rejected, non-aggressive children (M = 3.60), did not differ significantly, F (2, 50) = 0.15, p > 0.05. CDI scores of 4 or 5 indicate that “close, mature relations with others will be difficult to create and/or maintain” because of “social immaturity or ineptness” [1]. The pro- portion of participants whose CDI scores were 4 or 5 did not differ significantly for popular children (62.5%), re- jected, aggressive children (66.7%), and rejected, non-aggressive children (65.0%), 2 (2, N = 53) = 0.06, p > 0.05. Active-Passive Ratio (a:p). The Active-Passive (Active minus Passive) scores for popular children (M = 2.29), rejected, aggressive children (M = 4.56), and rejected, non-aggressive children (M = 2.20), did not differ sig- nificantly, F (2, 50) = 1.92, p > 0.05. The proportions of participants with passive greater than active, which ac- cording to Exner [1] indicates “a passive interpersonal style,” did not differ significantly for popular children (16.7%), rejected, aggressive children (22.2%), and re- jected, non-aggressive children (10.0%), 2 (2, N = 53) = 0.81, p > 0.05. Only five children had passive greater than active by 2 or more (two popular, one rejected, ag- gressive, and two rejected non-aggressive children). According to Exner [1], when the sum of the values in the a:p ratio exceeds 4 and the value on one side is more than 3 times the value on the other side, these values in- dicate that the person has well-fixed ideational sets. Ex- ner [1] also stated that a person may have fixed idea- tional sets when the sum of the values in the a:p ratio exceeds 4 and the value on one side is more than 2 times the value on the other side. Only two participants (one popular and one rejected, non-aggressive) met both of these criteria for having a bias toward passive responses. In contrast, participants frequently met the criteria for having a bias toward active responses (2 times: 43.4%; 3 times: 32.1%), but the proportions of children who met the criteria did not differ significantly for the three groups (2 times: 2 (2, N = 53) = 0.90, p > 0.05; 3 times: 2 (2, N = 53) = 0.77, p > 0.05). Food responses (Fd). According to Exner [1], food responses are an indication of dependency, and children with two or more food responses are likely to show “many more dependency behaviors” than would be ex- pected and to be characteristically “passive-dependent.” Most participants had no food responses (73.6%), and the proportion of participants who had food responses did not differ significantly for popular children (16.7%), rejected, aggressive children (44.4%), and rejected, non-aggressive children (30.0%), 2 (2, N = 53) = 2.81, p > 0.05. According to Exner (2003, p. 493), a child with a Fd score greater than 1 is “inclined to rely on others” and to be “naïve” about relating to others. Three participants each had two food responses, and all three of them were rejected, non-aggressive children. Even though the rate of having two food responses was low among rejected, non-aggressive children (15%), Fisher’s exact probability test indicated that it was significantly (p = 0.049) greater than the rate among the other two groups (0%). Texture responses (Sum T). Most participants had no texture responses (92.5%), and the ones who did (two popular and two rejected, aggressive children) each had one texture response. Exner [1] suggests that the absence of texture responses indicates caution about creating or maintaining close emotional ties with others. However, he also suggests that the absence of texture responses may not lead to valid interpretations when there are no grey-black (C') or shading responses (Y). Among those participants with no texture responses, most (87.8%; 43 of 49) had C′ or Y responses. Sum Human Contents and Pure H. According to Exner [1], the total number of Rorschach responses with human content is an indication of a person’s interest in other people. Those responses can be either people (Pure H), or they can be fictional or mythological figures, such as witches and cartoon characters. Differences in the Hu- man Contents scores for popular children (M = 5.38), rejected, aggressive children (M = 6.67), and rejected, non-aggressive children (M = 3.50), approached statisti- cal significance, F (2, 50) = 3.15, p = 0.051. The Pure H scores for popular children (M = 1.92), rejected, aggres- sive children (M = 1.44), and rejected, non-aggressive children (M = 1.55) did not differ significantly, F (2, 50) = 0.35, p > 0.05, and the proportion of Human Contents responses that were Pure H responses did not differ for the three groups (29.9% for popular children, 21.1% for rejected, aggressive children, and 36.9% for rejected, non-aggressive children), F (2, 50) = 1.00, p > 0.05. According to Exner [1], when “the value of Pure H constitutes more than half of the sum” of human contents, the individual has a normal level of interest in other peo- ple and thinks about them in a realistic manner. Some popular children (20.8%) and rejected, non-aggressive  The Measurement of Social Competence in Children Using the Rorschach Inkblot Test: A Validation Study Copyright © 2010 SciRes. PSYCH 268 children (25.0%) had Pure H greater than half of their Human Content responses, but none of the rejected, ag- gressive children showed this pattern. However, these differences were not statistically significant, 2 (2, N = 53) = 2.64, p > 0.05. Isolation Index. The Isolation Index scores for popular children (M = 0.17), rejected, aggressive children (M = 0.26), and rejected, non-aggressive children (M = 0.27), did not differ significantly, F (2, 50) = 2.26, p > 0.05. According to Exner [1], when the Isolation Index is 0.26 or greater, “it indicates that the person tends to be less active in social interaction than might be expected,” and as this index increases it is more and more likely that the person is “socially isolated.” The proportions of children who had Isolation Index scores greater than 0.26 did not differ significantly for the three groups (20.8% for popu- lar children, 44.4% for rejected, aggressive children, and 50.0% for rejected, non-aggressive children), 2 (2, N = 53) = 4.38, p > 0.05. White space (S) responses. The number of S re- sponses given by popular children (M = 3.62), rejected, aggressive children (M = 5.00), and rejected, non-ag- gressive children (M = 3.00), did not differ significantly, F (2, 50) = 2.02, p > 0.05. According to Exner [1], when there are three S responses and at least one of them occurs after Card II, the person is more “negativ- istic or oppositional” than most others. Only five par- ticipants (three popular and two rejected, non-aggres- sive children) fit that pattern (p = 0.84; Fisher Exact Probability Test). According to Exner [1], “the presence of considerable anger” is indicated when there are at least four S responses and one or more of them occur after Card III. The proportions of children who fit this pattern did not differ significantly for the three groups (41.7% for popular children, 55.6% for rejected, ag- gressive children, and 40.0% for rejected, non-aggres- sive children), 2 (2, N = 53) = 0.67, p > 0.05. Egocentricity Index. The Egocentricity Index scores for popular children (M = 0.33), rejected, aggressive children (M = 0.33), and rejected, non-aggressive chil- dren (M = 0.39), did not differ significantly, F (2, 50) = 0.68, p > 0.05. According to Exner [1], a below average Egocentricity Index (< 0.46) indicates that the person has low self-esteem. Most of the participants in this study (79.2%) had an Egocentricity Index that was below av- erage, but the proportions of children with a below aver- age Egocentricity Index did not differ significantly for the three groups (83.3% for popular children, 88.9% for rejected, aggressive children, and 70.0% for rejected, non-aggressive children), p = 0.49 (Fisher Exact Prob- ability Test). Chromatic color responses (FC, CF, and C). The num- ber of FC responses (“those based primarily on form but also involving color,” Exner, [1]) given by popular chil- dren (M = 2.08), rejected, aggressive children (M = 1.33), and rejected, non-aggressive children (M = 1.90), did not differ significantly, F (2, 50) = 0.86, p > 0.05. The number of CF and C responses (those based “primarily” or “exclu- sively” on color) also did not differ significantly for the three groups (Ms = 0.92 for popular children, 2.00 for re- jected, aggressive children, and 1.20 for rejected, non-aggressive children), F (2, 50) = 2.07, p > 0.05. Fur- thermore, the number of CF and C responses minus the number of FC responses did not differ significantly for the three groups (Ms = –1.17 for popular children, 0.67 for rejected, aggressive children, and –0.70 for rejected, non-aggressive children), F (2, 50) = 2.34, p > 0.05. Exner [1] described four patterns of chromatic color responses that he said are common for children, but only one of them was common for participants in this study. That pattern, which occurs when the sum of CF and C responses minus FC responses is 0, 1, or 2, and the num- ber of C responses is 0 or 1, indicates that the person is likely to have “intense” expressions of emotion that may be “inappropriate for the circumstances” [1]. Although more aggressive, rejected children fit this pattern (44.4%) than popular (37.5%) or rejected, non-aggressive (40.0%) children, these differences were not statistically signifi- cant, 2 (2, N = 53) = 0.13, p > 0.05. Indices related to stress tolerance (D and Adjusted D scores). D scores differed significantly for children in the three groups, F (2, 50) = 5.50, p < 0.01, and this differ- ence remained statistically significant when the analysis was repeated with R as a covariate, F (2, 49) = 6.23, p < 0.01. Tukey HSD comparisons indicated that children in the rejected, aggressive group (M = –1.89) had signifi- cantly lower D scores than children in the popular group (M = –0.25), or children in the rejected, non-aggressive group (M = –0.80), but that the D scores of the later two groups did not differ significantly. According to Exner [1], the difference between the D and Adjusted D scores (Adj D – D) provides a “prelimi- nary estimate regarding the magnitude of stress.” In con- trast to the significant group difference in D scores, the Adj D scores of popular children (M = 0.08), rejected, aggressive children (M = –0.56), and rejected, non-ag- gressive children (M = –0.30), did not differ significantly, F (2, 50) = 1.48, p > 0.05. When an individual’s D score is more than 1 point less than that individual’s Adj D scores, it “usually indicates” that there is “substantial” stress that “typically creates considerable interference” with the individual’s thinking or behavior [1]. That pat- tern was significantly more likely to occur for rejected, aggressive children (44.4%) than for popular children (4.2%) or rejected, non-aggressive children (5.0%), p = 0.007 (Fisher Exact Probability Test).  The Measurement of Social Competence in Children Using the Rorschach Inkblot Test: A Validation Study Copyright © 2010 SciRes. PSYCH 269 4. Discussion The current study examined the criterion validity of Ror- schach CS variables reported to assess interpersonal competence in children [1,25]. Three highly distinct and relatively stable groups who differed in social compe- tence were identified: popular children, rejected and ag- gressive children, and rejected children who were non- aggressive. Furthermore, in designing this study, we at- tempted to address some of the methodological criticisms of previous research supporting the use of the Rorschach to assess the quality of interpersonal relationships. In con- trast to the findings of Viglione [4,5] and Exner [1] that support the use Human Representational Response vari- ables as measures of interpersonal effectiveness among adults, little support was found in the current study for the effectiveness of these variables in school-age children. We examined GHR and PHR separately, as well as their relationship when three or more Human Representational responses were given (the number of responses identified as critical for meaningful interpretation by Exner, [1]), and only the tendency of rejected, aggressive children to give a greater number of PHR responses than rejected, non-aggressive children was statistically significant. Because the current study is the first examination of the Human Representational variables among children, it is noteworthy that the differences between groups for these variables were typically in the predicted direction. Specifically, popular children tended to give more GHR responses than either group of rejected children. Fur- thermore, among those children with three or more Human Representational responses, the rejected, ag- gressive children tended to have PHR greater than GHR more often than the other two groups. These findings and the fact that rejected, aggressive children gave more PHR responses than rejected, non-aggressive children suggest that the Human Representational responses may have some potential usefulness in identifying children with distinct problems in social competence, particu- larly with peer aggression and low social acceptance. However, the tendency of rejected, aggressive children to give more PHR responses than other children was linked to their tendency to give a greater number of total responses. The current study does, however, provide a strong caution about using GHR as an indication of social com- petence. Only about half (47.6%) of the popular children had GHR greater than PHR when three Human Repre- sentational responses were provided. This finding sug- gests that a preponderance of GHR over PHR cannot be used as a reliable indication of high social competence in children because some children who are socially compe- tent will have PHR equal to or greater than GHR. While the current results do not support the use of Human Rep- resentational responses as valid measures of social com- petence among children, they do suggest that these re- sponses might provide some useful information about negative and aggressive peer interactions. Aggressive Movement and Cooperative Movement responses are a second set of Rorschach variables that have been directly related to specific social behaviors, with Aggressive Movement having the sturdiest empiri- cal support “indicating increased likelihood for aggres- sive-like behaviors” in both children and adults [1]. Con- sistent with the previous research literature, the current findings revealed that the mean number of aggressive movement responses was greater for the rejected, aggres- sive children than for the other two groups of children. Thus, children identified by their peers as verbally or physically aggressive appear to be inclined to report sig- nificantly more aggressive movement in their Rorschach responses. In contrast to Aggressive Movement, the support for Cooperative Movement in the research literature is mixed (e.g., [26]), and Exner [1] has suggested that “caution” should be used when interpreting these responses. Our findings provided no support for a relationship between Cooperative Movement responses and social competence. There was no significant relationship between this type of response and group membership, whether Cooperative Movement was examined alone or in conjunction with Aggressive Movement. The validation research for Co- operative Movement is weak, and Cooperative Move- ment responses do not always indicate positive interper- sonal attitudes and behaviors [1]. Unfortunately, this in- formation is easy to overlook in Exner’s [1] text, as there are numerous sample interpretations about social compe- tence that mention Cooperative Movement. Furthermore, there is no indication on the structural summary that the Cooperative Movement code is of questionable validity. Thus, an erroneous impression may be created in all but the most diligent Rorschach examiners that Cooperative Movement responses can be used with confidence when interpreting a Rorschach record. Exploratory analyses were conducted with several other Rorschach variables in an effort to evaluate their useful- ness in assessing social competence. The variables ana- lyzed were those identified in the Comprehensive System to have particular relevance to children’s social compe- tence [1], and others thought to be related to the inter- personal perceptions, needs, and experiences of children nominated by their peers as popular, rejected and aggres- sive, or rejected and non-aggressive (e.g., [27-29]). The relevant variables selected from the Interpersonal Cluster included: the Coping Deficit Index (CDI), which when elevated is associated with “social immaturity or inept-  The Measurement of Social Competence in Children Using the Rorschach Inkblot Test: A Validation Study Copyright © 2010 SciRes. PSYCH 270 ness” [1]; Food responses (Fd), which are identified as indicating passive and dependent behaviors; Active and Passive Movement responses, which may be potentially related to a child’s style in interpersonal relations; Tex- ture responses (T), which relate to the child’s need for close relationships; Human Contents and Pure Human (H) responses, which are associated with a child’s interest in and understanding of others; and the Isolation Index which relates to level of social involvement and possible social isolation. In addition, specific variables related to behavioral and emotional control (D, Adj D, and Color responses), hostility or negativism (S), and negative self-esteem (Egocentricity Index) were examined as they have been identified as likely areas of difficulty among rejected, aggressive children or rejected, non-aggressive children [30]. Given the small number of participants in this study and the exploratory nature of many analyses, a more stringent significance level than α = 0.05 was not used in this study, despite the large number of statistical com- parisons. Even with this lenient approach to error-rate inflation, few analyses were significant and most ac- counted for negligible variance. One notable exception was the analysis for D scores. Children rejected by peers and considered aggressive by them had significantly lower levels of D than the other two groups of children, and lower D scores have been shown to indicate discom- fort resulting from both longstanding and situational stress [1,31]. Though not significant, the group differ- ences were in the expected direction for Adj D, which relates to a more enduring discomfort negatively im- pinging on behavioral control. Finally, there was evi- dence that a few rejected, non-aggressive children had an unusual number of Fd responses. Exner [1] suggests that when Fd responses, which occur infrequently, are ele- vated (Fd ≥ 2 for children), it indicates dependent or pas- sive interpersonal behavior. This interpretation is consis- tent with past findings that rejected, non-aggressive chil- dren are often shy and anxious [32,33]. The children in this study gave Rorschach responses that were not consistent with the expected values for several CS variables (CDI, T, S, and the Egocentricity Index). For the CDI, children in all three groups had high mean values, and the majority of participants in all three groups had a CDI of four or five. According to Exner [1], a score in this range should indicate social immaturity and ineptitude. Clearly, this interpretation is unlikely to be correct for the popular children in this study. High CDI scores among the popular children, together with the lack of significant group differences, raise questions about the interpretive value of this index for children. Another variable with unexpected values was T re- sponses. The expectation based on Rorschach CS norma- tive tables and on the interpretive guidelines provided by Exner [1] is for most healthy children to provide one T response. Nearly all children in this study (92.5%) gave no T responses, despite the fact that most children gave responses that were sensitive to the chromatic and shad- ing features of the blots. The current data raise serious concerns about the validity and interpretive utility of some types of Rorschach responses among children. Overall, the findings of the current study provide only marginal support for the use of Human Representational responses in assessing social competence among children. The small number of participants and relatively high Lambda among all three groups may have limited the authors’ ability to identify differences among the three groups. However, the current findings indicate that cau- tion is appropriate when using the examined variables to assess children’s social competence. This caution seems especially needed when using GHR responses to make positive statements about social competence. In fact, no Rorschach variables related to prosocial skills or high social competence were found to distinguish popular children from children in the two peer-rejected groups. In contrast, there was some support for the Rorschach’s ability to identify deficits in social competence, espe- cially for rejected, aggressive children. These children gave significantly more PHR responses and more Ag- gressive Movement responses and also had significantly higher D scores than other children. These findings pro- vide some support for the validity of these specific vari- ables. Although the current findings suggest caution when using the Rorschach CS to assess social competence in children, the authors do not support the conclusion that there should be a moratorium in its use. Even with a small sample and high Lambda, the significant differ- ences found in the current study are noteworthy. Fur- thermore, non-significant differences among the groups were in the anticipated direction for several Rorschach variables (GHR, Adj D, the Isolation Index, and color and white space responses). Clearly, additional research with larger and more diverse samples is needed. Until that goal is achieved, examiners using the Rorschach CS in clinical settings should remain cautious and modest in their interpretations about children’s social competence and should use the test as only one tool within a test bat- tery, so that interpretative statements can be supported across measures. 5. Acknowledgements This research was supported by a grant from the Ror- schach Research Council. The authors thank Jennifer Rigsby, Kim Crosby, and Melissa Santos who helped collect the data for this study.  The Measurement of Social Competence in Children Using the Rorschach Inkblot Test: A Validation Study Copyright © 2010 SciRes. PSYCH 271 REFERENCES [1] J. E. Exner, Jr. “The Rorschach: A Comprehensive Sys- tem, Vol. 1, Basic Foundations,” 4th Edition, Wiley, Ho- boken, 2003. [2] J. M. Wood, M. T. Nezworski, S. O. Lilienfeld and H. N. Garb, “What’s Wrong with the Rorschach? Science Con- fronts the Controversial Inkblot Test,” Jossey-Bass, New York, 2003. [3] G. J. Meyer, “Introduction to the Final Special Section in the Special Series on the Utility of the Rorschach for Clinical Assessment,” Psychological Assessment, Vol. 13, 2001, pp. 419-422. [4] B. Burns and D. J. Viglione, Jr. “The Rorschach Human Experience Variable, Interpersonal Relatedness, and Ob- ject Representation in Nonpatients,” Psychological As- sessment, Vol. 8, 1996, pp. 92-99. [5] W. Perry, A. McDougall and D. V. Viglione, Jr., “A Five-Year Follow-Up on the Temporal Stability of the Ego Impairment Index,” Journal of Personality Assess- ment, Vol. 64, 1995, pp. 112-118. [6] W. Perry and D. V. Viglione, Jr. “The Ego Impairment Index as a Predictor of Outcome in Melancholic De- pressed Patients Treated with Tricyclic Antidepressants,” Journal of Personality Assessment, Vol. 56, 1991, pp. 487-501. [7] J. M. Wood, M. T. Nezworski, W. J. Stejskal, S. Garven and S. G. West, “Methodological Issues in Evaluating Rorschach Validity: A Comment on Burns and Viglione (1996), Weiner (1996), and Ganellen (1996),” Assessment, Vol. 6, 1999, pp. 115-129. [8] J. E. Exner, Jr. “New Research—Additions, Changes, and Deletions,” Alumni Newsletter, 2000, pp. 1-5. [9] N. R. Crick and J. Grotpeter, “Relational Aggression, Gender, and Social-Psychological Adjustment,” Child Development, Vol. 66, 1995, pp. 710-722. [10] K. L. Bierman, “Peer Rejection: Developmental Proc- esses and Intervention Strategies,” Guilford, New York, 2004. [11] J. D. Coie, K. A. Dodge and H. Coppotelli, “Dimensions and Types of Social Status: A Cross-Age Perspective,” Developmental Psychology, Vol. 18, 1982, pp. 557-570. [12] J. Parkhurst and S. Asher, “Peer Rejection in Middle School: Subgroup Differences in Behavior, Loneliness, and Interpersonal Concerns,” Developmental Psychology, Vol. 28, 1992, pp. 231-241. [13] K. R. Wentzel and S. R. Asher, “The Academic Lives of Neglected, Rejected, Popular, and Controversial Chil- dren,” Child Development, Vol. 66, 1995, pp. 754-763. [14] J. D. Coie and K. A. Dodge, “Continuities and Changes in Children’s Social Status: A Five-Year Longitudinal Study,” Merrill-Palmer Quarterly, Vol. 29, No. 3, 1983, pp. 261- 282. [15] J. E. Exner, Jr., “A Rorschach Workbook for the Com- prehensive System,” 4th Edition, Rorschach Workshops, Asheville, 1995. [16] I. B. Weiner, “Editor’s Note: Interscorer Agreement in Rorschach Research,” Journal of Personality Assessment, Vol. 56, 1991, pp. 1. [17] A. Pope, K. Bierman and G. Mumma, “Aggression, Hy- peractivity, and Inattention Immaturity: Behavior Dimen- sions Associated with Peer Rejection in Elementary School Boys,” Developmental Psychology, Vol. 29, 1991 pp. 353-374. [18] G. Fireman, S. Hutcherson, A. Chilton and E. Wang, “Predicting School Disciplinary Problems: The Validity of Peer Nomination Measures,” Texas Tech University, Lubbock, 2002. [19] G. J. Meyer, M. J. Hilsenroth, D. Baxter, J. E. Exner, Jr., J. C. Fowler, C. C. Piers and J. Resnick, “An Examination of Interpreter Reliability for Scoring the Rorschach Com- prehensive System in Eight Data Sets,” Journal of Per- sonality Assessment, Vol. 78, No. 2, 2002, pp. 219-274. [20] P. E. Shrout and J. L. Fleiss, “Intraclass Correlations: Use in Assessing Rater Reliability,” Psychological Bulletin, Vol. 86, No. 2, 1979, pp. 420-428. [21] H. C. Kraemer and C. M. Blasey, “Centring in Regression Analyses: A Strategy to Prevent Errors in Statistical In- ference,” International Journal of Methods in Psychiatric Research, Vol. 13, No. 3, 2004, pp. 141-151. [22] L. G. Portney and M. P. Watkins, “Foundations of Clini- cal Research: Applications to Practice,” 2nd Edition, Prentice Hall, Upper Saddle River, 2000. [23] A. W. Ghent, “A Method for Exact Testing of 2 × 2, 2 × 3, 3 × 3, and Other Contingency Tables, Employing Bino- mial Coefficients,” American Midland Naturalist, Vol. 88, No. 1, 1972, pp. 15-27. [24] G. Keppel, “Design and Analysis: A Researcher’s Hand- book,” 3rd Edition, Prentice-Hall, Englewood Cliffs, 1991. [25] J. E. Exner, Jr. and P. Erdberg, “The Rorschach: A Com- prehensive System. Vol. 2, Advanced Interpretation,” 3rd Edition, Wiley, Hoboken, 2005. [26] S. R. Orduff, L. Centeno and R. M. Kelsey, “Rorschach Assessment of Malevolence in Sexually Abused Girls,” Journal of Personality Assessment, Vol. 73, No. 1, 1999, pp. 100-109. [27] E. S. Buhs and G. W. Ladd, “Peer Rejection as Antece- dent of Young Children’s School Adjustment: An Ex- amination of Mediating Processes,” Developmental Psy- chology, Vol. 37, No. 4, 2001, pp. 550-560. [28] N. R. Crick, J. K. Grotpeter and M. A. Bigbee, “Relation- ally and Physically Aggressive Children’s Intent Attribu- tions and Dealings of Distress for Relational and Instru- mental Peer Provocations,” Child Development, Vol. 73, 2002, pp. 1134-1142. [29] S. Miller-Johnson, J. D. Coie, A. Maumary-Gremaud and K. Bierman, “Peer Rejection and Aggression and Early Starter Models of Conduct Disorder,” Journal of Abnor- mal Child Psychology, Vol. 30, No. 3, 2002, pp. 217-230. [30] D. French and G. Waas, “Behavior Problems of Peer- Neglected and Peer-Rejected Elementary-Age Children: Parent and Teacher Perspectives,” Child Development, Vol. 56, 1985, pp. 246-252.  The Measurement of Social Competence in Children Using the Rorschach Inkblot Test: A Validation Study Copyright © 2010 SciRes. PSYCH 272 [31] D. Weiner-Levy and J. E. Exner, “The Rorschach EA-ep Variable as Related to Persistence in a Task Frustration Situation under Feedback Conditions,” Journal of Per- sonality Assessment, Vol. 45, No. 2, 1981, pp. 118-124. [32] H. Inderbitzen, K. Walters and A. Bukowski, “The Role of Social Anxiety in Adolescent Peer Relations: Differ- ences among Sociometric Status Groups and Rejected Subgroups,” Journal of Clinical Child Psychology, Vol. 26, No. 4, 1997, pp. 338-348. [33] A. Zakriski and J. Coie, “A Comparison of Aggres- sive-Rejected and Nonaggressive-Rejected Children’s In- terpretations of Self-Directed and Other-Directed Rejec- tion,” Child Development, Vol. 67, No. 3, 1996, pp. 1048- 1070. |

