Paper Menu >>
Journal Menu >>
 J. Biomedical Science and Engineering, 2010, 3, 1061-1068 JBiSE doi:10.4236/jbise.2010.311137 Published Online November 2010 (http://www.SciRP.org/journal/jbise/). Published Online November 2010 in SciRes. http://www.scirp.org/journal/jbise Gene finding by integrating gene finders Yudong Cai1, Zhisong He2,3, Lele Hu4, Bing Li4, Yi Zhou4, Han Xiao4, Zhiwen Wang4, Kairui Feng7, Lin Lu5, Kaiyan Feng6, Haipeng Li2 1Institute of System Biology, Shanghai University, Shanghai, China; 2CAS-MPG Partner Institute for Computational Biology, Shanghai Institutes for Biological Sciences, Chinese Academy of Sciences, Shanghai, China; 3Department of Bioinformatics, College of Life Sciences, Zhejiang University, HangZhou, China; 4Department of Life Science and Technology, Huazhong University of Science and Technology, Wuhan, China; 5Department of Biomedical Engineering, Shanghai Jiao Tong University, Shanghai, China; 6Division of Imaging Science & Biomedical Engineering, University of Manchester, Manchester, UK; 7Simcyp Limited, Blades Enterprise Centre, Sheffield, UK. Email: cai_yud@yahoo.com.cn; lihaipeng@picb.ac.cn Received 26 August 2010; revised 21 September 2010; accepted 30 September 2010. ABSTRACT Gene finding, the accurate annotation of genomic DNA, has become one of the central topics in bio- logical research. Although various computational me- thods (gene finders) have been proposed and devel- oped, they all have their own limitations in gene findings. In this paper, we introduce an integrating gene finder, which combines the results of several existing gene finders together, to improve the accu- racy of gene finding. Four integration schemes, based on majority voting, are developed for the analysis of two datasets – the basic dataset and the testing data- set. The basic dataset consists of 1500 DNA sequences and the testing dataset consists of 103 DNA sequences. It is demonstrated that a simple integration (a simple voting for each nucleotide) can significantly improve the finding performance, and removing confusing gene finders, caused by poor performance or redun- dant results, is important for a further improvement of the integration. The best prediction results are ob- tained using weighted majority voting, aided by the mRMR (Minimum Redundancy Maximum Relevan- ce) (Peng, 2005) method for the gene finder selection. The prediction accuracies are 84.16% and 90.06% for the basic dataset and testing dataset respectively, which are better than any individual gene finding software in our research. Keywords: Gene Finding; Intergration; mRMR 1. INTRODUCTION Genomes are sequenced very rapidly in recent years due to the advance of the sequencing technique. However, the interpretation of the sequences, including the accu- rate annotation of genomic DNA, has proved to be a much more difficult task. Although experimentation can be performed to detect genes, the process is lengthy and tedious. The most important and widely used methods today for gene finding are the computational ones. However, lack of accuracy is the main problem for gene prediction. These gene finders have various mechanisms for finding genes: some are based on evidence-based gene finding, i.e., using existing known genes or protein sequences to search and find the unknown genes, e.g. computational gene finders Genie [1] and GeneParser3 [2]; some are using the intrinsic genetic signals such as the splice sides, start and stop codons for the gene find- ing, e.g. Genie, Genmark [3], GeneID [4], and Genescan [5]. As far as the algorithms are concerned, some use artificial neural network such as the Genie, many use the Hidden Markov Models (HMM) such as Genie, Genscan and Fgenesh [6], some use dynamic programming such as the Fgenesh and Genie, and some are aided by Blast [7] such as the Twinscan software [8]. Though there is severe algorithm and strategy overlap between the gene finders, there is also huge discrepancy between them in the algorithms and the detailed operations. In the paper, we introduce a voting strategy to integrate the results of the gene finders to strengthen the gene finding and pre- diction capability. The Condorcet Jury Theorem proved that the judg- ments of a committee are superior to those of individuals [9]. Such a theorem also holds true for the prediction and classification algorithms since many investigations have found that integrating decisions from hybrid decision  Y. D. Cai et al. / J. Biomedical Science and Engineering 3 (2010) 1061-1068 Copyright © 2010 SciRes. JBiSE 1062 (classification) algorithms can significantly improve the prediction, classification and recognition performance. These investigations include character and handwriting recognition [10-14], image analysis and segmentation [11,15,16], automated credit card slip processing [17], speaker identification [18], and other applications [19- 21]. All these multi-predictor integrations make use of all the candidate predictors for their applications. Se- lecting all candidate predictors is simple and straight- forward. However, similar predictors may strengthen each other and dominate the decisions, e.g. if the same algorithm is used twice, the decision will be biased to- wards that algorithm. Similarly, if too many algorithms from the same kind are involved in the decision, the de- cision will be biased towards that kind of algorithms. To avoid this problem, redundant gene finders (redundancy overtakes the complementary capability) should be re- moved from the integration. mRMR method [22] is originally developed for feature selection and analysis, which is transferred into the selection of gene finders in the research. On the other hand, better performed gene finder should be weighted higher, and vice versa. There- fore, we first select complementing gene finders through mRMR method, then use majority voting with weighting to integrate the filtered gene finders. The weight of each gene finder is set to be the AC values (defined in Mate- rial and Method), which is used to represent the finding accuracy. In the research, we choose eight famous and classical gene-finding softwares from genefinding.org (http:// www.ge nefinding.org/software.html, see below for de- tails). In order to compare simple integration system with the further refined integration system, four schemes are implemented, which are Simple Majority Voting with Simple Software Selection (SMV_SSS), Weighted Ma- jority Voting with Simple Software Selection (WMV_ SSS), Simple Majority Voting with mRMR Software Selection (SMV_MSS) and Weighted Majority Voting with mRMR Software Selection (WMV_MSS). In our research, WMV_MSS performed best. Its prediction accuracies reached 84.16% and 90.06% for the basic dataset and testing dataset. The weight of the gene find- ers is set to be the gene finding accuracy defined below. Simple software selection purely takes the software with higher accuracy first without considering the redundancy, while mRMR software selection takes consideration of the software redundancy as well as the accuracy. These schemes are introduced in detail below. 2. MATERIALS AND METHODS 2.1. Data Preparation The datasets we study consist of two parts: the basic dataset and the testing dataset. The basic dataset is taken from The University of Maryland Center for Bioinfor- matics and Computational Biology (http://www.cbcb. umd.edu/research/genefinding.shtml#genedata), with 1500 sequences from human beings. 767 sequences of them are translated using the forward chains, while the other 733 are translated using the reverse chains. The DNA sequences in the HMR195 dataset (http://www.cs.ub c.ca/ ~rogic/evaluation/dataset.html) are taken as the testing dataset. The testing dataset contains 195 gene sequences, among which 103 are from human, 82 are from the mice, and the rest 10 sequences are from the rats. All these 195 sequences are translated forward, and entered the Gen- Bank after August 1997. The basic dataset is used for testing and obtaining the TAC values (refer to “Accuracy Test” below) for each gene finder, while the testing dataset is used only for testing the integration. Because the TAC values are fed back for the integration through weighting in some integration schemes, the gene finding results might be biased when using the basic dataset. However, since the finding accuracy is rather stable es- pecially with a large dataset, the bias is neglectable. For scrutiny, a testing dataset is independently used for test- ing by taking the gene finder accuracy from the basic dataset. 2.2. Software for the Gene-Finding In this study, we chose 8 gene-finding softwares from genefinding.org. They are Augustus [23], Fgenes [6], Fgenesh [6], Genscan [5], Geneid [4], Genie [1], HMMgene [24] and Twinscan [8]. Please refer to sup- plemental material 1 for the brief description of these 8 softwares. 2.3. Data Encoding and Decoding The predicted protein sequences need to be encoded with digital numbers so that the predicted protein sequences can be integrated. Because the protein sequences are translated by the DNA sequences, we code the DNA sequences so that the predicted protein sequence can be uniquely decoded back by the coded DNA sequences. In the coding method, number 0, 1, 2 and 3 are used to represent the state of every nucleotide in a sequence. Number 0 means the nucleotide is in the noncoding re- gion, while number 1, 2 and 3 means this nucleotide is in a codon: number 1 means that the nucleotide is in the first position of the codon, number 2 means it is in the second position of the codon and number 3 indicates the last position. The encoded sequence can be easily de- coded and translated back into a protein sequence: firstly, nucleotides marked with 0 are removed, then every codon (three consecutive nucleotides) marked with “1, 2, 3” are translated into amino acid. In summary, every DNA sequence is coded according to the predicted se-  Y. D. Cai et al. / J. Biomedical Science and Engineering 3 (2010) 1061-1068 Copyright © 2010 SciRes. JBiSE 1063 quences from every software, then the eight coded se- quences from the eight software are integrated using the four integration schemes described below, finally the encoded integrated sequences could be decoded to ob- tain the final translated protein sequences. 2.4. Accuracy Test In our study, we used ClustalW2 [25] to align the real coded protein sequences with its predicted coded protein sequences. Base on this alignment, the AC values, rep- resenting the accuracy of the gene finding, can be calcu- lated as follows. Assume the number of amino acids matched in the alignment is n, the length of real protein coded by this sequence is r l, the length of predicted protein is p l, and length of the longest protein that is possibly trans- lated from a DNA with such a length is M l. The ap- proximate correlation [26] is used to represent the gene finding accuracy in the research, which can be estimated as follows: TP n, P F Pl n, M PR TNln ll, R F Nl n The average conditional probability (ACP) is defined as: 1 4 TP TP TNTN ACP TP FNTP FPTNFNTNFP The Approximate Correlation (AC) of the gene finding is calculated as: AC = 2 (ACP – 0.5). AC = –1, 0, 1 indicate a total nega- tive, a random, and a perfect finding. Assume the number of sequences in the data set is N, the total accuracy of prediction of the software of inte- gration scheme is: 1 N i i TACAC N Take the sequence “ENST00000013916” in the basic dataset predicted by Genscan as an instance (See Sup- plemental Material 2 for further detail): the length of this DNA sequence is 22214 bp, so the length of the longest protein which is possibly translated by a 22214 bp DNA is 22214 / 37404.67 M l. Based on the CDS (Coding Sequence) of the DNA, we can get the real protein se- quence of its translation. Its length is 558 R l. The predicted sequence by Genscan is also translated into protein sequence. Its length is 908 p l. With these two protein sequences, ClustalW2 is used to align them to get the number of the matching amino acids, which is 550n (Please refer to Supplemental Material 2 for the alignment results). With all these parameters, ap- proximate correlation is calculated as0.8845AC . 2.5. mRMR (Minimum Redundancy Maximum Relevance) Maximum Relevance, Minimum Redundancy method (mRMR) [22] is originally developed by Peng for mi- croarray data processing. mRMR method requires the input data to be numeric vectors–each vector is taken as a mRMR feature. mRMR ranks each feature according to both its relevance to the target (highly related to the prediction accuracy) and the redundancy between the features. A “good” feature is characterized by maximum relevance with the target variable and minimum redun- dancy within the features. Both relevance and redun- dancy are defined by mutual information (MI), which estimates how much one vector is related to another. MI is defined as follows: , ,,log pxy I xy pxydxdy pxpy (1) x and y are two vectors; (, )pxy is the joint probabilis- tic density; ()px and ()py are the marginal prob- abilistic densities. Let Ω denote the whole vector set. The already-se- lected vector set with m vectors is denoted by s , and the to-be-selected vector set with n vectors is denoted by t . Relevance D of a feature f in t with a target variable c can be computed by Eq.2. ,DIfc. (2) Redundancy R of a feature f in t with all the features in s can be computed by Eq.3 1, is i f RIff m . (3) To maximize relevance and minimize redundancy, mRMR function is obtained by integrating Eq.2 and Eq.3: , 1 max,1, 2,..., jt is jji ff I fcIff jn m (4) Let the initial {} s i f where i f is vector from the best performed gene finder, and 121 1 { ,,...,,,...,} tiin fff ff by excluding onlyi f . Eq.4 is used to obtain one vector by another in totally 1n rounds, resulting a vector list with the selection order '' '' 01 1 , ,...,,..., hN Sff ff where h denotes at which round the feature is selected. In this research, mRMR method is used to rank and select the 8 softwares. The predicted results are coded by number 0,1,2,3, as is described above, and become nu-  Y. D. Cai et al. / J. Biomedical Science and Engineering 3 (2010) 1061-1068 Copyright © 2010 SciRes. JBiSE 1064 meric vectors. The real coded protein sequence is re- garded as the target vector, and each gene finder results in a numeric vector. From these vectors the 8 softwares can be ranked by the mRMR method. How to use these ranked softwares for the integration is described in the following sections. 2.6. Algorithm of Integration Scheme Four integration schemes are introduced in the section. 2.6.1. SMV_SSS and SMV_MSS SMV_SSS (Simple Majority Voting with Simple Soft- ware Selection), like its name, is the simplest integration scheme in the research. The coded real sequence and the coded predicted sequences are the input vectors of SMV_SSS. Therefore, there are 9 vectors, among which, 8 vectors come from the 8 softwares (called as software vectors), and the remaining 1 vector is the coded real protein sequence (called as real vector). AC (described above) can be calculated for each software vector. Firstly, a software list is obtained simply according to the AC values '' '' 01 1 , ,...,,..., hN Sff ff where the higher position the software is in, the higher AC value the soft- ware obtains. Next, we initialize the software set as ' 10 {}Sf and then add software within the software list one by one to the initial software set, resulting a series of software set 12 , ,...,8 N SSS N, where '' ' 01 1 { ,...,} ii Sfff , e.g. '''' 40123 {, , ,}S ffff. Because '' 201 {,}Sff only contains two software, the integra- tion result 2 () A CS is set to be the AC value of soft- ware ' 0 f , i.e., ' 20 () () A CSAC f. For the rest of the software sets ( 3,...,8) i Si, the state of each nucleotide (coded by 0, 1, 2 or 3), gaining the majority votes from the software in the software set, is set to be the state of the nucleotide. This can be formulated as follows: j p denotes the state of a nucleotide n predicted by soft- ware ' j f , then a counting function () s X a can be de- fined as follows: 1 0 s as Xa as where a and s are the state num- bers 0, 1, 2 or 3. The total voting counts for a state s is defined as 0 i s sj j CXp (5) The integrated state for nucleotide n using software set i S is set to be {0,1,2 ,3} ()arg max is sn Sn C , which is the state that gains the majority votes from all the softwares in i S. If two or more than two states gain the same votes, choose the state supported by the best software. Therefore, the whole sequence can be integrated using i S with the AC value being denoted as () i A CS . The AC value obtained by SMV_SSS is set to be highest AC values obtained by all the algorithm sets (2,...,8) i Si : _2 max N SMV SSSi i A CACS . The process of SMV_MSS (Simple Majority Voting with mRMR Software Selection) is exactly the same as the SMV_SSS except that the algorithm list is provided by mRMR method (please refer to 2.5). Unlike SMV_SSS, SMV_MSS not only consider the software performance, but also the redundancy between the soft- wares. Thus the next software added into the software set is optimized by both software performance and soft- ware redundancy. 2.6.2. WMV_SSS and WMV_MSS WMV_SSS (Weighted Majority Voting with Simple Software Selection) is similar to SMV_SSS except that the software is weighted by the AC value rather than being weighted equally. The total voting count in Eq.5 becomes ' 0 i s sj j j CXpACf , that is, each vote is weighted by the AC value. The rest is exactly the same as the SMV_SSS. As for the WMV_MSS, the readers can easily deduce how it processes. WMV_MSS is the most refined inte- gration system because it weights the software with the AC values after the software set is optimized by the mRMR method. 2.7. An Example for the Integration Methods This section demonstrates how to encode and integrate the prediction of sequence AB010281 in HMR195 data- set with individual predictors, and finally obtain the amino acid sequence using our integration methods. En- coding the prediction results of all the 8 softwares, we get the state matrix of this DNA sequence, where each vector of the matrix is the coded protein sequence from a gene finder (see supplemental material 3). Let us first demonstrate how to integrate the results using SMV_SSS. The votes for each nucleotide are first counted for each software set. For instant, the predicted states of the 28th nucleotide are: 1 0 1 1 0 1 1 0 where each state comes from each of the 8 softwares, respectively. If all 8 softwares are selected, we can see that 1 appears 5 times and 0 appears 3 times. So state 1 gets the majority votes and the integrated state of the 28th nucleotide is set to be 1. In this way, we could get the whole state sequence using SMV_SSS scheme when all softwares are included. Similarly, the votes can be counted when 3-8 softwares involve. Notice that the AC values for the 8 softwares are 0.8000 (Fgenesh), 0.7437 (Fgenes), 0.6487 (HMMgene), 0.6224 (Genie), 0.8008  Y. D. Cai et al. / J. Biomedical Science and Engineering 3 (2010) 1061-1068 Copyright © 2010 SciRes. JBiSE 1065 (Genscan), 0.7579 (Geneid), 0.7158 (Augustus), 0.7702 (Twinscan), and the software is added with descending AC value. For the WMV_SSS, each software is weighted by its AC value. Again, let us take the 28th nucleotide as an instance: the score of state 1 is 3.5448, and the score of 0 is 2.3147 when all 8 softwares are included. So the inte- gration state of this nucleotide is 1. In this way, we can get the whole state sequence using WMV_SSS scheme (see Supplemental Material 3). The mRMR software selection schemes process in the same way as the simple software selection schemes, except that the software is added in a different order (refer to Table 2 for the list). With the integrated state sequence and the DNA se- quence, we can get the predicted mRNA sequence. First remove all the nucleotides with state 0, then, remove the nucleotides with an incomplete reading frame. For in- stance, after removing all 0s in the SMV_SSS integra- tion state sequence with 8 softwares, we can see a state fragment “…12312123…” corresponding with the DNA fragment “…GACAGATG”. Obviously, the reading frame “AG” is incomplete, and they are removed. In this way, we can get the final predicted mRNA sequence (see Supplemental Material 3). The mRNA sequence is translated into a protein sequence by translating each codon into an amino acid. 3. RESULTS AND DISCUSSIONS 3.1. Prediction Results of the 8 Gene-Finding Softwares The basic dataset (1500 sequences) and the testing data- set (103 sequences) are input into the 8 gene-finding softwares (described above), and produce the predicted protein sequences. The TAC values (defined above) are calculated to rate the performance of the gene-finding softwares. These TAC values are shown in Table 1. The TAC values, obtained by the basic dataset, will be used as the weight of the corresponding software when inte- grating by schemes WMV_SSS and WMV_MSS. 3.2. Result of mRMR The feature vectors input into mRMR method consist of all the predicted results from the 8 software for the 1500 sequences–each sequence contains thousands of nucleo- tides–and the coded real protein sequence. By joining the coded sequences together, it results in nine 1405899- dimensional vectors. Since the complementation capa- bility of each gene finder is the main focus, the dimen- sion is deleted using the command “uniq” in Linux if the related nucleotide in that dimension has the same state number for all the 9 vectors. After the deletion, 94700- dimensional vectors remain as the input for the mRMR method (see Supplemental Materials 4 for details). The mRMR program used in this contribution is downloaded from website http://research.janelia.org/peng/ proj/mRMR/. As all of the input vectors are integer vec- tors, we specify the parameter 0t in the mRMR pro- gram to tackle the integral calculation. mRMR method outputs the list of the software (see Supplemental Material 5 for the parameter setting of mRMR program). The mRMR list is shown in Table 2. This list is used in the integration of the softwares as is described above. 3.2. Results of SMV_SSS, WMV_SSS, SMV_MSS and WMV_MSS Seven TAC values are obtained for each of the integra- tion schemes since each scheme integrates two to eight gene finders. The best TAC value of the Seven TAC values is taken as the TAC value of the integration scheme. Table 3 shows all the integration results. WMV_MSS performs best both in the basic dataset and the testing dataset since its TAC rates are 84.16% and 90.06% when six software are integrated. Figure 1 plots all the seven TAC values for the four integration sche- mes. Table 1. The performance of 8 gene-finding software. NO Software Training Set Test Set 1 Genscan 80.08% 84.50% 2 Fgenesh 80.00% 86.43% 3 Twinscan 77.02% 82.52% 4 Geneid 75.79% 76.45% 5 Fgenes 74.37% 77.12% 6 Augustus 71.58% 85.49% 7 HMMgene 64.87% 68.51% 8 Genie 62.24% 79.40% Table 2. The rank of 8 gene-finding software in mRMR. Rank Software 1 Fgenesh 2 Fgenes 3 HMMgene 4 Genie 5 Genscan 6 Geneid 7 Augustus 8 Twinscan  Y. D. Cai et al. / J. Biomedical Science and Engineering 3 (2010) 1061-1068 Copyright © 2010 SciRes. JBiSE 1066 Table 3. The performance of four predictors. Accuracy Predictor Training Set Test Set The best individual software 80.08% 86.43% 2 80.08% 86.43% 3 81.30% 87.29% 4 81.94% 86.23% 5 83.55% 89.90% 6 83.14% 88.32% 7 83.34% 89.05% SMV_SSS 8 83.24% 88.85% 2 80.08% 86.43% 3 81.30% 87.29% 4 81.35% 87.29% 5 83.47% 89.87% 6 83.46% 90.04% 7 83.30% 89.07% WMV_SSS 8 83.23% 89.15% 2 80.00% 86.43% 3 83.24% 89.84% 4 82.98% 89.77% 5 83.94% 88.27% 6 83.90% 88.85% 7 84.00% 89.84% SMV_MSS 8 83.24% 88.85% 2 80.00% 86.43% 3 83.24% 89.84% 4 82.98% 89.77% 5 84.06% 88.63% 6 84.16% 90.06% 7 84.06% 89.84% WMV_MSS 8 83.23% 89.15% 4. DISCUSSIONS From Table 3, we can see that nearly all integrated gene finders are better than the best single gene finder, except that when four software are integrated using SMV_SSS on the testing dataset. Therefore, integrated gene finders are significantly better than single gene finder in gene finding. This indicates that gene finders are comple- menting each other for gene finding. From Figure 1(a), WMV_MSS performs consistently better than other integration schemes on processing the basic dataset, and in Figure 1(b), in majority cases WMV_MSS performs better than other integration schemes. Therefore, WMV_MSS is the best integrator among the four. SMV_MSS is the second best integrator for the basic dataset since in Figure 1(a) it performs consistently better than the rest two integration schemes. As for the testing dataset in Figure 1(b), it is hard to tell whether SMV_MSS or WMV_SSS is better. We cannot tell whether WMV_SSS or SMV_SSS is better for the basic dataset from Figure 1. And SMV_MSS performs better than SMV_SSS consistently in Figure 1(a), and also in the majority cases in Figure 1(b). Therefore, mRMR software selection does improve the integration results since WMV_MSS is better than WMV_SSS and SMV_MSS is better than SMV_SSS in the integration. Weighting contributes slightly towards the integration since WMV_MSS is slightly better than SMV_MSS in both basic and testing dataset, and WMV_SSS is slightly better than SMV_SSS in proc- essing the testing dataset. In SMV_MSS and WMV_ MSS, when the last two softwares Twinscan and Augus- tus are added into the integration, the prediction perfor- mance is worse (see Table 3 and Figure 1). Twinscan is the 3rd best software. However, this software can be treated as the combination of Genscan and BLAST (see Supplemental Material I for further detail). Therefore, Genscan and other softwares must have covered the pre- diction capacity provided by Twinscan, causing the re- dundancy of Twinscan. For Augustus, it is in the 5th po- sition in the software list according to the TAC values, and its algorithms are similar to some of the other soft- wares. So Augustus is also removed by the mRMR crite- ria. 5. CONCLUSIONS We introduce some integrating schemes for some gene finder softwares in this investigation. The results indicate that these gene finders are able to complement each other and a simple combination of them performs sig- nificantly better than the best individual gene finder. mRMR (minimum redundancy and maximum relevance) method is proved to be very important for the further improvement of the prediction performance. Assigning 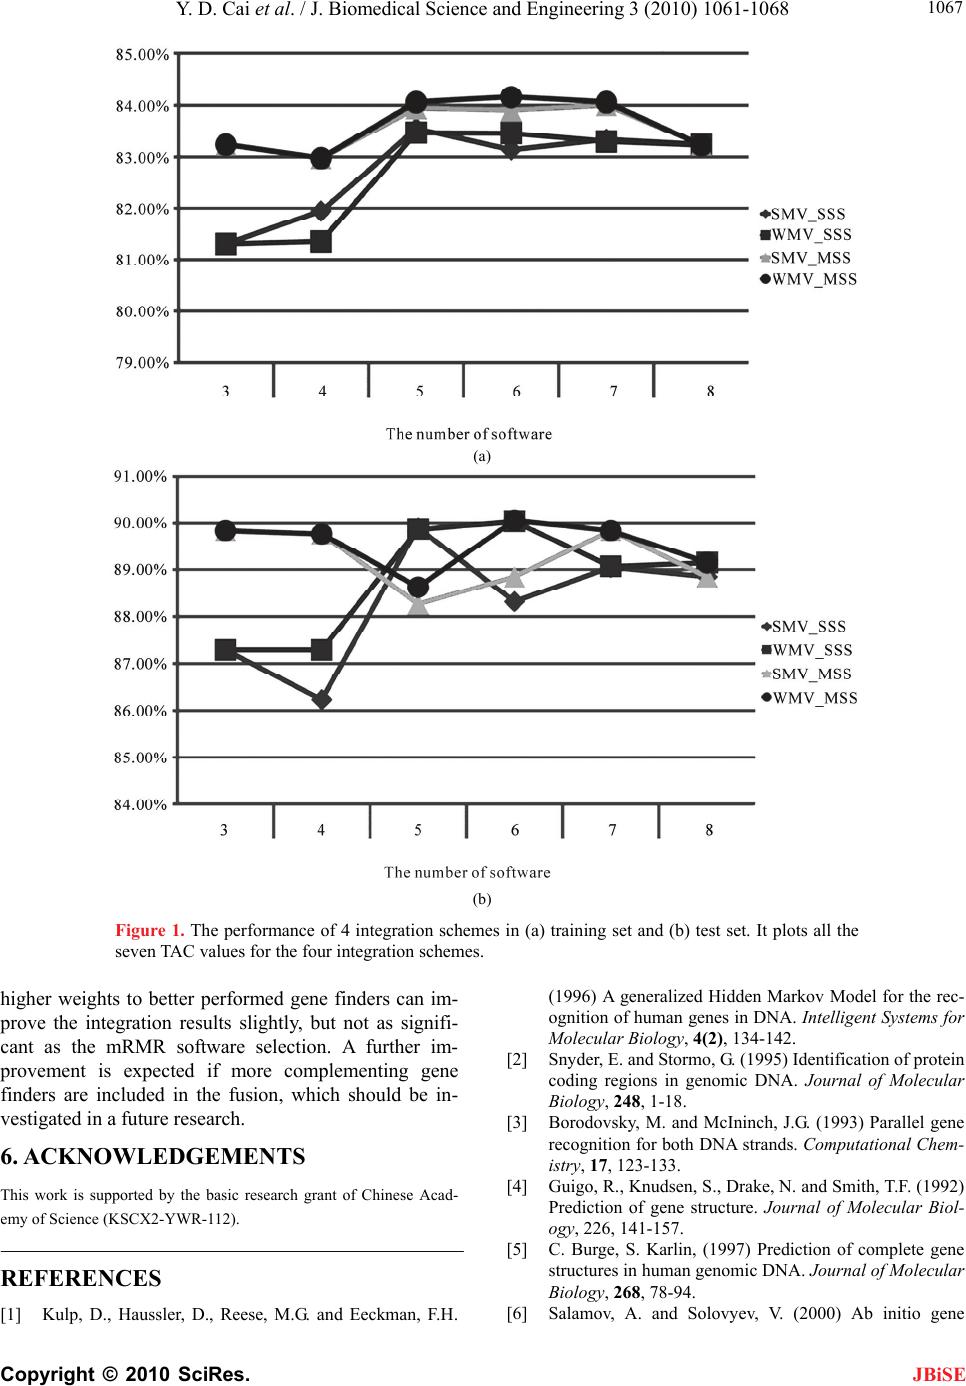 Y. D. Cai et al. / J. Biomedical Science and Engineering 3 (2010) 1061-1068 Copyright © 2010 SciRes. JBiSE 1067 (a) (b) Figure 1. The performance of 4 integration schemes in (a) training set and (b) test set. It plots all the seven TAC values for the four integration schemes. higher weights to better performed gene finders can im- prove the integration results slightly, but not as signifi- cant as the mRMR software selection. A further im- provement is expected if more complementing gene finders are included in the fusion, which should be in- vestigated in a future research. 6. ACKNOWLEDGEMENTS This work is supported by the basic research grant of Chinese Acad- emy of Science (KSCX2-YWR-112). REFERENCES [1] Kulp, D., Haussler, D., Reese, M.G. and Eeckman, F.H. (1996) A generalized Hidden Markov Model for the rec- ognition of human genes in DNA. Intelligent Systems for Molecular Biology, 4(2), 134-142. [2] Snyder, E. and Stormo, G. (1995) Identification of protein coding regions in genomic DNA. Journal of Molecular Biology, 248, 1-18. [3] Borodovsky, M. and McIninch, J.G. (1993) Parallel gene recognition for both DNA strands. Computational Chem- istry, 17, 123-133. [4] Guigo, R., Knudsen, S., Drake, N. and Smith, T.F. (1992) Prediction of gene structure. Journal of Molecular Biol- ogy, 226, 141-157. [5] C. Burge, S. Karlin, (1997) Prediction of complete gene structures in human genomic DNA. Journal of Molecular Biology, 268, 78-94. [6] Salamov, A. and Solovyev, V. (2000) Ab initio gene  Y. D. Cai et al. / J. Biomedical Science and Engineering 3 (2010) 1061-1068 Copyright © 2010 SciRes. JBiSE 1068 finding in drosophila genomic DNA. Genome Research, 10, 516-522. [7] Altschul, S.F., Gish, W., Miller, W., Myers, E.W. and Lipman, D.J. (1990) Basic local alignment search tool. Journal of Molecular Biology, 215, 403-410. [8] Korf, I., Flicek, P., Duan, D. and Brent, M.R. (2001) Integrating genomic homology into gene structure pre- diction. Bioinformatics, 17, S140-S148. [9] Condorcet, N.C. (1785) Essai sur l’application de l’analyse à la probabilité des decisions rendues à la plu- ralité des voix. Imprimerie Royale, Paris. [10] Huang, Y.S. and Suen, C.Y. (1995) A method of combin- ing multiple experts for the recognition of unconstrained handwritten numerals. IEEE Transactions on Pattern Analysis and Machine Intelligence, 17, 90-94. [11] Lam, L., Huang, Y.S. and Suen, S.Y. (1997) Combination of multiple classifier decisions for optical character rec- ognition. In: Bunke, H. and Wang, P.S.P., Eds., Hand- book of Character Recognition and Document Image Analysis, World Scientific Publishing Company, New Jersey, 79-101. [12] Suen, C.Y., Nadal, C., Mai, T.A., Legault, R. and Lam, L. (1990) Recognition of totally unconstrained handwritten numerals based on the concept of multiple experts. Pro- ceedings of IWFHR, Montreal, 131-143. [13] Stajniak, A., Szostakowski J. and Skoneczny, S. (1997) Mixed neural-traditional classifier for character recogni- tion. Proceedings of SPIE - The International Society for Optical Engineering, 2949, 102-110. [14] Rahman, A.F.R., Alam, H. and Fairhurst, M.C. (2002) Multiple classifier combination for character recognition: Revisiting the majority voting system and its variation. Lecture Notes in Computer Science, 2324, 167-178. [15] Ho, T.K., Hull, J.J. and Srihari, S.N. (1992) Combination of decisions by multiple classifiers. In: Baird, H.S., Bunke, H. and Yamamoto, K., Eds., Structured Document Image Analysis, Secaucus, Springer-Verlag Inc., New York, 188-202. [16] Rohlfing, T., Russakoff, D.B. and Maurer, C.R. (2004) Performance-based classifier combination in atlas-based image segmentation using expectation-maximization pa- rameter estimation. IEEE Transactions on Medical Im- aging, 23, 983-994. [17] Paik, J., Jung, S. and Lee, Y. (1993) Multiple combined recognition system for automatic processing of credit card slip applications. Proceedings of the 2nd Interna- tional Conference on Document Analysis and Recogni- tion, IEEE Computer Society Press, California, 520-523. [18] Altincay, H. and Demirekler, M. (2000) An information theoretic framework for weight estimation in the combi- nation of probabilistic classifiers for speaker identifica- tion. Speech Communication, 30, 255-272. [19] Lam, L. and Suen, C.Y. (1997) Application of majority voting to pattern recognition: An analysis of its behavior and performance. IEEE Transactions on Pattern Analysis, 27, 553-568. [20] Lam, L. and Suen, C.Y. (1997) A theoretical-analysis of the application of majority voting to pattern-recognition. Jerusalem, Israel, 418-420. [21] Rahman, A.F.R. and Fairhurst, M.C. (1997) Exploiting second order information to design a novel multiple ex- pert decision combination platform for pattern classifica- tion. Electronics Letters, 33, 476-477. [22] Peng, H.C., Long, F.H. and Ding, C. (2005) Feature se- lection based on mutual information: Criteria of max- dependency, max-relevance, and min-redundancy. IEEE Transactions on Pattern Analysis and Machine Intelli- gence, 27, 1226-1238. [23] Stanke, M. and Waack, S. (2003) Gene prediction with a hidden-Markov model and a new intron Submodel. Bio- informatics, 19(Suppl. 2), ii215-ii225. [24] Krogh, A. (1997) Two methods for improving perform- ance of a HMM and their application for gene finding. In: Gaasterland, T., Karp, P., Karplus, K., Ouzounis, C., Sander, C. and Valencia, A., Eds., Proceedings of the 5th International Conference on Intelligent Systems for Mo- lecular Biology, AAAI Press, Menlo Park, 179-186. [25] Larkin, M.A., Blackshields, G., Brown, N.P., Chenna, R., McGettigan, P.A., et al., (2007) “ClustalW2 and ClustalX version 2,” Bioinformatics, 23, 2947-2948. [26] Burset, M. and Guigo, R. (1996) Evaluation of gene structure prediction programs. Genomics, 34, 353-367. |