Paper Menu >>
Journal Menu >>
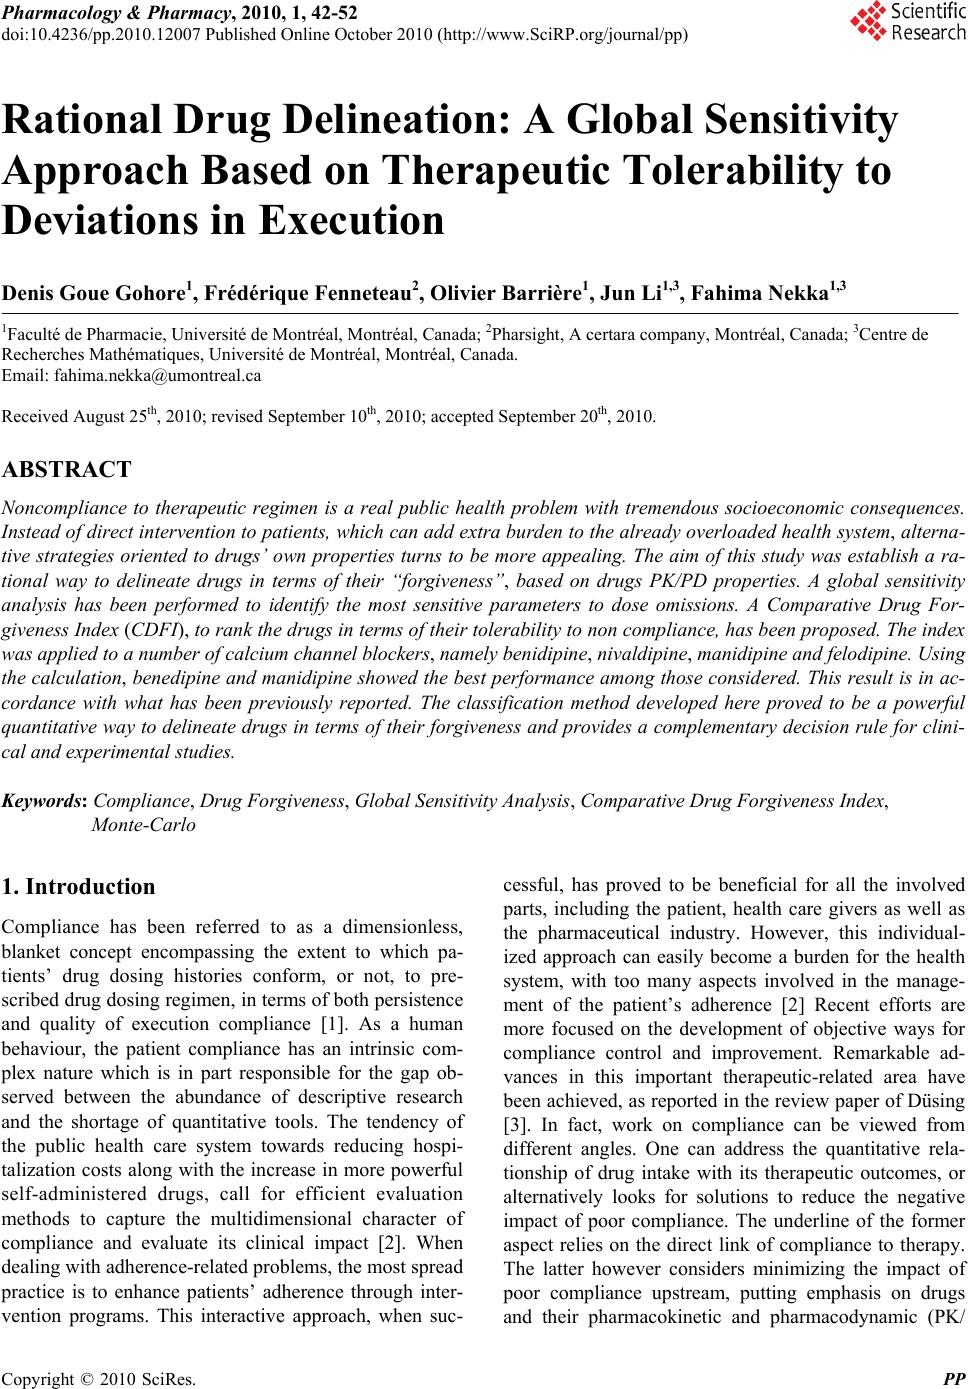 Pharmacology & Pharmacy, 2010, 1, 42-52 doi:10.4236/pp.2010.12007 Published Online October 2010 (http://www.SciRP.org/journal/pp) Copyright © 2010 SciRes. PP Rational Drug Delineation: A Global Sensitivity Approach Based on Therapeutic Tolerability to Deviations in Execution Denis Goue Gohore1, Frédérique Fenneteau2, Olivier Barrière1, Jun Li1,3, Fahima Nekka1,3 1Faculté de Pharmacie, Université de Montréal, Montréal, Canada; 2Pharsight, A certara company, Montréal, Canada; 3Centre de Recherches Mathématiques, Université de Montréal, Montréal, Canada. Email: fahima.nekka@umontreal.ca Received August 25th, 2010; revised September 10th, 2010; accepted September 20th, 2010. ABSTRACT Noncompliance to therapeutic regimen is a real public health problem with tremendous socioeconomic consequences. Instead of direct intervention to patients, which can add extra burden to the already overloaded health system, alterna- tive strategies oriented to drugs’ own properties turns to be more appealing. The aim of this study was establish a ra- tional way to delineate drugs in terms of their “forgiveness”, based on drugs PK/PD properties. A global sensitivity analysis has been performed to identify the most sensitive parameters to dose omissions. A Comparative Drug For- giveness Index (CDFI), to rank the drugs in terms of their tolerability to non compliance, has been proposed. The index was applied to a number of calcium channel blockers, namely benidipine, nivaldipine, manidipine and felodipine. Using the calculation, benedipine and manidipine showed the best performance among those considered. This result is in ac- cordance with what has been previously reported. The classification method developed here proved to be a powerful quantitative way to delineate drugs in terms of their forgiveness and provides a complementary decision rule for clini- cal and experimental studies. Keywords: Compliance, Drug Forgiveness, Global Sensitivity Analysis, Comparative Drug Forgiveness Index, Monte-Carlo 1. Introduction Compliance has been referred to as a dimensionless, blanket concept encompassing the extent to which pa- tients’ drug dosing histories conform, or not, to pre- scribed drug dosing regimen, in terms of both persistence and quality of execution compliance [1]. As a human behaviour, the patient compliance has an intrinsic com- plex nature which is in part responsible for the gap ob- served between the abundance of descriptive research and the shortage of quantitative tools. The tendency of the public health care system towards reducing hospi- talization costs along with the increase in more powerful self-administered drugs, call for efficient evaluation methods to capture the multidimensional character of compliance and evaluate its clinical impact [2]. When dealing with adherence-related problems, the most spread practice is to enhance patients’ adherence through inter- vention programs. This interactive approach, when suc- cessful, has proved to be beneficial for all the involved parts, including the patient, health care givers as well as the pharmaceutical industry. However, this individual- ized approach can easily become a burden for the health system, with too many aspects involved in the manage- ment of the patient’s adherence [2] Recent efforts are more focused on the development of objective ways for compliance control and improvement. Remarkable ad- vances in this important therapeutic-related area have been achieved, as reported in the review paper of Düsing [3]. In fact, work on compliance can be viewed from different angles. One can address the quantitative rela- tionship of drug intake with its therapeutic outcomes, or alternatively looks for solutions to reduce the negative impact of poor compliance. The underline of the former aspect relies on the direct link of compliance to therapy. The latter however considers minimizing the impact of poor compliance upstream, putting emphasis on drugs and their pharmacokinetic and pharmacodynamic (PK/ 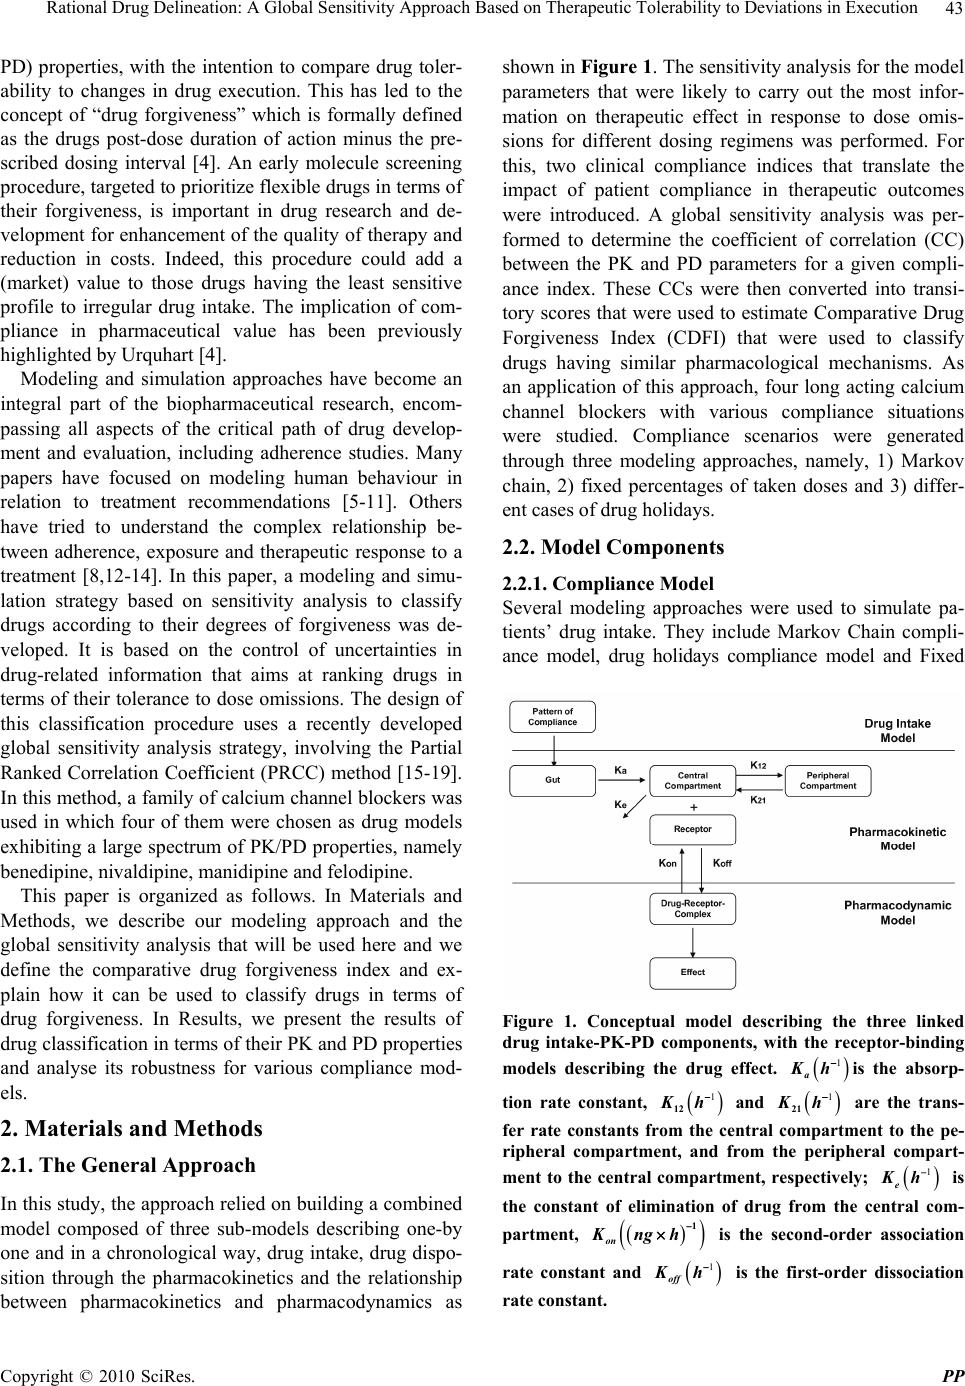 Rational Drug Delineation: A Global Sensitivity Approach Based on Therapeutic Tolerability to Deviations in Execution Copyright © 2010 SciRes. PP 43 PD) properties, with the intention to compare drug toler- ability to changes in drug execution. This has led to the concept of “drug forgiveness” which is formally defined as the drugs post-dose duration of action minus the pre- scribed dosing interval [4]. An early molecule screening procedure, targeted to prioritize flexible drugs in terms of their forgiveness, is important in drug research and de- velopment for enhancement of the quality of therapy and reduction in costs. Indeed, this procedure could add a (market) value to those drugs having the least sensitive profile to irregular drug intake. The implication of com- pliance in pharmaceutical value has been previously highlighted by Urquhart [4]. Modeling and simulation approaches have become an integral part of the biopharmaceutical research, encom- passing all aspects of the critical path of drug develop- ment and evaluation, including adherence studies. Many papers have focused on modeling human behaviour in relation to treatment recommendations [5-11]. Others have tried to understand the complex relationship be- tween adherence, exposure and therapeutic response to a treatment [8,12-14]. In this paper, a modeling and simu- lation strategy based on sensitivity analysis to classify drugs according to their degrees of forgiveness was de- veloped. It is based on the control of uncertainties in drug-related information that aims at ranking drugs in terms of their tolerance to dose omissions. The design of this classification procedure uses a recently developed global sensitivity analysis strategy, involving the Partial Ranked Correlation Coefficient (PRCC) method [15-19]. In this method, a family of calcium channel blockers was used in which four of them were chosen as drug models exhibiting a large spectrum of PK/PD properties, namely benedipine, nivaldipine, manidipine and felodipine. This paper is organized as follows. In Materials and Methods, we describe our modeling approach and the global sensitivity analysis that will be used here and we define the comparative drug forgiveness index and ex- plain how it can be used to classify drugs in terms of drug forgiveness. In Results, we present the results of drug classification in terms of their PK and PD properties and analyse its robustness for various compliance mod- els. 2. Materials and Methods 2.1. The General Approach In this study, the approach relied on building a combined model composed of three sub-models describing one-by one and in a chronological way, drug intake, drug dispo- sition through the pharmacokinetics and the relationship between pharmacokinetics and pharmacodynamics as shown in Figure 1. The sensitivity analysis for the model parameters that were likely to carry out the most infor- mation on therapeutic effect in response to dose omis- sions for different dosing regimens was performed. For this, two clinical compliance indices that translate the impact of patient compliance in therapeutic outcomes were introduced. A global sensitivity analysis was per- formed to determine the coefficient of correlation (CC) between the PK and PD parameters for a given compli- ance index. These CCs were then converted into transi- tory scores that were used to estimate Comparative Drug Forgiveness Index (CDFI) that were used to classify drugs having similar pharmacological mechanisms. As an application of this approach, four long acting calcium channel blockers with various compliance situations were studied. Compliance scenarios were generated through three modeling approaches, namely, 1) Markov chain, 2) fixed percentages of taken doses and 3) differ- ent cases of drug holidays. 2.2. Model Components 2.2.1. Compliance Model Several modeling approaches were used to simulate pa- tients’ drug intake. They include Markov Chain compli- ance model, drug holidays compliance model and Fixed Figure 1. Conceptual model describing the three linked drug intake-PK-PD components, with the receptor-binding models describing the drug effect. 1 a Kh is the absorp- tion rate constant, 1 12 Kh and 1 21 Kh are the trans- fer rate constants from the central compartment to the pe- ripheral compartment, and from the peripheral compart- ment to the central compartment, respectively; 1 e Kh is the constant of elimination of drug from the central com- partment, 1 on Kngh is the second-order association rate constant and 1 off Kh is the first-order dissociation rate constant. 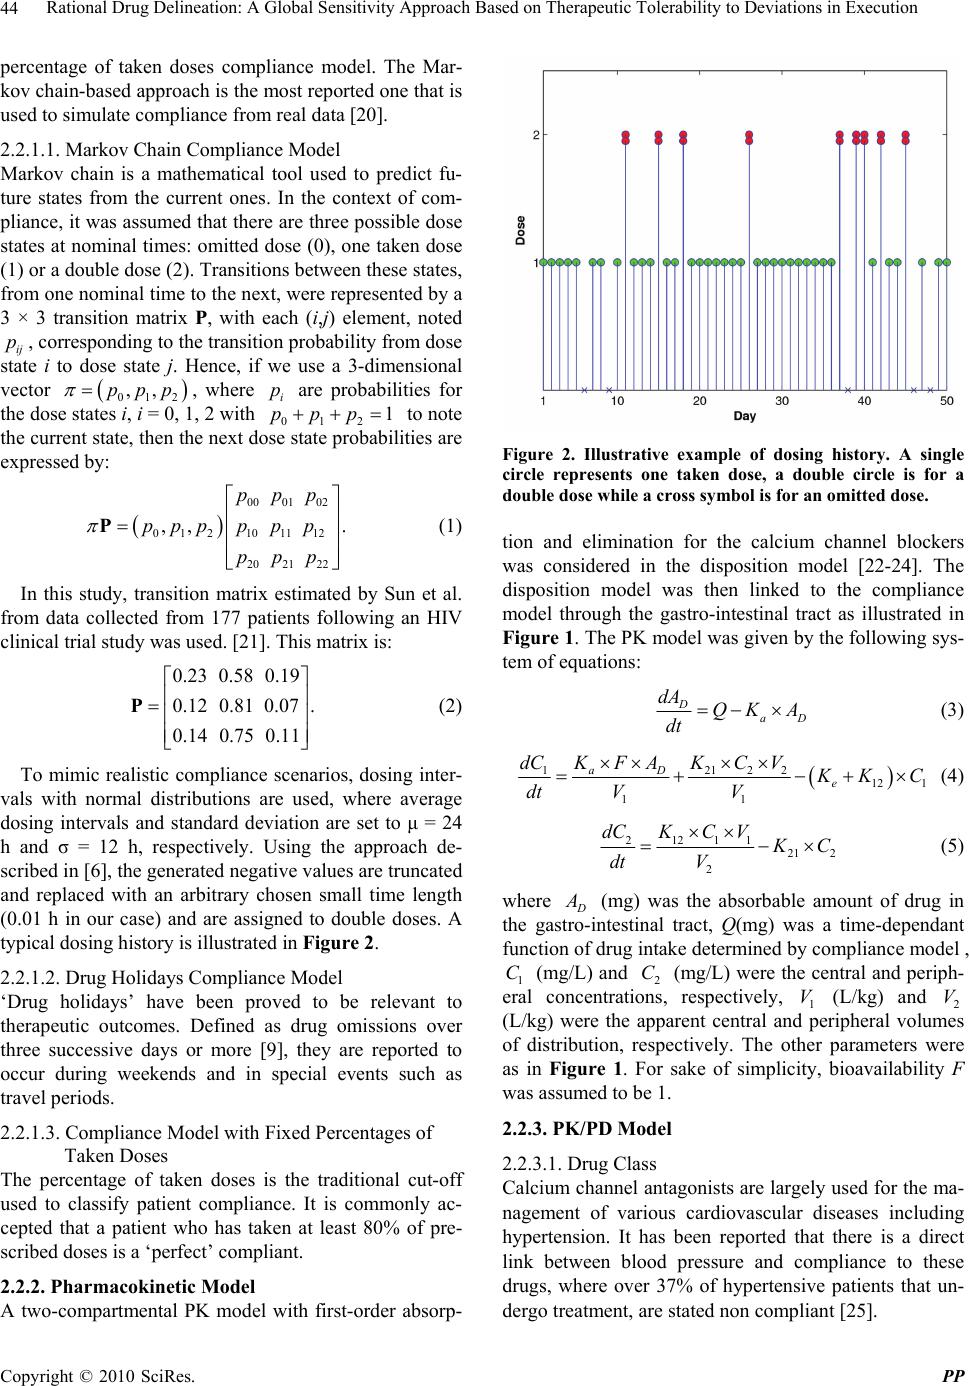 Rational Drug Delineation: A Global Sensitivity Approach Based on Therapeutic Tolerability to Deviations in Execution Copyright © 2010 SciRes. PP 44 percentage of taken doses compliance model. The Mar- kov chain-based approach is the most reported one that is used to simulate compliance from real data [20]. 2.2.1.1. Markov Chain Compliance Model Markov chain is a mathematical tool used to predict fu- ture states from the current ones. In the context of com- pliance, it was assumed that there are three possible dose states at nominal times: omitted dose (0), one taken dose (1) or a double dose (2). Transitions between these states, from one nominal time to the next, were represented by a 3 × 3 transition matrix P, with each (i,j) element, noted ij p, corresponding to the transition probability from dose state i to dose state j. Hence, if we use a 3-dimensional vector 012 ,,ppp , where i p are probabilities for the dose states i, i = 0, 1, 2 with 012 1ppp to note the current state, then the next dose state probabilities are expressed by: 0001 02 012 101112 2021 22 ,, . ppp ppppp p ppp P (1) In this study, transition matrix estimated by Sun et al. from data collected from 177 patients following an HIV clinical trial study was used. [21]. This matrix is: 0.23 0.58 0.19 0.12 0.81 0.07. 0.14 0.75 0.11 P (2) To mimic realistic compliance scenarios, dosing inter- vals with normal distributions are used, where average dosing intervals and standard deviation are set to μ = 24 h and σ = 12 h, respectively. Using the approach de- scribed in [6], the generated negative values are truncated and replaced with an arbitrary chosen small time length (0.01 h in our case) and are assigned to double doses. A typical dosing history is illustrated in Figure 2. 2.2.1.2. Drug Holidays Compliance Model ‘Drug holidays’ have been proved to be relevant to therapeutic outcomes. Defined as drug omissions over three successive days or more [9], they are reported to occur during weekends and in special events such as travel periods. 2.2.1.3. Compliance Model with Fixed Percentages of Taken Doses The percentage of taken doses is the traditional cut-off used to classify patient compliance. It is commonly ac- cepted that a patient who has taken at least 80% of pre- scribed doses is a ‘perfect’ compliant. 2.2.2. Pharmacokinetic Model A two-compartmental PK model with first-order absorp- Figure 2. Illustrative example of dosing history. A single circle represents one taken dose, a double circle is for a double dose while a cross symbol is for an omitted dose. tion and elimination for the calcium channel blockers was considered in the disposition model [22-24]. The disposition model was then linked to the compliance model through the gastro-intestinal tract as illustrated in Figure 1. The PK model was given by the following sys- tem of equations: D aD dA QK A dt (3) 12122 12 1 11 aD e KFA dCKC V K KC dt VV (4) 21211 21 2 2 dCKC V K C dt V (5) where D A (mg) was the absorbable amount of drug in the gastro-intestinal tract, Q(mg) was a time-dependant function of drug intake determined by compliance model , 1 C (mg/L) and 2 C (mg/L) were the central and periph- eral concentrations, respectively, 1 V (L/kg) and 2 V (L/kg) were the apparent central and peripheral volumes of distribution, respectively. The other parameters were as in Figure 1. For sake of simplicity, bioavailability F was assumed to be 1. 2.2.3. PK/PD Model 2.2.3.1. Drug Class Calcium channel antagonists are largely used for the ma- nagement of various cardiovascular diseases including hypertension. It has been reported that there is a direct link between blood pressure and compliance to these drugs, where over 37% of hypertensive patients that un- dergo treatment, are stated non compliant [25].  Rational Drug Delineation: A Global Sensitivity Approach Based on Therapeutic Tolerability to Deviations in Execution Copyright © 2010 SciRes. PP 45 2.2.3.2. Pharmacodynamic Model The calcium channel blockers bind to calcium channels to limit the entry of calcium into the vascular and cardiac smooth muscles thus preventing muscle contractility. The intensity and duration of their action depend on their ability to dissociate at the target site. The indirect PK/PD model to characterize the effect of these drugs was used [22]. The effect E(mHg) can be modeled as: maxon off dE K EEKE dt (6) where max EmHg , Kon and Koff are the maximum effect, the association and dissociation rate constants, respectively. 2.3. Sensitivity Analysis of PK/PD Parameters A global sensitivity analysis (GSA) of the combined mo- del was applied to identify input parameters suspected to have determinant role on compliance indices under in- vestigation. GSA is a probabilistic approach used to de- termine the sensitivity of the model outcomes to the variation of input parameters [26]. Using this approach, possible input parameter values were simulated and sta- tistically analysed according to their distribution func- tions and possible correlations. GSA has recently been introduced to analyse the physiological based pharma- cokinetic models [15,16]. The following terms were used in this work: the ‘input parameter , i X refers to one of the involved pharma- cokinetic and pharmacodynamic parameters, and the ‘output variable , j Y to the model response. 2.4. Input Parameters Nine parameters were investigated using GSA, namely: a K , e K 12 K , 21 K , 1 V, 2 V, on K , of f K and max E. Based on the statistical description of input parameters for calcium channel inhibitors given in Table 1 [22,27,28] Monte Carlo approach was used to generate a large number (N = 1000) of drugs, each having a specific vec- tor composed of m = 9 input parameters (i.e., a matrix of m × 1000). These input parameters were used to generate the corresponding output parameters. 2.5. Output Parameters Two important compliance indices relevant to anti-hyper- tensive therapy were chosen: 2.5.1. Number of Subtherapeutic Days (SD) A patient was considered to have subtherapeutic plasma drug concentrations if the systolic blood pressure devi- ated by ΔE = 20% from the expected value if the patient was a perfect compliant. Using this well accepted clinical criterion [32], the number of SD following the calcula- Table 1. Statistical description of input parameters assumed to be log-normally distributed. Parameters Mean Std IC 1 a K h 0.80 0.37 0.30-3.20 1 e K h 0.36 0.13 0.10-1.20 1 12 K h 0.14 0.12 0.02-1.00 1 21 K h 0.10 0.10 0.008-0.82 1 VL 992.20 550.90 359.10-2,739 2 VL 5,758 3,770 2,788-18,563 max EmHg 27.00 8.25 15.00-48.00 1 . on K ng h0.70 0.90 0.05-3.00 1 off K h 0.36 0.50 0.01-5.00 tion of ΔE for different compliance scenarios and input parameters was estimated. A higher SD indicates that the treatment success can be jeopardized. 2.5.2. Smoothness Index (SI) SI is used to assess the fluctuation in blood pressure driven by the drug or treatment regimen. Clinically, this index indicates the homogeneity of blood pressure reduc- tion induced by antihypertensive drug treatment over the 24 hours. A large variation in blood pressure (low SI) is likely to trigger organ damage, in comparison to a higher SI that indicates a smooth blood pressure [29-34]. Hence, an SI decrease can raise therapeutic concerns. The smoothness index was obtained as: D H D H m SI (7) where D H m and D H are the mean and standard de- viation of systolic blood pressure calculated for a same individual, respectively. 2.6. Input-Output Correlation In order to identify the important parameters and quan- tify their influence on model outcomes, the correlation (CC), rank correlation (RCC), partial correlation (PCC) or partial rank correlation (PRCC) coefficients were cal- culated according to the linearity or monotonicity prop- erties of the input-output relationship, as well as to the correlation between input parameters [16]. In this study, nonlinear but monotonous relationships were observed between some input and output parameters, justifying thus the use of RCC. To take into account the possible correlation between input parameters, the partial rank coefficients of correlation (PRCC) between an input pa-  Rational Drug Delineation: A Global Sensitivity Approach Based on Therapeutic Tolerability to Deviations in Execution Copyright © 2010 SciRes. PP 46 rameter i X and an output parameter Y was calculated as follows: 1 11 ,iY i ii YY C PRCC YX CC (8) where 1 C is the inverse matrix of C: 121 1 212 2 12 12 1 1 1 1 1 NY NY T NN NY YY YN rrr rrr A B CB rr r rr r (9) where A was the input parameters correlation matrix with elements ij rRCC and B was the input-output correlation vector with elements j Y r. A positive PRCC value indicates that the output parameter increases with the input parameter, and vice versa. To understand the relative determinant roles of input parameters on the effect of dose omission, the score (i SC ) was defined from the input-output PRCC value as fol- lows: 1 , , i im i i PRCC YX SC PRCC YX (10) where i = 1,2,...m. Once the estimated PRCC values and scores were ob- tained using N=1000 simulated drugs, the results were used for the classification of n chosen drugs in terms of their forgiveness. The classification process can be direct if a single parameter emerges as the most sensitive one. However, it is possible that more than one parameter were identified as important, for which case a more deli- cate criterion, based on the scores, to delineate drugs forgiveness was developed. 2.7. Drug Forgiveness Estimation: Comparative Drug Forgiveness Index (CDFI) The defined scores to compare n drugs in terms of their forgiveness were illustrated. For this, the concept of Comparative Drug Forgiveness Index (CDFI) was intro- duced and calculated for the n considered drugs from the class of calcium channel blockers. For each drug, CDFI was directly computed from its PK and PD parameters and the predetermined scores of the corresponding pharmacological class. This made CDFI an accessible method easily applicable in practice for drug forgiveness classification. 2.8. Calculation of CDFI Assume m PK/PD parameters were used for each of the n considered drugs; each parameter was represented by a vector 12 ,, iii in X XXX, i = 1, 2, …, m, with each component corresponding to the i-th PK/PD parameter of one drug. Y was the n-ry vector of the corresponding compliance index, namely SD and SI. i SC is the score of i X defined by Equation 10. Depending on ,i PRCC Y X values and considering that an increase of a given compliance index positively or negatively influences the therapeutic outcome, the for- giveness index ij F was defined to measure the relative performance of the i-th parameter ij X of the j-th drug in terms of drug forgiveness. To calculate ij F , the drug index 0 j for which 0 ij X indicates, in terms of drug forgiveness, the worst per- formance among ij X , j = 1, 2, …, n was first determined. The different cases are summarized as follows: 1) An increase in compliance index negatively influ- ences the therapeutic outcome (e.g., an increase in SD negatively influences blood pressure control) a) If ,0 i PRCC YX, 0 j ij jargmaxX and we let 0 ij i F SC b) If ,0 i PRCC Y X, 0 j ij jargminX and we let 0 ij i F SC 2) An increase in compliance index positively influences the therapeutic outcome (e.g., an increase in SI positively influences blood pressure homogeneity) a) If ,0 i PRCC YX, 0 j ij jargminX and we let 0 ij i F SC b) If ,0 i PRCC Y X, 0 j ij jargmaxX and we let 0 ij i F SC Hence the forgiveness index ij F for the i-th parame- ter of the j-th drug was defined as follows: 0 0 0 0 0 if if ij ij ij ij ij F jj XF Fjj X (11) Table 2 illustrates a simplified diagram for the com- putation of the forgiveness index. Table 2. A simplified diagram of the forgivness index calculation indicates an increase (decrease). Terapeutic OutcomeY Terapeutic OutcomeY (,) 0 i PRCC YX /min ijijij ij F XSC X /max ijijij ij F XSC X (,) 0 i PRCC YX /max ijijij ij F XSC X /min ijijij ij F XSC X  Rational Drug Delineation: A Global Sensitivity Approach Based on Therapeutic Tolerability to Deviations in Execution Copyright © 2010 SciRes. PP 47 3) For the j-th drug, j = 1, 2, …, n, the Comparative Drug Forgiveness Index (CDFI) was defined by summing its individual forgiveness indices ij F : 1 m ij i CDFI jF (12) 4) Finally, a ranking of drugs was based one their CDFI values, where a higher CDFI indicates a better drug forgiveness. 2.9. Application of CDFI To evaluate the relevance and robustness of the approach defined here for the evaluation of drugs in terms of their forgiveness, CDFI for four long-action calcium channel blockers, namely benidipine, nivaldipine, manidipine and felodipine were calculated. Concentration and blood pre- ssure data used in the study were obtained from lit- erature [22,27,28] and were used for each of these drugs. The two compartment model generally adopted for these drugs in literature was used to estime the relevant PK and PD parameters using WinNonlin software package (Pharsight Corporation, Mountain View, CA, USA). The estimated values of PK and PD parameters were sum- marized in Table 3. As observed in Table 3, large differences in PK and PD properties exist between the four calcium channel inhibitors investigated, assuring thus the robustness of the approach. Upon these disposition and effect models, the previously mentioned three compliance models were applied to these drugs to generate data for the assessment of their forgiveness. 3. Results 3.1. Exploratory Analysis of Input-Output Relationships To check for the monotonicity in the input-output rela- tionships, scatter plots representing the input parameters vs the model output SI were displayed in Figure 3. For each of the m = 9 input parameters N = 1000 copies were simulated. Linear trends as well as nonlinear ones were displayed by these pairs. The monotonicity exhibited by these lin- ear and nonlinear relationships justified our use of the rank coefficient of correlation (RCC) approach or the partial rank coefficient of correlation (PRCC). The latter was identified as the most appropriate and powerful method when parameters were correlated. In Figures 4 and 5, results of the RCC and PRCC of each input pa- rameters with outcome parameters, SD and SI, when neglecting or not the correlations between various input parameters, respectively, are shown. Difference parame- Table 3. PK and PD parameters of the four long-action calcium channel inhibitors; Data from Shimada and al., Kirsten and al. [22,27,28]. ParametersBenedipineNivaldipine Manidipine Felodipine PK 1 a K h 1.33 0.67 0.63 0.51 1 e K h 0.50 0.42 0.32 0.20 1 12 K h1.07 0.11 0.20 0.27 1 21 K h0.73 0.01 0.16 0.013 1 VL 1323.20 562.23 1449.90 465.20 2 VL 3045.70 6044.50 1833.10 9402.40 PD max E mHg23.40 36.92 17.63 29.62 1 . on K ng h1.26 0.143 0.32 0.54 1 off K h0.012 0.37 0.13 0.21 Figure 3. Correlation between PK and PD input parameters and SI. ters rankings were obtained using these two approaches. For example, RCC identified e K , 12 K , off K as the most important parameters for SD, whereas off K , on K and 21 K were those identified by PRCC. The result rationalizes the choice for the PRCC approach in this study. The PRCC values in Figure 4 indicate that both output parameters, SD and SI, were sensitive to off K , and at a less extent to on K and 21 K . The latter parameter be- longs to the PK model while the two others to the PD model. While the ranking of these three parameters was preserved, the sign of correlation was reversed as ex-  Rational Drug Delineation: A Global Sensitivity Approach Based on Therapeutic Tolerability to Deviations in Execution Copyright © 2010 SciRes. PP 48 Figure 4. Coefficients of correlation between input and out- put parameters when possible input correlations are ac- counted for. Figure 5. Coefficients of correlation between input and out- put parameters when input correlations are ignored. pected as a consequence of the SD and SI definitions. From a clinical point of view, given two or more calcium channel blockers, this implied that drugs with smaller off K , 21 K , and larger on K were preferred in terms of drug forgiveness. However, these conditions could be rarely satisfied for one drug at the same time, which led us to the development of a criterion for more general cases. 3.2. Choice of the Most Forgiving Drug Based on the Sensitivity of PK or PD Parameters Three input parameters were identified as the most im- portant ones, on K and off K were PD related while 21 K was PK related. In terms of dose omission, ni- valdipine was classified as the most forgiving drug if the delineation procedure is solely PK-based, while benedi- pine was the least forgiving one, as shown in Table 3. The conclusion may be reversed if the procedure was PD-based. Thus, a sensitivity analysis solely based on the PK properties while ignoring the PD component (and vice versa) could lead to erroneous classification of drugs. This result confirms the need to take into account as much PK/PD properties as possible for a proper charac- terization of drug tolerability to dose omissions. 3.3. Use of CDFI to Test Tolerability to Dose Omissions The CDFI approach was applied in this study to classify the four calcium channel blockers in terms of their for- giveness to dose omissions. The PK/PD parameters of these four drugs (Table 1) were in the range of the Monte Carlo generated PK/PD parameters (Table 1), validating thus the use of PRCC method and consequently CDFI. Since a sensitivity analysis was based only on PK or PD parameters, it cannot fulfill the task of classification, and therefore the CDFI approach was performed on these drugs as shown in Table 4. For both output parameters, benidipine showed the highest CDFI, which means it holds for the longest effec- tive therapeutic period and causes the least inhomogene- ity in blood pressure. It was followed by manidipine for SD and by felodipine for SI. 3.4. CDFI Classification versus Direct Classification Compared to direct classification approaches based on therapeutic markers, which require specific simulations for each drug, the advantage of CDFI was obvious. Moreover, CDFI was computed with the same compli- ance scenario to classify a whole pharmacological class, having a wide range of PK and PD properties. However, it was important to ensure the robustness of CDFI classi- fication by considering different compliance patterns using direct classification approaches. In this study, two therapeutic markers, namely SD or SI, can be used to study the performance of CDFI for the four chosen blockers by considering the three compliance scenarios above. 3.5. Compliance Scenario Using Markov Chain Model In this study, 500 drug intake profiles were simulated for each drug using Markov chain approach to analyse the impact of drug intake irregularity on the therapeutic out- come. Table 5 shows the values of several therapeutic markers that we calculated or extracted from the literature.  Rational Drug Delineation: A Global Sensitivity Approach Based on Therapeutic Tolerability to Deviations in Execution Copyright © 2010 SciRes. PP 49 Table 4. Comparative drug forgiveness index for four long- action calcium channel drugs. Benedipine Nivaldipine Manidipine Felodipine CDFI(SD) −10 −47 −27 −58 CDFI(SI) 51 −3.8 10 16 Table 5. Values of compliance markers obtained after simu- lation and experimental data. Therapeutic marker Benedipine Nivaldipine Manidipine Felodipine SD (h) 1.3 70.6 17.5 80.45 SI 8 0.13 0.59 1.13 Experimen- tal SI 2a - 0.6b 1 c aData from Nakajima and al. [32]; bData from Roca-Cusachs and al. [34]; cData from Mancia and al. [31] In terms of SD, benedipine, with the least therapeutic time of 1.3 h, had the best forgiveness. Manidipine was ranked second with SD = 17.5 h, while felodipine had the worst forgiveness with an SD of 80.45 h. When it comes to SI, benidipine and felodipine with SI value of 8 and 1.3 respectively, manifest their fine quality in the control of harmful fluctuations in blood pressure compared to the other two drugs. These results were consistent with those found using CDFI (Table 4). Moreover, simulated SI was in accordance with experimental SI reported in lit- erature from real data, which was a strong indication of the suitability of this study. 3.6. Noncompliance Based on Drug Holidays Different scenarios based on the number of drug holidays, going from 1 to 15 times, each lasting exactly three days were explored. In this method, the perfect compliance was simulated into which a number of occasional drug holidays were used. Figure 6 shows the relationship be- tween SD, i.e., number of subtherapeutic days, and num- ber of drug holidays for different fixed systolic blood pressure deviations ΔE. With nivaldipine, the percentage of subtherapeutic days exceeds 10% after five drug holi- days for ΔE = 0.2. However, when ΔE = 0.1, only benedipine showed an SD under 10%. It was noted that benedipine showed a better tolerance for drug holidays compared to the other drugs. In Figure 7, the evolution of SI for each drug versus the number of drug holidays was shown. Benedipine had the largest SI decreasing ratio compared to other drugs. However, SI for nivaldipine and felodipine were almost not altered by drug holidays. This indicates that drug Figure 6. Number of days that a patient is inefficiently treated vs. number of drug holidays. ∗ = Benedipine; ⋄ = Manidipine; × = Felodipine and ○ = Nivaldipine. Figure 7. Profile of smoothness index vs. number of drug holidays. ∗ = Benedipine; ⋄ = Manidipine; × = Felodipine and ○ = Nivaldipine. omission had almost no influence on blood pressure fluctuation. Therefore, the difference between perfect and poor compliers in terms of organ damage induced by drug holidays can be neglected during hypertension treatment. These results were consistent with the CDFI classification (Table 4). 3.7. Noncompliance Based on Percentage of Taken Doses For a fixed total dose, scenarios were simulated with an increasing percentage of taken doses, ranging from 10% to 100%. For each percentage of taken doses, percentage of subtherapeutic days (SD) was calculated; the results are shown in Figure 8. Similar to the compliance model  Rational Drug Delineation: A Global Sensitivity Approach Based on Therapeutic Tolerability to Deviations in Execution Copyright © 2010 SciRes. PP 50 based on drug holidays, benedipine had a better forgive- ness for dose omission, followed by manidipine. The other two drugs showed very poor forgiveness. However, in terms of SI, benedipine changed more rapidly against percentage of taken doses than other drugs (Figure 9), which suggests a high risk of organ damages for non compliant patients during hypertension treatment. The above results were again consistent with the CDFI classification (Table 4). 4. Discussion Many therapeutic strategies consider the issue of drug compliance as crucial for a treatment to be efficient. In Figure 8. Number of days, the patient is inefficiently treated vs. percentage of taken doses. ∗ = Benedipine; ⋄ = Manidi- pine; × = Felodipine and ○ = Nivaldipine. Figure 9. Profile of smoothness vs. percentage of dose taken. ∗ = Benedipine; ⋄ = Manidipine; × = Felodipine and ○ = Nivaldipine. this context, two options can be put forward under dif- ferent philosophies, one is centered around the patient while the other targets the patient drug use. The first builds on the interactive synergy between the health caregiver and the patient, with the ultimate goal of the patient to be an integral part of drug execution. Since this approach heavily depends on the patient willingness and collaboration, it can be time consuming and provides no guarantee of improvement in patient drug intake. This has led to consider alternative drug-based strategies, with attempt to favor drugs that are more tolerable to the ir- regular drug intake, thus reducing the risk for therapeutic failure. This is particularly relevant for specific popula- tions where compliance to medication has proved to be poor. The drug forgiveness issue has been raised by Urquhart [35], and suggested as an additive criterion in the drug evaluation. In the drug selection process, the characterization of PK/PD properties is crucial. Restric- ted by clinical and ethical conditions, a M&S approach can play a major role for this purpose. A step towards this di- rection has been made by Nony and coworkers [36]. In this study, a global sensitivity analysis (GSA) ap- proach was adopted, that considers a whole package of PK/PD parameters and quantifies their roles on therapeu- tic outcomes in terms of compliance. For this, a previ- ously developed GSA method was used and aimed at identifying important input parameters and quantify their influence on drug distribution in different tissues [15]. GSA incorporates the correlations between input pa- rameters in the quantification of their influence on the model outcomes. This approach for a PK and PD model was related to a compliance model. As a case-study, four calcium channel blockers with different PK/PD parameters have been tested. Using those PK and PD parameters identified as important by GSA, the drug classification in terms of forgiveness can be different whether the PK and/or PD models have been included or not. This indicates that considering the PK/PD parameters as independent vari- ables can lead to erroneous conclusions. For instance, for drugs acting through direct effect model, the one having a very long elimination half-life is considered more for- giving. However, for drugs acting through indirect model, the one with the longest elimination half-life cannot be automatically judged as the most forgiving since the dis- sociation rate constant may also have an influence on the length of drug effect. For the calcium channel blockers considered in this paper, the GSA approach reveals that the high degree of benedipine forgiveness is in part related to PD properties (off K and on K ), while it can be more linked to PK properties (21 K ) for the case of felodipine.  Rational Drug Delineation: A Global Sensitivity Approach Based on Therapeutic Tolerability to Deviations in Execution Copyright © 2010 SciRes. PP 51 For the same pharmacology class drugs, it is difficult to classify drugs in terms of their forgiveness when sev- eral parameters simultaneously influence the drug re- sponse expressed through compliance indices. Our study raises the issue of the validation of those studies involv- ing the sole knowledge of PK or PD components without consideration of the whole drug intake-PK/PD process. In this work, the GSA-based CDFI approach, which takes into account the unavoidable and complex rela- tionship between these three components, can be used as a reasonable tool for the classification of drugs in terms of their forgiveness. The results obtained in this study are reassuring and support the relevance of CDFI approach. Indeed, the drug forgiveness classification is consistent with the clinical results, which confirm the efficacy and long- action effect of the benedipine and manidipine compared to other calcium channel antagonists [37,23,34]. More- over, simulated SI are also close to clinical data (see Ta- ble 5), indicating that benedipine induces high homoge- neity of blood pressure, followed by felodipine and mani- dipine [30-34]. This work, which uses for the first time the global sen- sitivity analysis to compare drugs in terms of their for- giveness is a step forward towards a strategy that favor drugs that are more tolerable to deviations in drug execu- tions. 5. Conclusions In this work, a global sensitivity analysis has been per- formed to identify the most sensitive parameters to dose omissions. A Comparative Drug Forgiveness Index (CDFI), designed to rank drugs in terms of their toler- ability to non compliance, has been proposed. The classi- fication results are in accordance with what has been previously reported for the calcium channel blockers. The classification method developed here proved to be a powerful quantitative way to delineate drugs in terms of their forgiveness and provides a complementary decision rule for clinical and experimental studies. 6. Acknowledgements This work has been supported by the NSERC and FQRNT grants held by Dr. Fahima Nekka. The Mathematical Centre of Excellence (MITACS) and Ivory Coast Repub- lic are also acknowledged for their support. REFERENCES [1] B. Vrijens, G. Vincze, P. Kristanto, J. Urquhart and M. Burnier, “Adherence to Prescribed Antihypertensive Drug Treatments: Longitudinal Study of Electronically Com- piled Dosing Histories,” British Medical Journal, Vol. 336, No. 7653, 2008, pp. 1114-1117. [2] J. Urquhart, “Patient Non-Compliance with Drug Regi- mens: Measurement, Clinical Correlates, Economic Im- pact,” Eur Heart J., Vol. 17, No. (Suppl. A), 1996, pp. 8-15. [3] R. Düsing, “Adverse Events, Compliance, and Changes in Therapy,” Current Hypertension Reports, Vol. 3, No. 6, 2001, pp. 488-492. [4] J. Urquhart, “Pharmacodynamics of Variable Patient Compliance: Implications for Pharmaceutical Value,” Advanced Drug Delivery Reviews, Vol. 33, No. 3, 1998, pp. 207-219. [5] P. Girard, L. B. Sheiner, H. Kastrissios and T. F. Blaschke, “Do we Need Full Compliance Data for Popu- lation Pharmacokinetic Analysis?” J Pharmacokinetics and Biopharmaceutics, Vol. 24, No. 3, 1996, pp. 265-282. [6] A. Blesius, S. Chabaud, M. Cucherat, P. Mismetti, J. P. Boissel and P. Nony, “Compliance-Guided Therapy: A New Insight into the Potential Role of Clinical Pharma- cologists,” Clinical Pharmacokinetics, Vol. 45, No. 1, 2006, pp. 95-104. [7] J. Li and F. Nekka, “A Probabilistic Approach for the Evaluation of Pharmacological Effect Induced by Patient Irregular Drug Intake,” Journal of Pharmacokinetics and Pharmacodynamics, Vol. 36, No. 3, 2009, pp. 221-238. [8] G. D. Gohore Bi, J. Li and F. Nekka, “Antimicrobial Breakpoint Estimation Accounting for Variability in Pharmacokinetics,” Theoretical Medicine and Biology, Vol. 26, No. 6, 2009, p. 10. [9] B. Vrijens, E. Goetghebeur, E. de Klerk, R. Rode, S. Mayer and J. Urquhart, “Modelling the Association be- tween Adherence and Viral Load in HIV-Infected Pa- tients,” Statistics in Medicine, Vol. 24, No. 17, 2005, pp. 2719-2131. [10] Y. Huang, S. L. Rosenkranz and H. Wu, “Modeling HIV Dynamics and Antiviral Response with Consideration of Time-Varying Drug Exposures, Adherence and Pheno- typic Sensitivity,” Mathematical Biosciences, Vol. 184, No. 2, 2003, pp. 165-186. [11] E. Hénin, B. You, B. Tranchand, G. Freyer and P. Girard, “Issues of the Study of Patient Compliance to Treatment with Oral Anticancer Chemotherapy: Advantages of Phar- macokinetics-Pharmacodynamics Modelisation,” Therapie, Vol. 62, No. 2, 2007, pp. 77-85. [12] J. Li and F. Nekka, “A Pharmacokinetic Formalism Ex- plicitly Integrating the Patient Drug Compliance,” Jour- nal of Pharmacokinetics and Pharmacodynamics, Vol. 34, No. 1, 2007, pp. 115-139. [13] J. Li, C. E. Petit-Jetté, D. Gohore Bi, F. Fenneteau, R. J. Del Castillo and F. Nekka, “Assessing Pharmacokinetic Variability Directly Induced by Drug Intake Behaviour through Development of a Feeding Behaviour-Pharma- cokinetic Model,” Journal of Theoretical Biology, Vol. 251, No. 3, 2008, pp. 468-479. [14] P. Nony and J. P. Boissel, “Use of Sensitivity Functions to Characterise and Compare the Forgiveness of Drugs,”  Rational Drug Delineation: A Global Sensitivity Approach Based on Therapeutic Tolerability to Deviations in Execution Copyright © 2010 SciRes. PP 52 Clinical Pharmacokinetics, Vol. 41, No. 5, 2002, pp. 371- 380. [15] F. Fenneteau, J. Li and F. Nekka, “Assessing Drug Dis- tribution in Tissues Expressing P-Glycoprotein Using Physiologically Based Pharmacokinetic Modeling: Iden- tification of Important Model Parameters through Global Sensitivity Analysis,” Journal of Pharmacokinetics and Pharmacodynamics, Vol. 36, No. 6, 2009, pp. 495-522. [16] F. Fenneteau, P. Poulin and F. Nekka, “Physiologically Based Predictions of the Impact of Inhibition of Intestinal and Hepatic Metabolism on Human Pharmacokinetics of CYP3A Substrates,” Journal of Pharmaceutical Sciences, Vol. 99, No. 1, 2010, pp. 486-514. [17] A. Saltelli, S. Tarantola, F. Campolongo and M. Ratto, “Sensitivity Analysis in Practice: A Guide to Assessing Scientific Model,” Wiley, New York, 2004. [18] A. Saltelli, M. Ratto, S. Tarantola and F. Campolongo, “Sensitivity Analysis for Chemical Models,” Chemical Reviews, Vol. 105, No. 7, 2005, pp. 2811-2828. [19] J. Zàdor, I. G. Zsély, T. Turanyi, M. Ratto, S. Tarantola and A. Saltelli, “Local and Global Uncertainty Analyses of a Methane Flame Model,” Journal of Physical Chem- istry A, Vol. 109, No. 43, 2005, pp. 9795-9807. [20] P. Girard, T. F. Blaschke, H. Kastrissios, L. B. Sheiner, “A Markov Mixed Effect Regression Model for Drug Compliance,” Statistics in Medicine, Vol. 17, No. 20, 1998, pp. 2313-2333. [21] J. Sun, H. N. Nagaraj, N. R. Reynolds, “Discrete Stochas- tic Models for Compliance Analysis Based on an AIDS Clinical Trial Group (ACTG) Study,” Biomedicine Jour- nal, 2007, Vol. 49, No. 5, pp. 731-741. [22] S. Shimada, Y. Nakajima, K. Yamamoto, Y. Sawada and T. Iga, “Comparative Pharmacodynamics of Eight Cal- cium Channel Blocking Agents in Japanese Essential Hypertensive Patients,” Biological and Pharmaceutical Bulletin, Vol. 19, No. 3, 1996, pp. 430-437. [23] K. Yao, K. Nagashima and H. Miki, “Pharmacological, Pharmacokinetic, and Clinical Properties of Benidipine Hydrochloride, a Novel, Long-Acting Calcium Channel Blocker,” Journal of Pharmacological Sciences, Vol. 100, No. 4, 2006, pp. 243-261. [24] H. Y. Yun, M. H. Yun, W. Kang and K. I. Kwon, “Phar- macokinetics and Pharmacodynamics of Benidipine Us- ing a Slow Receptor-Binding Model,” Journal of Clinical Pharmacy and Therapeutics, Vol. 30, No. 6, 2005, pp. 541-547. [25] R. B. Haynes, D. L. Sackett, E. Gibson, H. Wand, R. S. Roberts, et al., “Improvement of Medication Compliance in Uncontrolled Hypertension,” Lancet, Vol. 1, No. 7972, 1976, pp. 1265-1268. [26] A. Saltelli, M. Ratto, T. Andres, F. Campolongo, J. Cari- boni, D. Gatelli, et al., “Global Sensitivity Analysis: The Primer,” Wiley, Chichester, 2008. [27] Y. Nakajima, K. Yamamoto, S. Shimada, H. Kotaki, Y. Sawada and T. Iga, “In Vitro-in Vivo Correlation of Pharmacodynamics of Felodipine in Essential Hyperten- sive Patients Based on an Ion-Channel Binding Model,” Biological and Pharmaceutical Bulletin, Vol. 19, No. 8, 1996, pp. 1097-1099. [28] R. Kirsten, K. Nelson, D. Kirsten and B. Heintz, “Clinical Pharmacokinetics of Vasodilators,” Part I. Clinical pharmacokinetics, Vol. 34, No. 6, 1998, pp. 457-482. [29] O. Nakajima, H. Akioka and M. Miyazaki, “Effect of the Calcium Antagonist Benidipine Hydrochloride on 24-h Ambulatory Blood Pressure in Patients with Mild to Moderate Hypertension in a Double-Blind Study against Placebo,” Arzneimittelforschung, Vol. 50, No. 7, 2000, pp. 620-625. [30] G. Mancia, S. Omboni, E. Agabiti-Rosei, R. Casati, R. Fogari, G. Leonetti, et al., “Antihypertensive Efficacy of Manidipine and Enalapril in Hypertensive Diabetic Pa- tients,” Journal of Cardiovascular Pharmacology, Vol. 35, No. 6, 2000, pp. 926-931. [31] S. R. O. Antonicelli, D. C. Giovanni, R. Ansuini, A. Mori, R. Gesuita, G. Parati, et al., “Smooth Blood Pressure Control Obtained with Extended-Release Felodipine in Elderly Patients with Hypertension: Evaluation by 24-Hour Ambulatory Blood Pressure Monitoring,” Drugs Aging, Vol. 19, No. 7, 2002, pp. 541-551. [32] G. Mancia, S. Omboni, G. Parati, D. L. Clement, W. E. Haley, S. N. Rahman, et al., “Twenty-Four Hour Ambu- latory Blood Pressure in the Hypertension Optimal Treatment (HOT) Study,” Journal of Hypertension, Vol. 19, No. 10, 2001, pp. 1755-1763. [33] S. Omboni, R. Fogari and G. Mancia, “A Smooth Blood Pressure Control is Obtained over 24 h by Delapril in Mild to Moderate Essential Hypertensives,” Blood Press, Vol. 10, No. 3, 2001, pp. 170-175. [34] A. Roca-Cusachs and F. Triposkiadis, “Antihypertensive Effect of Manidipine,” Drugs, Vol. 65, No. (Suppl. 2), 2005, pp. 11-19. [35] J. Urquhart, “Erratic Patient Compliance with Prescribed Drug Regimens: Target for Drug Delivery Systems,” Clinical Pharmacology & Therapeutics, Vol. 67, No. 4, 2000, pp. 331-334. [36] J. P. Boissel and P. Nony, “Using Pharmacoki- netic-Pharmacodynamic Relationships to Predict the Ef- fect of Poor Compliance,” Clinical Pharmacokinetics, Vol. 41, No. 1, 2002, pp. 1-6. [37] S. M. Cheer and K. McClellan, “Manidipine: A Review of its Use in Hypertension,” Drugs, Vol. 61, No. 12, 2001, pp. 1777-1799. |