Paper Menu >>
Journal Menu >>
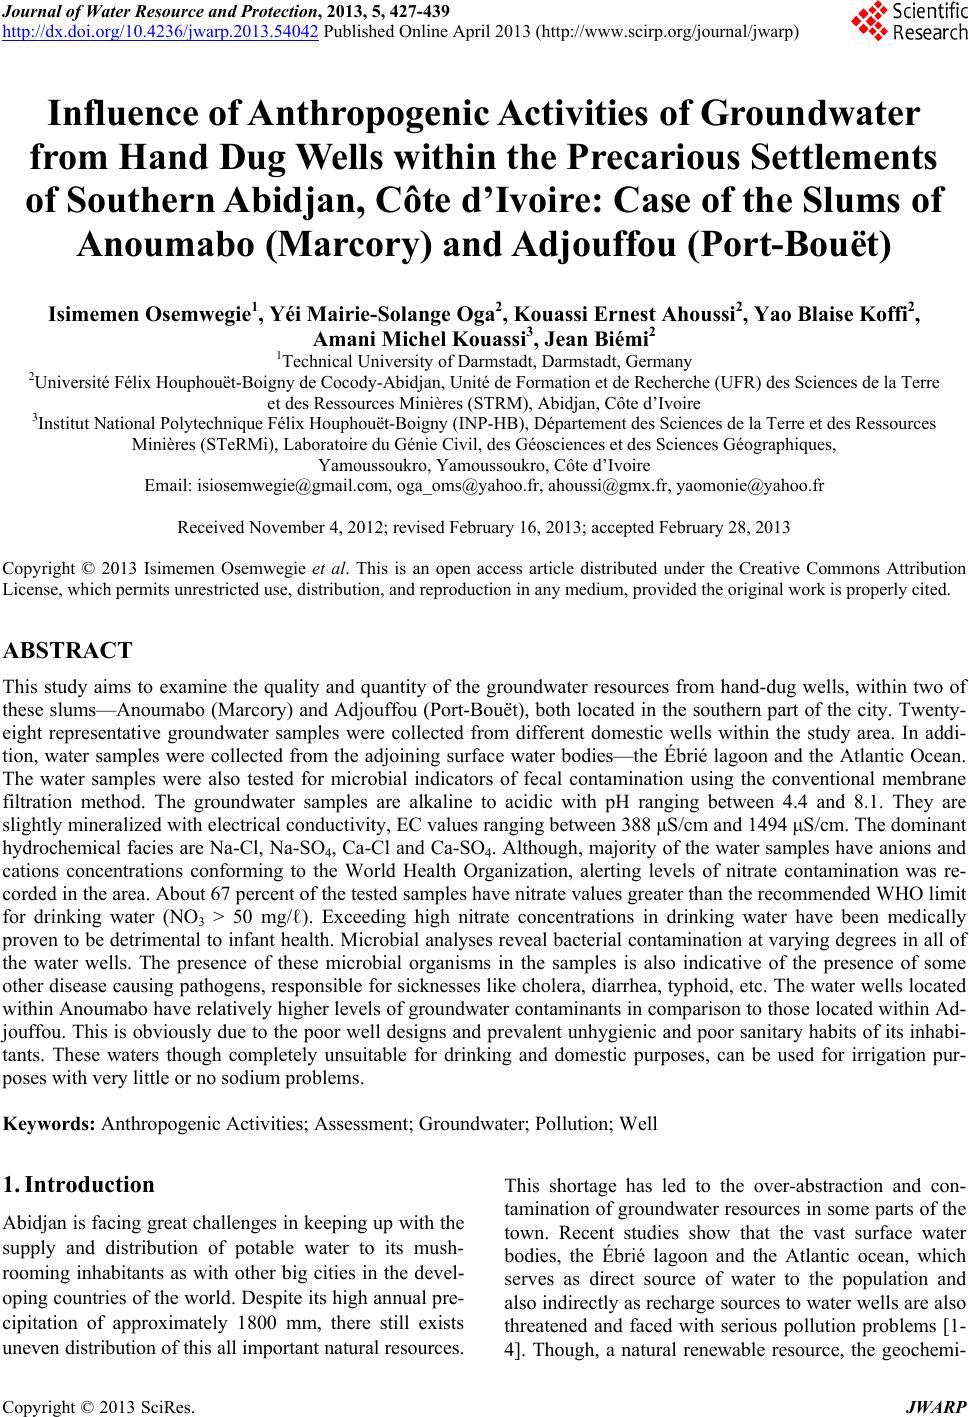 Journal of Water Resource and Protection, 2013, 5, 427-439 http://dx.doi.org/10.4236/jwarp.2013.54042 Published Online April 2013 (http://www.scirp.org/journal/jwarp) Influence of Anthropogenic Activities of Groundwater from Hand Dug Wells within the Precarious Settlements of Southern Abidjan, Côte d’Ivoire: Case of the Slums of Anoumabo (Marcory) and Adjouffou (Port-Bouët) Isimemen Osemwegie1, Yéi Mairie-Solange Oga2, Kouassi Ernest Ahoussi2, Yao Blaise Koffi2, Amani Michel Kouassi3, Jean Biémi2 1Technical University of Darmstadt, Darmstadt, Germany 2Université Félix Houphouët-Boigny de Cocody-Abidjan, Unité de Formation et de Recherche (UFR) des Sciences de la Terre et des Ressources Minières (STRM), Abidjan, Côte d’Ivoire 3Institut National Polytechnique Félix Houphouët-Boigny (INP-HB), Département des Sciences de la Terre et des Ressources Minières (STeRMi), Laboratoire du Génie Civil, des Géosciences et des Sciences Géographiques, Yamoussoukro, Yamoussoukro, Côte d’Ivoire Email: isiosemwegie@gmail.com, oga_oms@yahoo.fr, ahoussi@gmx.fr, yaomonie@yahoo.fr Received November 4, 2012; revised February 16, 2013; accepted February 28, 2013 Copyright © 2013 Isimemen Osemwegie et al. This is an open access article distributed under the Creative Commons Attribution License, which permits unrestricted use, distribution, and reproduction in any medium, provided the original work is properly cited. ABSTRACT This study aims to examine the quality and quantity of the groundwater resources from hand-dug wells, within two of these slums—Anoumabo (Marcory) and Adjouffou (Port-Bouët), both located in the southern part of the city. Twenty- eight representative groundwater samples were collected from different domestic wells within the study area. In addi- tion, water samples were collected from the adjoining surface water bodies—the Ébrié lagoon and the Atlantic Ocean. The water samples were also tested for microbial indicators of fecal contamination using the conventional membrane filtration method. The groundwater samples are alkaline to acidic with pH ranging between 4.4 and 8.1. They are slightly mineralized with electrical conductivity, EC values ranging between 388 μS/cm and 1494 μS/cm. The dominant hydrochemical facies are Na-Cl, Na-SO4, Ca-Cl and Ca-SO4. Although, majority of the water samples have anions and cations concentrations conforming to the World Health Organization, alerting levels of nitrate contamination was re- corded in the area. About 67 percent of the tested samples have nitrate values greater than the recommended WHO limit for drinking water (NO3 > 50 mg/ℓ). Exceeding high nitrate concentrations in drinking water have been medically proven to be detrimental to infant health. Microbial analyses reveal bacterial contamination at varying degrees in all of the water wells. The presence of these microbial organisms in the samples is also indicative of the presence of some other disease causing pathogens, responsible for sicknesses like cholera, diarrhea, typhoid, etc. The water wells located within Anoumabo have relatively higher levels of groundwater contaminants in comparison to those located within Ad- jouffou. This is obviously due to the poor well designs and prevalent unhygienic and poor sanitary habits of its inhabi- tants. These waters though completely unsuitable for drinking and domestic purposes, can be used for irrigation pur- poses with very little or no sodium problems. Keywords: Anthropogenic Activities; Assessment; Groundwater; Pollution; Well 1. Introduction Abidjan is facing great challenges in keeping up with the supply and distribution of potable water to its mush- rooming inhabitants as with other big cities in the devel- oping countries of the world. Despite its high annual pre- cipitation of approximately 1800 mm, there still exists uneven distribution of this all important natural resources. This shortage has led to the over-abstraction and con- tamination of groundwater resources in some parts of the town. Recent studies show that the vast surface water bodies, the Ébrié lagoon and the Atlantic ocean, which serves as direct source of water to the population and also indirectly as recharge sources to water wells are also threatened and faced with serious pollution problems [1- 4]. Though, a natural renewable resource, the geochemi- C opyright © 2013 SciRes. JWARP  I. OSEMWEGIE ET AL. 428 cal quality and quantity of these waters are controlled to a very great extent by both geogenic and anthropogenic factors. In a bid to resolve this problem of water shortage, individuals, especially those within the slums of the city have gone about digging water wells to serve both do- mestic and agricultural purposes. These wells are mostly dug by local laymen with simple hand tools such as sho- vels and hoes and in some places have been cased with local materials such as used car tyres and metal drums. The quality and quantity of water obtainable from these wells is very doubtful; as they are shallow, the areas around most of the them are not sealed to prevent direct infiltration of surface contaminants, some others are dan- gerously located very close to sewage tanks, pig-rearing houses, bathrooms, car wash, and mechanic workshops amongst other likely pollution sources. In addition, the overall sanitation conditions prevalent within these slums are gruesome. Most of these dug wells have been shut down and abandoned due to dryness. These poverty— stricken communities locally referred to as “quartiers precaire” or “bidonville” are the hardest hit by this ordeal. Records as at 1990 showed that there exist a total of sixty-eight slums within this city; each affected in vary- ing degrees by lack of potable water supply and unhy- gienic sanitation conditions. Water is the elixir of life. Its function to living organisms cannot be substituted by any other substances and as such poor quality water has grave health consequences to both plants and animals. It is a well known fact that “water is not only basic prerequisite for social stability and prosperity—it also creates new areas of life and economy”. This study therefore under- takes the task of determining the quality and quantity of groundwater from the traditional hand-dug wells and the adjoining surface water bodies—the Ébrié Lagoon and the Atlantic Ocean, which also serve as means of water supply, based on hydrochemical, and microbiological data, using as case study two selected slums within the city. Abidjan, the economic and administrative capital of Côte d’Ivoire, is located in the southeastern part of coun- try between latitudes 5˚00' and 5˚30' North and longi- tudes 3˚00' and 6˚00' East. It is a low-lying coastal city built around coastal lagoons on several converging pen- insulas and islands, connected by bridges. It has a surface area of about 14,200 km2 of which about 16% comprise the lagoon. The city of Abidjan, the biggest in Côte d’Ivoire, is subdivided into ten administrative communes. These are 1) Abobo; 2) Adjame; 3) Attecoube; 4) Co- cody; 5) Le plateau; 6) Yopougon; 7) Treichville; 8) Koumassi; 9) Marcory and 10) Port Bouët (Figure 1). There exists no official record of preliminary site inves- tigations of these settlements. They are usually located in geo-risk and geo-hazard prone zones, since; availability is the primary selection criteria. The houses are usually made from materials such as wood, canopies, plastics and in rare cases cement are habited by low income earn- ers with little or no formal education, who cannot afford the high cost of decent accommodations. The occupants are mostly peasant farmers, security guards, iron smelters, block molders, mechanics, carpenters and petty traders. These informal settlements are characterized by, low stan- dard of living, poor health and sanitary conditions, lack of proper waste collection and disposal systems, lack of basic social amenities like roads, drainages, electricity and potable drinking water. 2. The Study Area Abidjan has four distinct morphological components, these are: the coastal belt, the petit—Bassam peninsula, the Ébrié lagoon and the plateau running from south to Figure 1. Map showing the local geology of the study area, samples were collected from areas marked with the red dots. Copyright © 2013 SciRes. JWARP  I. OSEMWEGIE ET AL. 429 north over a distance of about 30 kilometers. This study is restricted to the precarious settlements of Anoumabo and Adjouffou, located within the communes of Marcory and Port-Bouët respectively in the southern part of Abid- jan (Figur e 1). The precarious settlement of Anoumabo is located on the Petit-Bassam peninsula. It is a low-lying zone made up of extremely marshy alluvial soils. The water level is always less than a meter underground. It is an area prone to frequent floods during rainy season. On the other hand, Adjouffou is located in Port Bouët; home to the Felix Houphouet-Boigny international airport, the main seaport as well as the state-owned refinery, CRS. It is located in the coastal belt. It is geographically located at 5˚15'20'' North and 3˚57'52'' West. It is a low-lying zone made up of bar sand deposits from the sea. It is very marshy. The area has an estimated population of 50,000 inhabitants. The climate of the area is generally warm and humid from equatorial. Abidjan is characterized by tropical mon- soon climate (Köppen classification Am) with two long periods of wet season; between the months of May-July and September-November, punctuated by two periods of dry season; December-March and July-August. The an- nual average precipitation is 1800 mm. Average monthly temperatures values range between 25˚C and 32˚C. 2.1. The Local Geology of the Area The study area geologically belongs to the sedimentary basin of cretaceous to quaternary age. It is overlain by light to brownish, coarse-grained marine bar sands. 2.2. The Hydrogeology of the Area The sedimentary basin of Côte d’Ivoire has imbedded three principal aquifers. These are the Quaternary, the Continental Terminal (CT), and the Maastrichtian (base- ment) aquifers from the youngest to the oldest. The qua- ternary aquifer is further divided into two different aqui- fer layers. One composed of coarse-grained marine sands —the Nouakchottien and the other composed of fine sands—the Oögolien [5]. The piezometric water level in this aquifer is very low with values ranging between zero to one meter below ground level; depending on the area. This facilitates easy infiltration of rain water and other likely contaminants from the nearby surface water bodies and sewage effluents into the groundwater. It is the most vulnerable of the aquifers. It has permeability values between 10−3 and 4 × 10‒5 m/s. There is reported vertical drainage from this aquifer into the underlying Continen- tal Terminal, CT [5]. The Continental Terminal, CT aquifer is of Miocene to Pliocene age. Its main aquifers are the n3 and n4 layers separated by a lens of clay, which is discontinuous in some places. This is the most important aquifer in the city of Abidjan, as the city gets its potable water supply from this layer. Its hydraulic parameters are as follow: average permeability varying between 10‒3 m/s within the fine sand layers to as low as 10‒6 m/s depending on the facies [1]. As observed from the piezometric map of the area, groundwater flow is in an N-S direction towards the Ébrié lagoon. There is interconnectivity between this layer and the underlying Maastrichtian basement aquifer, but, the lateral extent is not known. The semi-artesian basement Maastrichtian aquifer is Upper Cretaceous in age. It comprises mainly of quartzitic fissured basement rocks. There is only one well with a depth of approxi- mately 190 meters, located in the Locodjoro area of Abi- djan that penetrates this aquifer. This is owned by a pri- vate water producing company, SADEM. 2.3. The Surface Water Bodies The principal lagoons of Côte d’Ivoire are Grand-lahou, Ébrié lagoon and Aby lagoon, from west to east. These lagoons constitute about 1200 km2 of the entire sedi- mentary basin. The Ébrié lagoon, the most important of the three has a surface area of 566 km2, a length of 125 kilometers, a maximum width of 7 kilometers and an average depth of 5 m. It is the largest lagoon in West Af- rica. It receives freshwater from the Comoé, Agneby and La Mé rivers. In addition to the freshwater input from these rivers, it also receives an input of about 10% di- rectly from precipitation. It is periodically in contact with the Atlantic Ocean through the Grand Bassam inlet in the eastern part of Abidjan and constantly via a narrow ar- tificial channel, the Vridi channel, opened in 1951. The lagoon becomes salty during the dry season, but turns to fresh water during the rainy season. It serves both as a means of transportation, direct water supply to the popu- lace and dumping ground for both domestic and Indus- trial wastes. The levels of pollution in the lagoon have been moderately high due to the discharge of untreated industrial effluents and sewages [6-7]. 3. Materials and Methods 3.1. Geochemical Sampling A preliminary field investigation was carried out to as- certain the availability and accessibility of domestic hand- dug wells within the chosen settlements during the course of the investigation, permission to measure and collect water samples was obtained from the domestic well own- ers and information regarding health and sanitary matters was gathered from the occupants by way of oral inter- view. The domestic wells within the area are coastal aquifers located within a 20 kilometers radius of the coastal zone. Majority of the wells within Anoumabo are poorly cased, Copyright © 2013 SciRes. JWARP  I. OSEMWEGIE ET AL. 430 lined in most parts with shafts consisting of used car tyres and metal drums. They are highly vulnerable to direct atmospheric pollution and contaminants infiltration from nearby sewage effluents. They are characterized by very shallow well depths (between 2 and 4 meters), large well diameters (between 40 and 98 centimeters); short distances from well top to ground surface (between 0.5 and 92 centimeters). The sampling was done during high water period (month of May). Representative groundwater samples were collected from twenty-eight (28) already existing domestic wells—fourteen each from Anoumabo and Ad- jouffou respectively (Figure 2). In addition, samples were collected from the Ébrié la- goon and the Atlantic Ocean (surface water). Water sam- ples were collected using a simple rope and bucket. The water samples were directly collected into set of steril- ized 250 ml polyethylene bottles and glass bottles for major ions and microbial analyses respectively. Subse- quently, they were stored and transported in a thermo- plastic container, cooled with ice packs to a temperature of about 4˚C before been sent to the different laboratories for further analysis. The samples for the analyses of ani- ons were un-acidified, while, those for the analyses of the major cations were acidified with 2 drops of concentrated hydrochloric acid, HCl to a pH of about 2. This is to prevent further chemical reactions or sample degradation. Sensitive physico-chemical parameters of water such as hydrogen ion concentration, pH; temperature (˚C); redox potential, Eh (mv); dissolved oxygen, DO (‰) and elec- trical conductivity, EC (μS/cm) were measured in situ by a Hach digital pH/EC meter. 3.2. Methods of Chemical Analyses Different analytical methods were employed in the de- termination of the key parameters indicative of water quality. Cations an d Anions The major ionic composition of the samples was meas- ured by ion chromatographic method using standard la- boratory procedures. The determination of the major ca- tion and anion concentrations of the water samples was carried out simultaneously. Samples were injected into the test column of the ion chromatograph through a 0.45 µm membrane filter. As a rule of the thumb, samples with electrical con- ductivity values greater than 400 μS/cm were diluted accordingly with distilled water prior to their injection into the ion chromatograph. The dilution factor was taken into account in the computation and compilation of re- sults. The bicarbonate (3 HCO ) concentration of the samples was measured by titration with 0.01 N hydrochloric acid, HCL using a Hach digital titrator within 24 hours of col- lection. Samples were tested qualitatively for the presence of various heavy metals (copper (Cu); nickel (Ni); lead (Pb); uranium (U); chromium (Cr) and cadmium (Cd)) in a quick run using the flame atomic adsorption spectrometer, FAAS with a detection limit of 1 mg/l. Subsequently, based on the resulting peaks, the instrument was cali- brated with standards of known concentration of samples with significant peaks to determine the exact amount of the element within the samples. The boron concentration of the samples was measured using UV-visible spectro- photometer. The samples were mixed with known quan- tities of buffer and Azomethin-H reagent and left in a dark room for two hours. Thereafter, the boron concen- tration was measured by the UV-spectrophotometer us- ing ultra violet light at wavelength of 414 Ωm. This me- thod has a detection limit ranging between 0.01 and 1 Figure 2. Groundwater sampling points. Copyright © 2013 SciRes. JWARP  I. OSEMWEGIE ET AL. 431 mg λ borate. A qualitative analysis for the presence of trichloro- ethene (TCE) and tetrachloroethene (PCE) in the samples was done in the GC/MS SCAN mode of the gas chroma- tography-mass spectrometer, GC-MS; using the purge and trap method with TCE and PCE known standards of 7 µl and 8 µl respectively. 3.3. Methods of Microbial Analyses Traditionally, indicator micro-organisms have been used to suggest the presence of pathogens. Each water sample was analyzed for indicator bacteria of unhygienic condi- tions. These are Fecal coliform, Total coliform and Fe- cal streptococci. Fecal indicators though have no real health significance, they are effective indicators of the hygienic quality of water and the presence of other dis- ease-causing pathogens. They were used in the determi- nation of fecal pollution in the areas under study. Fecal coliforms—these are thermo-tolerant, gram-negative bac- teria present in the gut or the feces of warm-blooded animals. They are more closely related to fecal or sewage pollution and generally do not replicate in water envi- ronment. They are indicator bacteria used for the assess- ment of fecal pollution in raw water sources. Their pres- ence may indicate recent and possibly dangerous con- tamination [8-10]. Their presence in the water samples were detected by the standard membrane filtration tech- nique, using mFC culture medium and incubation for 24 hours at 44.5˚C. Total coliform, some of the members of this group are conclusively of fecal origin, while, others may replicate in suitable water environments. They are not to detect fecal pollution but are used primarily to as- sess the general sanitary quality of already disinfected drinking water. The method of detection was by mem- brane filtration using LES Endo agar and incubation for 24 hours at 37˚C. Fecal streptococci or enterococci are gram-positive bacteria. They are more closely related to fecal pollution than the Total coliform because their nor- mal habitat is the intestinal tract of human and animals. They are used in sanitary evaluation as a supplement to Fecal coliforms for a precise determination of sources of contamination. They tend to be more resistant than Fecal coliform (gram-negative). The method of detection was by membrane filtration using m-enterococcus agar and incubation for 24 hours at 44˚C. The first check of the accuracy of any analysis of the chemical composition of water is the calculation of its charge balance. This stems from a known fact that water is uncharged and obeys the principle of electro-neutrality which states that “total charge of cations and anions bal- ance each other”. The charge balance of the analytical data was calcu- lated using the formula: cations anions Error ofionbalance,EB100 cations anions % During this study, the total hardness of the water sam- ples was calculated with the formula according to Klut and Olszewski (1945) and classified accordingly: 22 dH GHmeqCaMg2.8 λ where 3 1 dH17.848 CaCOmg λ The carbon dioxide concentration of the samples was calculated using Tillmann’s equilibrium equation of the carbonate system: 22 3 2g COHCO Ca T K where 3 HCO is the concentration of the freely dis- solved carbonic acid in water (mg λ or mmol λ ); 2 Ca is the concentration of calcium ion and KT is the temperature dependent Tillmanns constant. 4. Results and Discussion Water quality is normally expressed in terms of four ba- sic categories: physical, chemical and biological. Each of these afore-mentioned categories contains limitless po- tential pollutants, but, for this study only few key pa- rameters sufficient to serve as indicators of pollution were analyzed. Geochemical analysis is carried out on thirty water samples with an aim to determining their quality and suitability for different uses. Twenty-eight of the samples were groundwater samples from hand-dug wells within the Anoumabo and Adjouffou communities in southern Abidjan, while two of them were from the adjoining surface water bodies—Ébrié lagoon and Atlan- tic Ocean respectively. 4.1. The Surface Water Quality assessment was carried out on water samples from the surface environment. These are the Ébrié lagoon and the Atlantic Ocean. The analytical results for the Ébrié lagoon shows a rather high electrical conductivity value of 14.6mScm , a temperature of 30.5˚C, a hy- drogen ion concentration, pH of 6.9 and an alkalinity value of 16 as 3 CaCO mg λ . It belongs to the Na-Cl hydrochemical facies. The areas around the lagoon smell offensively of rotten egg. This signifies that the concen- tration of dissolved hydrogen sulphide, H2S in the water is greater than 1 mg/ℓ. There is an approximate ratio of 1:3 of the concentra- tion of the ionic constituents of the Ébrié lagoon to those of the Atlantic Ocean. The concentration of the constitu- ent ions of the water from the surface water bodies—the Ébrié lagoon and the Atlantic Ocean is shown in the Copyright © 2013 SciRes. JWARP  I. OSEMWEGIE ET AL. 432 graph below (Figure 3). 4.2. Groundwater A total of twenty-eight groundwater samples from al- ready existing domestic wells were analyzed. These wells which tap from the shallow, unconfined quaternary aquifer have distances not exceeding 20 kilometers from the Atlantic coast. The measured physico-chemical pa- rameters of the groundwater samples (Table 1). The samples from Anoumabo have lower pH values and were relatively more acidic compared to those from Adjouffou. Majority (86%) of the samples from Anoumabo do not conform to the WHO recommended pH range (6.5 < pH < 8.5) for drinking water. The area has a mean, maxi- mum and minimum pH value of 5.6, 6.6 and 4.5 respec- tively. The minimum and maximum values were recorded in samples; WM_7 and WM_12 respectively (Figure 4). The groundwater samples from Adjouffou have a mean, maximum and minimum pH of 6.5, 8.1 and 6 re- spectively. The maximum and minimum pH was re- corded in samples WP_10 and WP_4 respectively. About 64% of the samples from this area are acidic and have pH values below the WHO permissible range for drinking water. The acidification of these waters might either be Figure 3. Graph of analytical results of the physico-chemical of the Ebrie lagoon and the Atlantic Ocean. All units are in mg λ except for the temperature (˚C) and EC Scm. The blue and red bars represent water sample from the Ebrie lagoon and the Atlantic Ocean respectively. Figure 4. Plot of hydrogen ion concentration, pH of water samples. The green bars represent groundwater samples from Anoumabo while, the bl ue bars are groundwater sampl es from Adjouffou. Copyright © 2013 SciRes. JWARP  I. OSEMWEGIE ET AL. 433 Table 1. Results of geochemical of water samples. Cations Anions Sampling location Sample Id Na+ (mg/l) K+ (mg/l) Mg2+ (mg/l) Ca2+ (mg/l) 4 NH (mg/l) B+ (mg/l) Cl− (mg/l) 3 HCO (mg/l) F− (mg/l) 3 NO (mg/l) 2 NO (mg/l) 2 4 SO (mg/l) 3 4 PO (mg/l) Br− (mg/l) Fe total (mg/l) Mn total (μg/l) EB1 Ebrie lagoon 2566.44 117.07 148.13 332.88 29.60 1.204921.9823.1814.5211.44 541.216.2 14.26 24.7 113.9 −0.21 WM_1 163.63 39.64 5.9839.3 16.7 0.09155.132.4416.78280.381.5545.066.93 0.33 70.50 92.403.2 WM_2 21.1 10.14 2.6335.27 0.15 0.1 22.72 3.050.2120.94 49.91 0.08 83.20 0.0020.3 WM_3 48.28 20.69 4.444.82 1 0.1150.924.880.28119.740.51 66.570.75 0.12 222.90 0.304.1 WM_4 40.4 19.84 2.7130.04 0.38 0.2 53.932.2 0.1261.66 77.470.04 0.71 38.60 0.00−2.3 WM_5 50.77 21.5 2.9232.67 2.82 0.1661.373.660.7369.68 111.531.94 0.53 40.50 19.20−5.1 WM_6 73.3 27.51 3.0831.7 8.8 0.1285.22.320.86184.1 32.080.33 0.1 558.50 18.400.7 WM_7 71.17 21.2 2.6523.01 1.54 0.1580.396.1 0.01154.56 35.270.12 0.21 492.80 7.40−4.9 WM_8 66.61 26.67 4.1824.49 20.16 0.04 82.024.640.95161.750.2950.95 0.37 0.62 86.30 62.901.3 WM_9 99.74 27.23 6.1244.49 1.75 0.22100.41.460.14143.640.54103.930.28 0.74 797.30 50.603.1 WM_10 34.28 12.89 3.1822.67 0.27 0.141.423.660.6995.40.0651.120.21 0.06 0.00 4.20−9.2 WM_11 44.9 20.51 2.6741.59 0.08 0.1550.6117.080.388.120.4234.41 0.13 282.90 4.1010.3 WM_12 105.21 40.19 11.29 126.91 0.02 0.1598.530.51 169.81 159.980.84 0.42 0.00 2.1015.5 WM_13 104.49 40.12 4.3280.11 0.04 0.08118.6519.521.82111.324.52137.36 0.23 0.00 0.007.6 WM_14 74.67 36.5 4.3739.62 6.44 0.0895.691.460.91233.22 33.38 0.33 76.20 6.50−2.6 Anoumabo, Marcory Average 71.33 26.05 4.3244.05 4.30 0.1378.357.361.77135.311.1370.641.18 0.33 196.41 19.15 WP_1 49.27 7.64 3.4934.32 0/35 0.1385.4719.520.4313 12.91.25 0.23 7.10 0.0014.6 Sea water 8960.67 345.30 369.10 1095.73 0.28 3.234921.9832.943.565.49 2386.416.93 73.05 87.10 48.80−7.5 WP_2 45.21 7.14 3.7228.38 0.37 0.0976.156.1 0.1730.31 24.74 0.27 38.50 0.008.7 WP_3 22.4 5.54 2.11 19.19 0.42 0.0639.117.690.0826.860.1715.130.04 0.1 0.00 0.006.5 WP_4 24.19 7.49 1.8224.63 1.25 0.1521.434.88 0.0834.230.1324.640.02 0.03 58.80 0.0020.6 WP_5 53.55 21.39 5.9855.41 2.45 0.1365.4421.720.43141.05 43.49 0.13 55.30 103.207.3 WP_6 58.85 23.32 4.3840.08 0.63 0.0767.2210.980.661160.1543.45 0.33 31.70 19.906.3 WP_7 56.16 16.5 3.6739.56 0.09 0.1453.959.27 0.23119.61 25.630.02 0.1 0.00 57.1010.6 WP_8 21.81 9.32 1.9934.19 0.99 0.0720.3710.980.0939.562.2519.830.09 0.03 22.80 0.0025.0 WP_9 34.84 13.43 3.0949.85 1.62 0.1128.7125.990.1863.610.5932.14 0.4 132.10 24.9022.5 WP_10 50.14 17.46 2.6668.79 0.68 0.0949.6814.64 0.3583.56 0.9138.65 0.07 0.00 0.0024.4 WP_11 23.48 8.2 2.1533.96 0.01 0.1721.948.3 0.07 42.88 29.430.31 0.05 522.20 30.6019.8 WP_12 37.84 10.39 3.5125.97 0.3 0.0854.785.490.14 57.59 22.960.14 0.16 19.20 0.006.9 WP_13 17.8 5.56 2.4428.66 0.27 0.0725.3114.640.06 4.09 13.080.09 0.09 26.60 0.0032.6 WP_14 60.23 9.89 7.2325.08 0.19 0.1193.2522.81 0.22 25.58 22.251.06 0.23 0.00 0.009.6 Adjouffou, Port-Bouet Average 38.96 11.97 3.4436.44 0.71 0.1047.4912.580?2160.380.7027.340.22 0.15 69.78 18.13 EB1 = Electronic neutrality has units in %; 2It was calculated using the Aquachem software-ions contributing more than 10% to the overall water chemistry were used in determining the water type. due to the direct infiltration of acid rain or from the ioni- zation of the metallic well casings. The samples from Anoumabo were slightly mineral- ized with electrical conductivity, EC ranging between 388 (min.) and 1494ax.) for samples, WM_2 and WM_12 respectively. The area has a mean EC of μScm (m 783 μShe other hand, the samples from Ad- jouffou have a mean EC of cm. On t 494 μSc inimum and maximum EC value of 298 μS/cm and 779 μS/cm for wells, WP_3 and WP_5 respectively. The EC values of the samples from Anoumabo were relatively higher than those from Adjouffou. m, and a m Copyright © 2013 SciRes. JWARP  I. OSEMWEGIE ET AL. 434 The redox potential, Eh shows that oxidizing as well as reducing conditions are prevalent within the wells (Table 1). Reducing conditions was recorded only in wells, WM_12, WM_13 (Anoumabo) and WP_2, WP_8, WP_9, WP_11, WP_13, WP_14 (Adjouffou). 4.2.1. Geochemica l A n alyses Water Classification The profile of the major cations and anions are pre- sented in the Schoeller semi-logarithmic plot (Figure 5). There are four main categories of water type distin- guishable in the studied wells of Anoumabo. These are the sodium-dominated, the calcium-dominated, the chlo- rine-dominated and the sulphate-dominated water types (Figure 6). Although, nitrate was the dominant anion in some of these groundwater samples, it was not included in the facies determination, because, it is normally listed as a minor anionic constituent of water. There is a dominance of Na-Cl hydrochemical facies in the area. Samples, WM_1, WM_6, WM_7, WM_8, WM_10, WM_13 and WM_14, belong to this category. Other hydrochemical facies in the area are Na-SO4 (sam- ples, WM_4 and WM_5); Ca-SO4 (samples, WM_2 and WM_12); Ca-Cl (samples, WM_3, WM_9 and WM_11). In the commune of Adjouffou, the two distinguishable hydrochemical facies are Na-Cl (samples WP_1, WP_2, WP_3, WP_6, WP_7, WP_12 and WP_14) and Ca-Cl (WP_4, WP_5, WP_8, WP_9, WP_10, WP_11, and WP_13). 4.2.2. Cations The measured cations and their resulting concentrations are briefly discussed below: Sodium and Potassium The sodium content of the samples from both localities was below the WHO permissible limit 250mg λ for drinking water. The samples from Anoumabo have a mean sodium concentration of 71.3 mg λ , and a maxi- mum and minimum of 163.6 mg λ and 21.1 mg λ in wells, WM_1 and WM_2 respectively. The samples from Adjouffou have a mean sodium concentration of 38.9 mg λ , with a maximum of 60.2 mg λ and minimum of 17.8 mg λ in samples, WP_13 and WP_14 respec- tively. The potassium concentration of the tested sample of both localities is very low with values ranging be- tween 5.5 and 40.1mg λ . Calcium and Magnesium The tested samples from Anoumabo have mean cal- cium and magnesium concentrations of the water sam- ples are 44 mg λ and 4.3 mg λ respectively. This is a slightly higher concentration than those from Adjouf- fou which have average calcium and magnesium concen- trations of 36 mg λ and 3.4 mg λ respectively. These recorded concentrations are lower than the rec- ommended WHO drinking water standard of 400 mg λ and 120mg λ for calcium and magnesium ions re- Figure 5. Schoeller plot for Anoumabo. SW_1 is the Ébrié lagoon. Copyright © 2013 SciRes. JWARP  I. OSEMWEGIE ET AL. 435 Figure 6. Schoeller plot of for Adjouffou. Sample SW_2 is the Atl a nti c Ocean. spectively. The Total Hardness Calcium and magnesium are the major bivalent ions contributing to hardness of water. Although, the total hardness of water does not necessarily affect its hydro- chemical quality, it is however detrimental to the wash- ing process. The samples were categorized into five dis- tinct classes of water hardness. These are very soft, soft, slightly hard, moderately hard and hard in order of in- creasing degree of water hardness. The samples from Anoumabo with relatively higher concentrations of cal- cium and magnesium ions fell into the category of very soft to hard, while, the samples from Adjouffou fell into the category of very soft to slightly hard (Table 2). 4.2.3. Anions The analyzed anions and their resulting concentrations are briefly discussed below: Carbonates and Chloride Bicarbonate ion is the dominant carbonate species in the tested water samples as they have pH values ranging between 4.4 and 8.3; values at which bicarbonate domi- nates. The bicarbonate concentration was estimated from the measured total alkalinity content, TAC. The samples from Anoumabo were weakly mineralized and have low alkalinity with values ranging between 1.5 and 19.5 mg λ and a mean value of 7.4 mg λ . The samples from Adjouffou have relatively higher alkalinity values ranging between 4.9 mg λ and 26 mg λ with a cal- culated mean of 12.6 mg λ . The calculated carbon dioxide concentration of the samples was plotted against the bicarbonate concentra- tions of the samples in order to ascertain the presence of free aggressive CO2 (Figure 7). Samples from the Ébrié lagoon and groundwater samples, WM_13 and WP_10 from Anoumabo and Adjouffou respectively show the presence of free aggressive CO2. Three samples: WM_12 (Anoumabo); WP_9 and WP_14 (Adjouffou) have no free CO2. The rest of the samples were in a state of car- bonic acid—carbonate equilibrum. Typical chloride concentration in groundwater ranges between 6 and 15 mg λ . Groundwater samples from Anoumabo and Adjouffou have mean chloride concen- trations of 78.4 mg λ and 47.5 mg λ respectively, exceeding the natural concentration. Although, these samples have chloride concentrations above the natural background values, they do not exceed the recommended WHO limit of 250 mg λ for drinking water. Possible external chloride sources include human feces from leaky sewage tanks and salt water intrusion. Copyright © 2013 SciRes. JWARP  I. OSEMWEGIE ET AL. 436 Table 2. Table showing total hardne ss of sampl es. Sampling location Anoumabo, Marcory Adjouffou, Port-Bouet Sample Id Hardness* Classification Sample Id Hardness* Classification W_M1 6.9 Soft W_P1 5.6 Soft W_M2 5.5 Soft W_P2 4.8 Soft W_M3 7.3 Soft W_P3 3.2 Very soft W_M4 4.8 Soft W_P4 3.9 Very soft W_M5 5.2 Soft W_P5 9.1 Slightly hard W_M6 5.1 Soft W_P6 6.6 Soft W_M7 3.8 Very soft W_P7 6.4 Soft W_M8 4.4 Soft W_P8 5.2 Soft W_M9 7.6 Soft W_P9 7.7 Soft W_M10 3.9 Very soft W_P10 10.2 Soft W_M11 6.4 Soft W_P11 5.2 Soft W_M12 20.3 Hard W_P12 4.4 Soft W_M13 12.2 Moderately hard W_P13 4.6 Soft W_M14 6.5 Soft W_P14 5.2 Soft *hardness as German hardness (dH). Figure 7. Graph of CO2-HCO3 equilibrum curve. Sulphate and Fluoride The sulphate concentration of tested samples from Anoumabo (mean:70.46 mg λ ) is relatively than those of Adjouffou (mean:26.31 mg λ ). The resulting sul- phate concentrations of samples from both localities do however conform to the WHO permissible value of 250 mg λ for drinking water. The WHO permissible limit for fluoride 1.5 mg λ in drinking water was exceeded by samples WM_1 16.78 mg λ and WM_13 1.82 mg λ both from Anoumabo. The rest of the tested samples have concen- trations below the WHO permissible limit. Excessive high fluoride concentration in water is harmful to the overall dental health and can lead to fluorosis and tooth decay in younger children. 4.2.4. N utrien ts i n G r oundwater Nitrogen-Nitrate Concentration The distribution of nitrate in groundwater is shown by the Figure 8. Nitrate usually enters groundwater either from biologic or anthropogenic sources of nitrogen. It is not derived primarily from water-rock interaction. Ma- jority of the tested groundwater samples from both study area displayed alerting levels of nitrogen compounds (nitrate-NO3, nitrite-NO2 and ammonium-NH4). Recent studies on nitrate contamination of groundwater resources in Abidjan revealed that the major pollution threats are sewers and the lack of a developed system for collection and treatment of waste and wastewater [3,4]. This has led to the high nitrate concentrations (commonly 100 - 300 mg λ , max. 500 mg λ as NO3) in water supply bore- holes (1994-2004) with cholera cases between 2001 and 2003 being attributed to contaminated groundwater [8]. When compared against the WHO permissible limit for drinking water 3 N-NO50mg λ , only one sam- ple (WM_2) from Anoumabo was within safe drinking water limits. Groundwater samples (WP_1, WP_2, WP_3, WP_4, WP_8, WP_13, WP_14) from Adjouffou have concentrations within the WHO permissible limit for drinking water. The level of nitrate contamination of water wells in Anoumabo is relatively higher than those in Adjouffou. This is due basically to lack of proper housing planning, location of water wells close to sewage tanks and the overall unhygienic sanitation conditions prevalent within the community. Where there is high nitrate content, there is inevitably bacterial contamination. Possible diffused, non-point nitrate sources are decomposing organic matter, leaching of chemical fertilizers, leaching of animal ma- nure and discharges from septic and sewage tanks. The coarse surface soil texture and shallow well depths are also contributing factors. Copyright © 2013 SciRes. JWARP  I. OSEMWEGIE ET AL. 437 Figure 8. Graph showing the nitrate concentrations of the samples. Measures must be put in place to upgrade the sanitary conditions within these slums and seasonal groundwater quality monitoring as it can result in grave health conse- quences, mainly on little babies below six months result- ing in methemoglobinema or “blue baby syndrome” which threatens oxygen building capacity of the blood. It is therefore advisable that these waters should not be used for babies under six months old without adequate treatment measures. Nitrites and Ammonia The groundwater samples from Anoumabo have an average nitrite concentration of 1.14mg λ . 29% of the samples have nitrite levels exceeding the WHO limit of 0.55 mg λ . The groundwater samples from Adjouffou have an average nitrite concentration of 0.75 mg λ and 21% of water samples in this area exceeded the WHO permissible limit for drinking water. Nitrite when present in water is toxic even at very little concentrations. Ammonia is a form of nitrogen present in reducing groundwater. 50% of the samples from Anoumabo have levels of ammonia exceeding the WHO limit (1.5 mg λ ), while 14% exceeded this recommended limit in the Ad- jouffou community. Ammonia is in itself not toxic, but, it can be oxidized under favorable environmental condi- tions to nitrates and nitrites, having greater toxicity. 4.2.5. Mi nor Constituents All the tested samples from both study location exceed the WHO limit for bromide 0.01 mg λ in drinking water. There was mean bromide concentration of 0.34 mg λ and 0.16 mg λ of samples from Anoumabo and Adjouffou respectively. Bromide above the WHO recom- mended concentration hampers the water treatment pro- cesses by triggering chemical reactions producing poten- tially harmful by-products. It has also been reported to increase the risk of cancer when taken over a long pe- riod of time. 4.2.6. Heavy Metals Samples were initially tested qualitatively for the pres- ence of heavy metals (iron, Fe; magnesium, Mn; stron- tium, Sr; zinc, Zn; cadmium, Cd; uranium, U; lead, Pb; nickel, Ni and chromium, Cr) with the flame atomic ad- sorption spectrometer at a detection limit of 1mg λ . Significant peaks were observable only for elements Fe, Mn, Sr and Zn after the initial quick run. Subsequently, the instrument was calibrated using calibrants of each of the observed species with known stoichiometry. Quanti- fication was done using calibration curves. The WHO standard for iron in drinking water 0.3 mg λ was ex- ceeded by 14% of the samples from Anoumabo and by 7% of the samples from Adjouffou. The Mn, Sr and Zn concentrations of the samples fell within the WHO [11] permissible limit for drinking water. 4.2.7. TCE (Trich loroethen e ) a nd P CE (Tetrachloroethene) Samples were tested for the presence of TCE (trichoro- ethene) and PCE (tetrachloroethene) using the gas chro- matograph-mass spectrometer. There were no significant peaks for the tested samples. This signifies the waters are free from TCE and PCE contamination. 4.3. Microbiological Analyses The tested bacteriological parameters, Total and Fecal coliforms and Fecal streptococci of all the samples were above the WHO permissible limit (Table 3). Copyright © 2013 SciRes. JWARP  I. OSEMWEGIE ET AL. 438 According to WHO drinking water guidelines [11], these bacterial organisms must not be detectable in any 100 ml sample. There was alerting levels of microbial pollution of the groundwater in both areas. The high Fe- cal streptococci content of the some of the samples con- firm the presence of fresh fecal contamination. They are therefore, far from been potable and unfit for consump- tion. Samples (WM_11, WM_1, WP_1 and WP_7) have values of Fecal coliforms and Fecal streptococci less than 1 count/100ml. These are wells reportedly been disin- fected periodically with chlorine solutions by the well owners. Although, free from fecal contamination, these wells are contaminated by Total coliforms. The rest of the samples show varying degrees of fecal contamination. The ratio of Fecal coliforms to Fecal streptococci can be used to investigate different sources of fecal contamina- tion. Ratios between 2 and 4 or higher are indicative of human contamination while, ratios less than 2 are indica- tive of animal contamination. Although, no longer rec- ommended due to ambiguities in the microbial identifi- cation process, this ratio is still useful in the monitoring of very recent fecal pollution. Human feces was the identified pollution source in samples; WM_2, WM_7 and WP_2 having Fecal coli- forms to Fecal streptococci ratios of 2.5, 7.1 and 2.7 re- spectively. All the other samples have ratios lower than 2, indicating animal sources of fecal pollution. These fecal pollution sources can be directly linked to the rearing of animals and the construction of public latrines and bath- rooms very close to the recharge sources of these wells. Both human and animal wastes are as such emptied di- rectly into the lagoon and subsequent serve as microbial pollution sources of contamination for the underlying groundwater aquifer being recharged by this lagoon. Ani- mal wastes from these public bathrooms and toilets into the Ébrié lagoon are possibly sources of the high micro- bial contamination of this water body. 5. Conclusion The analytical results of the water from these domestic wells showed very low pH, abnormally elevated concen- trations of nitrates amongst other organic and non-or- ganic contaminants. They are also not free from micro- bial contamination. Therefore, without doubt, the water contained within these hand dug wells is unsafe for both human and animal consumption. The identified point and diffuse sources of groundwater contamination within the area are leaky cesspools, sewage tanks, animal-rearing activities and domestic and industrial effluents. Although, drilling new wells to the deeper layers of the confined Continental Terminal, CT aquifer would have been the most feasible solution, this is at the moment unrealistic due to the cost involved. However, simple preventive measures of contamination prevention should be adopted at household levels by these well-owners. Measures such as provision of shades/covers for the open wells to mini- Table 3. Result of microbial analyses. Sampling location Anoumabo, Marcory Adjouffou, Port-Bouet Indicator bacteria* Indicator bacteria* Sample Id Fecal coliforms Fecal streptococci Sample Id Fecal coliforms Fecal streptococci Ebrie lagoon 3300 2100 WP_1 <1 <1 WM_1 18 <1 Atlantic Ocean <1 <1 WM_2 121 48 WP_2 375 510 WM_3 112 90 WP_3 172 165 WM_4 141 120 WP_4 480 180 WM_5 193 222 WP_5 8 <1 WM_6 51 102 WP_6 520 290 WM_7 85 12 WP_7 <1 <1 WM_8 1370 1020 WP_8 131 188 WM_9 420 214 WP_9 550 820 WM_10 487 503 WP_10 122 750 WM_11 <1 <1 WP_11 124 184 WM_12 20 20 WP_12 1560 600 WM_13 <1 <1 WP_13 148 164 WM_14 70 112 WP_14 1260 1060 *units as counts/100ml. Copyright © 2013 SciRes. JWARP  I. OSEMWEGIE ET AL. 439 mize atmospheric pollution, sealing up areas around the wells to prevent direct infiltration of possible contami- nants, location of wells at reasonable distances from sewage tanks and cesspools could help in mitigating groundwater contamination. The people should be sensi- tized about the health risk associated with the use of such contaminated waters. Majority of the occupants of these slums are illiterates. Reports show that there are already cases of diarrhea, cholera, typhoid fever, blue baby syn- drome amongst others prevalent in the area. The causes of these illnesses were attributed to spiritual attacks by greater percentage of the inhabitants when interviewed. REFERENCES [1] M. S. Oga, “Ressources en Eaux Souterraines Dans la Région du Grand Abidjan (Côte d’Ivoire): Approche Hy- drochimique et Isotopique,” Thèse de Doctorat de l’Uni- versité de Paris Orsay, 1998. [2] J. P. Jourda, K. J. Kouamé, M. B. Saley, B. H. Kouadio, Y. M. S. Oga and S. Deh, “Contamination of the Abidjan Aquifer by Sewage: An Assessment of Extent and Strate- gies for Protection,” Groundwater Pollution in Africa, Redactors Yongxin Xu and Brent Usher, Balkema, 2006, pp. 291-300. [3] K. E. Ahoussi, N. Soro, G. Soro, T. Lasm, M. S. Oga and S. Zadé, “Groundwater Pollution in Africans Biggest Towns: Case of the Town of Abidjan (Côte d’Ivoire),” European Journal of Scientific Research, Vol. 20, No. 2, 2008, pp. 302-316. [4] K. E. Ahoussi, N. Soro, G. Soro, M. S. Oga and S. P. Zadé, “Caractérisation de la Qualité Physico-Chimique et Bactériologique des Eaux de Puits de la Ville d’Abidjan (Côte d’Ivoire),” Africa Geoscience Review, Vol. 16, No. 3, 2009, pp. 203-215. [5] N. Aghui and J. Biémi, “Géologie et Hydrogéologie des Nappes de la Région d’Abidjan et Risques de Con- taminations,” Annales de l’Université de Côte d’Ivoire, Série C (Sciences), Vol. 20, 1984, pp. 313-347. [6] A. Coulibaly, S. Mondé, V. A. Wognin and K. Aka, “State of Anthropic Pollution in the Estuary of Ebrié La- goon (Côte d’Ivoire) by Analysis of the Metal Elements Traces,” European Journal of Scientific Research, Vol. 19, No. 2, 2008, pp. 372-390. [7] G. Soro, S. B. Métongo, N. Soro, K. E. Ahoussi, K. F. Kouamé, S. G. P. Zadé and T. Soro, “Métaux Lourds (Cu, Cr, Mn et Zn), Dans les Sédiments de Surface d’une Lagune Tropicale Africaine: Cas de la Lagune Ebrié (Côte d’Ivoire),” International Journal of Biological and Chemical Sciences, Vol. 3, No. 6, 2009, pp. 1408-1427. [8] J. S. Claon, “Consommation d’eau de Puits dans Quatre Communes de la Ville d’Abidjan Desservies par le Rés- eau de Distribution d’eau Potable,” Thèse de Doctorat en Pharmacie, Université d’Abidjan, Côte d’Ivoire, 1997. [9] K. E. Ahoussi, Y. M. S. Oga, Y. B. Koffi, A. M. Kouassi, N. Soro and J. Biémi, “Caractérisation Hydrogéochimi- que et Microbiologique des Ressources en eau du Site d’un Centre d’Enfouissement Technique (CET) de Côte d’Ivoire: Cas du CET de Kossihouen dans le District d’Abidjan (Côte d’Ivoire),” International Journal of Bio- logical and Chemical Sciences, Vol. 5, No. 5, 2011, pp. 2114-2132. [10] K. E. Ahoussi, Y. B. Koffi, A. M. Kouassi, G. Soro, N. Soro and J. Biémi, “Étude des Caractéristiques Chimiques et Microbiologiques des Ressources en eau du Bassin Versant du N’zi: Cas de la Commune de N’zianouan (Sud de la Côte d’Ivoire),” International Journal of Biological and Chemical Sciences, Vol. 6, No. 4, 2012, pp. 1854- 1873. [11] WHO, “Guidelines for Drinking Water Quality,” 3rd Edition, WHO, Geneva, 2004. Copyright © 2013 SciRes. JWARP |