Paper Menu >>
Journal Menu >>
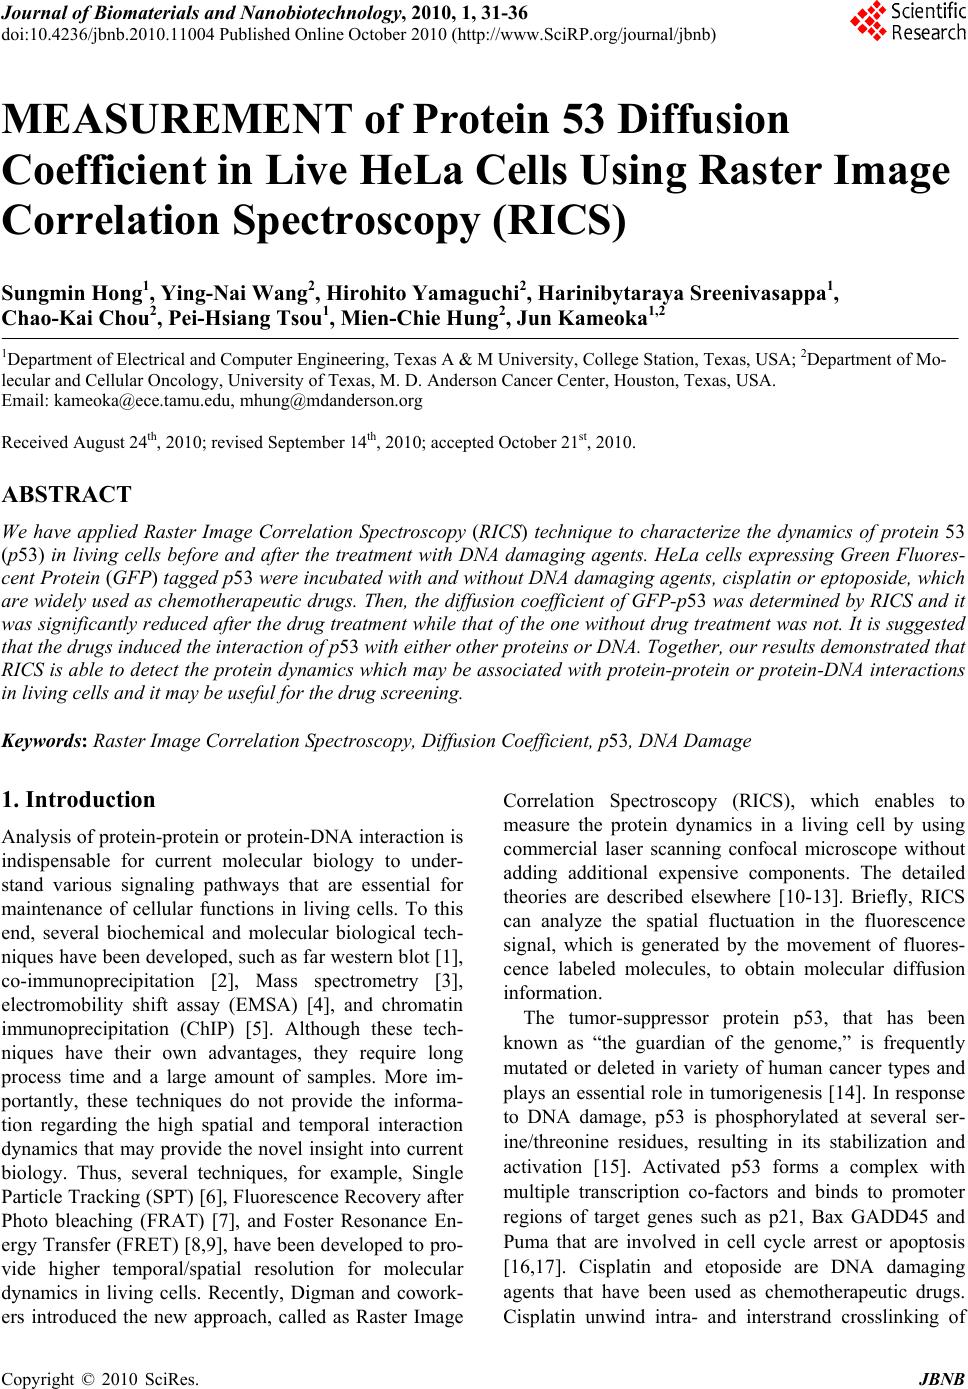 Journal of Biomaterials and Nanobiotechnology, 2010, 1, 31-36 doi:10.4236/jbnb.2010.11004 Published Online October 2010 (http://www.SciRP.org/journal/jbnb) Copyright © 2010 SciRes. JBNB 31 MEASUREMENT of Protein 53 Diffusion Coefficient in Live HeLa Cells Using Raster Image Correlation Spectroscopy (RICS) Sungmin Hong1, Ying-Nai Wang2, Hirohito Yamaguchi2, Harinibytaraya Sreenivasappa1, Chao-Kai Chou2, Pei-Hsiang Tsou1, Mien-Chie Hung2, Jun Kameoka1,2 1Department of Electrical and Computer Engineering, Texas A & M University, College Station, Texas, USA; 2Department of Mo- lecular and Cellular Oncology, University of Texas, M. D. Anderson Cancer Center, Houston, Texas, USA. Email: kameoka@ece.tamu.edu, mhung@mdanderson.org Received August 24th, 2010; revised September 14th, 2010; accepted October 21st, 2010. ABSTRACT We have applied Raster Image Correlation Spectroscopy (RICS) technique to characterize the dynamics of protein 53 (p53) in living cells before and after the treatment with DNA damaging agents. HeLa cells expressing Green Fluores- cent Protein (GFP) tagged p53 were incubated with and without DNA damaging agents, cisplatin or eptoposide, which are widely used as chemotherapeutic drugs. Then, th e diffusion coefficient of GFP-p53 was determined by RICS and it was significantly reduced after the drug treatment while that of the one without drug treatment was not. It is suggested that the drugs induced the interaction of p53 with either other proteins or DNA. Together, our results demonstrated that RICS is able to detect the protein dynamics which may be associated with protein-protein or protein-DNA interactions in living cells and it may be useful for the drug screening. Keywords: Raster Image Correlation Spectroscopy, Diffusion Coefficient, p53, DNA Damage 1. Introduction Analysis of protein-protein or protein-DNA interaction is indispensable for current molecular biology to under- stand various signaling pathways that are essential for maintenance of cellular functions in living cells. To this end, several biochemical and molecular biological tech- niques have been developed, such as far western blot [1], co-immunoprecipitation [2], Mass spectrometry [3], electromobility shift assay (EMSA) [4], and chromatin immunoprecipitation (ChIP) [5]. Although these tech- niques have their own advantages, they require long process time and a large amount of samples. More im- portantly, these techniques do not provide the informa- tion regarding the high spatial and temporal interaction dynamics that may provide the novel insight into current biology. Thus, several techniques, for example, Single Particle Tracking (SPT) [6], Fluorescence Recovery after Photo bleaching (FRAT) [7], and Foster Resonance En- ergy Transfer (FRET) [8,9], have been developed to pro- vide higher temporal/spatial resolution for molecular dynamics in living cells. Recently, Digman and cowork- ers introduced the new approach, called as Raster Image Correlation Spectroscopy (RICS), which enables to measure the protein dynamics in a living cell by using commercial laser scanning confocal microscope without adding additional expensive components. The detailed theories are described elsewhere [10-13]. Briefly, RICS can analyze the spatial fluctuation in the fluorescence signal, which is generated by the movement of fluores- cence labeled molecules, to obtain molecular diffusion information. The tumor-suppressor protein p53, that has been known as “the guardian of the genome,” is frequently mutated or deleted in variety of human cancer types and plays an essential role in tumorigenesis [14]. In response to DNA damage, p53 is phosphorylated at several ser- ine/threonine residues, resulting in its stabilization and activation [15]. Activated p53 forms a complex with multiple transcription co-factors and binds to promoter regions of target genes such as p21, Bax GADD45 and Puma that are involved in cell cycle arrest or apoptosis [16,17]. Cisplatin and etoposide are DNA damaging agents that have been used as chemotherapeutic drugs. Cisplatin unwind intra- and interstrand crosslinking of 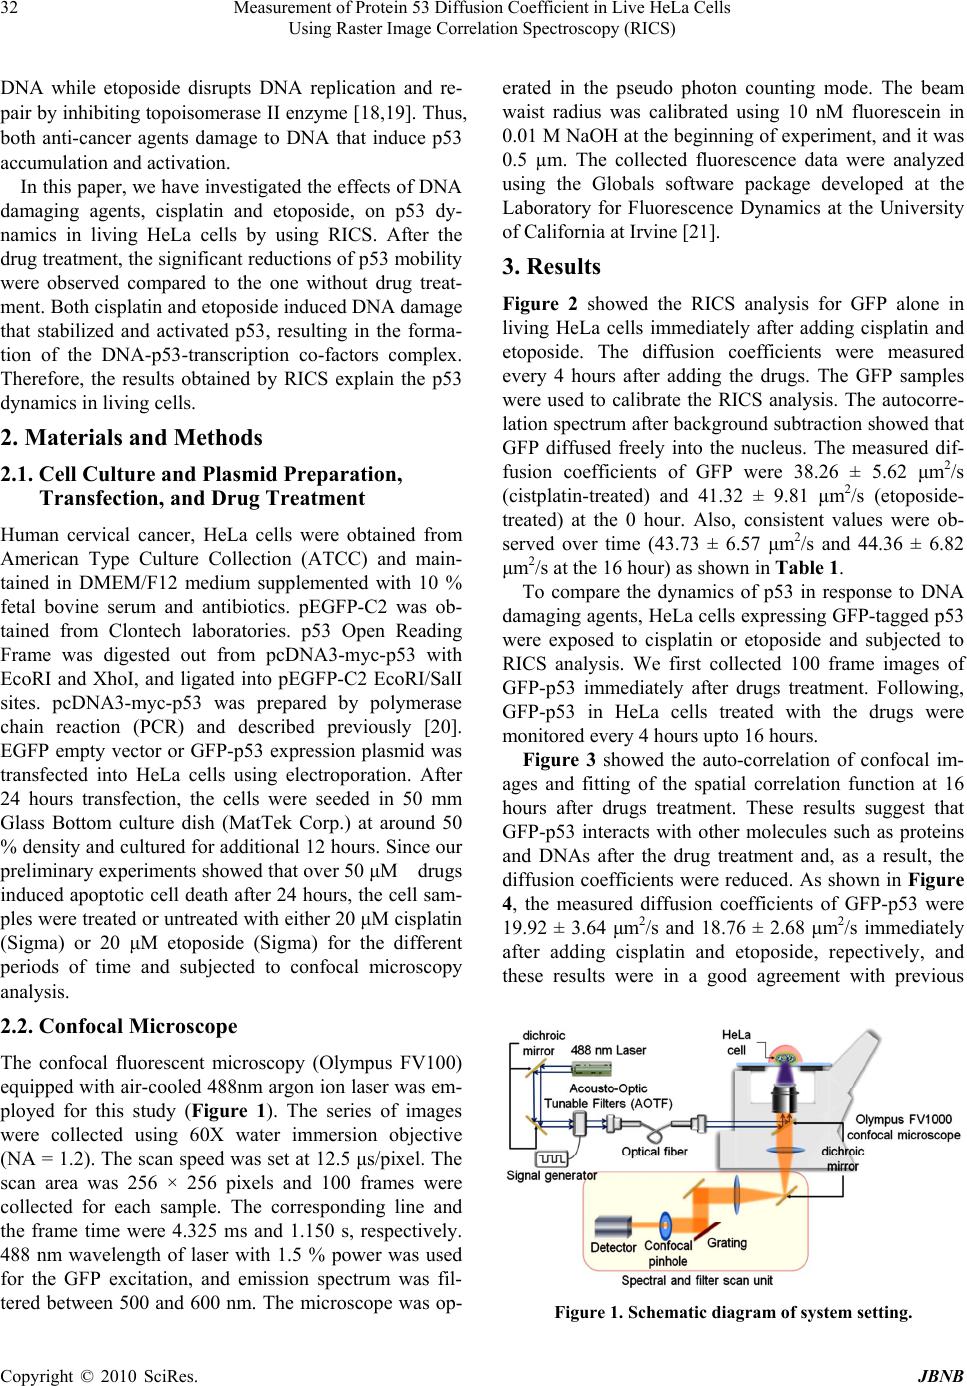 Measurement of Protein 53 Diffusion Coefficient in Live HeLa Cells 32 Using Raster Image Correlation Spectroscopy (RICS) DNA while etoposide disrupts DNA replication and re- pair by inhibiting topoisomerase II enzyme [18,19]. Thus, both anti-cancer agents damage to DNA that induce p53 accumulation and activation. In this paper, we have investigated the effects of DNA damaging agents, cisplatin and etoposide, on p53 dy- namics in living HeLa cells by using RICS. After the drug treatment, the significant reductions of p53 mobility were observed compared to the one without drug treat- ment. Both cisplatin and etoposide induced DNA damage that stabilized and activated p53, resulting in the forma- tion of the DNA-p53-transcription co-factors complex. Therefore, the results obtained by RICS explain the p53 dynamics in living cells. 2. Materials and Methods 2.1. Cell Culture and Plasmid Preparation, Transfection, and Drug Treatment Human cervical cancer, HeLa cells were obtained from American Type Culture Collection (ATCC) and main- tained in DMEM/F12 medium supplemented with 10 % fetal bovine serum and antibiotics. pEGFP-C2 was ob- tained from Clontech laboratories. p53 Open Reading Frame was digested out from pcDNA3-myc-p53 with EcoRI and XhoI, and ligated into pEGFP-C2 EcoRI/SalI sites. pcDNA3-myc-p53 was prepared by polymerase chain reaction (PCR) and described previously [20]. EGFP empty vector or GFP-p53 expression plasmid was transfected into HeLa cells using electroporation. After 24 hours transfection, the cells were seeded in 50 mm Glass Bottom culture dish (MatTek Corp.) at around 50 % density and cultured for additional 12 hours. Since our preliminary experiments showed that over 50 μM drugs induced apoptotic cell death after 24 hours, the cell sam- ples were treated or untreated with either 20 μM cisplatin (Sigma) or 20 μM etoposide (Sigma) for the different periods of time and subjected to confocal microscopy analysis. 2.2. Confocal Microscope The confocal fluorescent microscopy (Olympus FV100) equipped with air-cooled 488nm argon ion laser was em- ployed for this study (Figure 1). The series of images were collected using 60X water immersion objective (NA = 1.2). The scan speed was set at 12.5 μs/pixel. The scan area was 256 × 256 pixels and 100 frames were collected for each sample. The corresponding line and the frame time were 4.325 ms and 1.150 s, respectively. 488 nm wavelength of laser with 1.5 % power was used for the GFP excitation, and emission spectrum was fil- tered between 500 and 600 nm. The microscope was op- erated in the pseudo photon counting mode. The beam waist radius was calibrated using 10 nM fluorescein in 0.01 M NaOH at the beginning of experiment, and it was 0.5 µm. The collected fluorescence data were analyzed using the Globals software package developed at the Laboratory for Fluorescence Dynamics at the University of California at Irvine [21]. 3. Results Figure 2 showed the RICS analysis for GFP alone in living HeLa cells immediately after adding cisplatin and etoposide. The diffusion coefficients were measured every 4 hours after adding the drugs. The GFP samples were used to calibrate the RICS analysis. The autocorre- lation spectrum after background subtraction showed that GFP diffused freely into the nucleus. The measured dif- fusion coefficients of GFP were 38.26 ± 5.62 μm2/s (cistplatin-treated) and 41.32 ± 9.81 μm2/s (etoposide- treated) at the 0 hour. Also, consistent values were ob- served over time (43.73 ± 6.57 μm2/s and 44.36 ± 6.82 μm2/s at the 16 hour) as shown in Table 1. To compare the dynamics of p53 in response to DNA damaging agents, HeLa cells expressing GFP-tagged p53 were exposed to cisplatin or etoposide and subjected to RICS analysis. We first collected 100 frame images of GFP-p53 immediately after drugs treatment. Following, GFP-p53 in HeLa cells treated with the drugs were monitored every 4 hours upto 16 hours. Figure 3 showed the auto-correlation of confocal im- ages and fitting of the spatial correlation function at 16 hours after drugs treatment. These results suggest that GFP-p53 interacts with other molecules such as proteins and DNAs after the drug treatment and, as a result, the diffusion coefficients were reduced. As shown in Figure 4, the measured diffusion coefficients of GFP-p53 were 19.92 ± 3.64 μm2/s and 18.76 ± 2.68 μm2/s immediately after adding cisplatin and etoposide, repectively, and these results were in a good agreement with previous Figure 1. Schematic diagram of system setting. Copyright © 2010 SciRes. JBNB 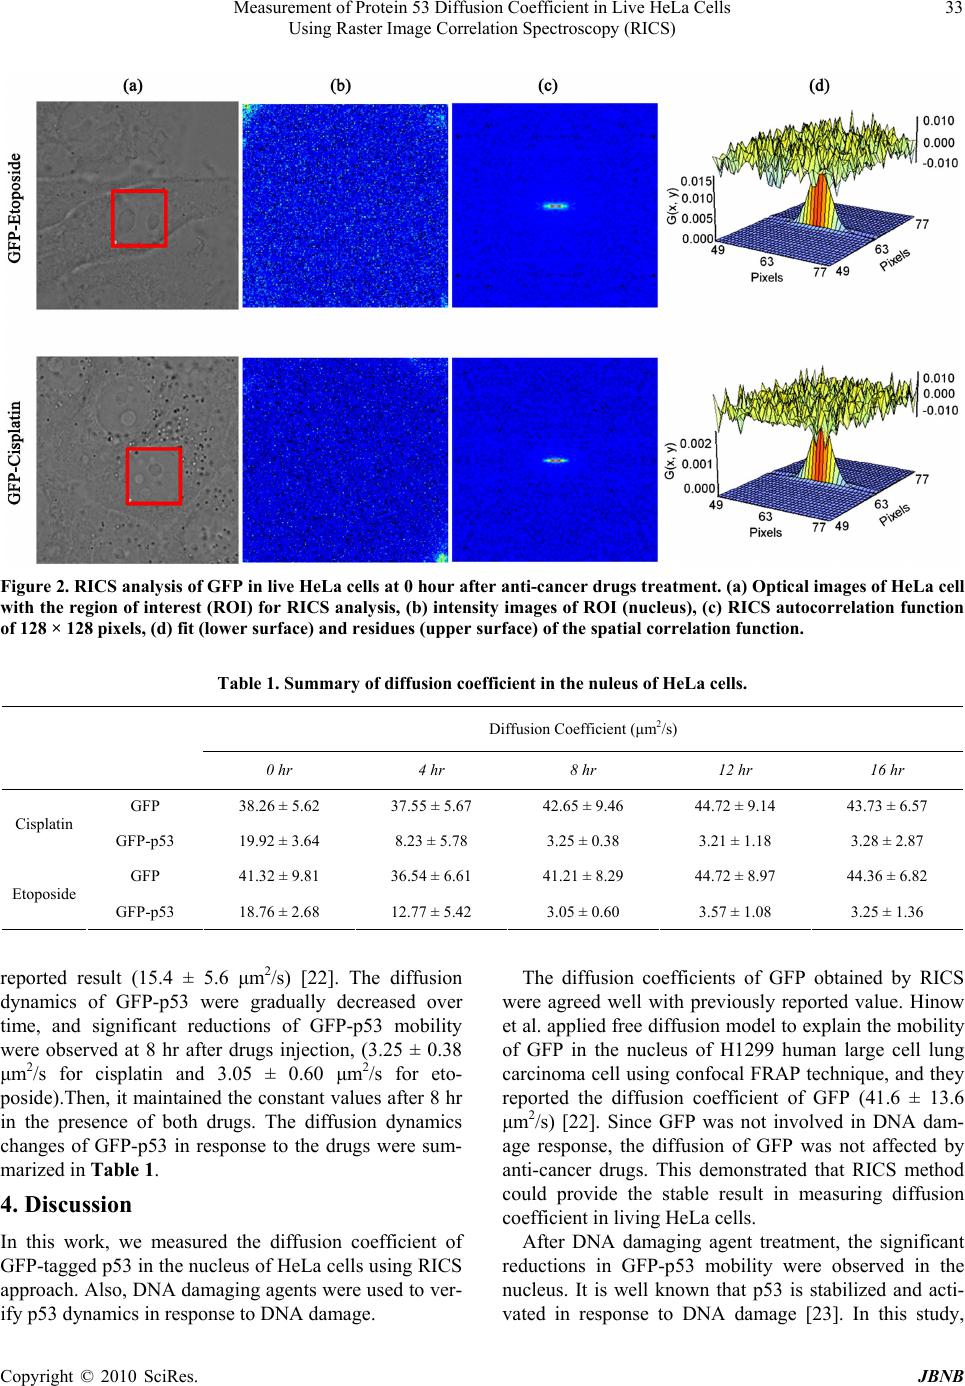 Measurement of Protein 53 Diffusion Coefficient in Live HeLa Cells Using Raster Image Correlation Spectroscopy (RICS) Copyright © 2010 SciRes. JBNB 33 Figure 2. RICS analysis of GFP in live HeLa cells at 0 hour after anti-cancer drugs treatment. (a) Optical images of HeLa cell with the region of interest (ROI) for RICS analysis, (b) intensity images of ROI (nucleus), (c) RICS autocorrelation function of 128 × 128 pixels, (d) fit (lower surface) and residues (upper surface) of the spatial correlation function. Table 1. Summary of diffusion coefficient in the nuleus of HeLa cells. Diffusion Coefficient (μm2/s) 0 hr 4 hr 8 hr 12 hr 16 hr GFP 38.26 ± 5.62 37.55 ± 5.67 42.65 ± 9.46 44.72 ± 9.14 43.73 ± 6.57 Cisplatin GFP-p53 19.92 ± 3.64 8.23 ± 5.78 3.25 ± 0.38 3.21 ± 1.18 3.28 ± 2.87 GFP 41.32 ± 9.81 36.54 ± 6.61 41.21 ± 8.29 44.72 ± 8.97 44.36 ± 6.82 Etoposide GFP-p53 18.76 ± 2.68 12.77 ± 5.42 3.05 ± 0.60 3.57 ± 1.08 3.25 ± 1.36 reported result (15.4 ± 5.6 μm2/s) [22]. The diffusion dynamics of GFP-p53 were gradually decreased over time, and significant reductions of GFP-p53 mobility were observed at 8 hr after drugs injection, (3.25 ± 0.38 μm2/s for cisplatin and 3.05 ± 0.60 μm2/s for eto- poside).Then, it maintained the constant values after 8 hr in the presence of both drugs. The diffusion dynamics changes of GFP-p53 in response to the drugs were sum- marized in Table 1. The diffusion coefficients of GFP obtained by RICS were agreed well with previously reported value. Hinow et al. applied free diffusion model to explain the mobility of GFP in the nucleus of H1299 human large cell lung carcinoma cell using confocal FRAP technique, and they reported the diffusion coefficient of GFP (41.6 ± 13.6 μm2/s) [22]. Since GFP was not involved in DNA dam- age response, the diffusion of GFP was not affected by anti-cancer drugs. This demonstrated that RICS method could provide the stable result in measuring diffusion coefficient in living HeLa cells. 4. Discussion After DNA damaging agent treatment, the significant reductions in GFP-p53 mobility were observed in the nucleus. It is well known that p53 is stabilized and acti- vated in response to DNA damage [23]. In this study, In this work, we measured the diffusion coefficient of GFP-tagged p53 in the nucleus of HeLa cells using RICS approach. Also, DNA damaging agents were used to ver- ify p53 dynamics in response to DNA damage. 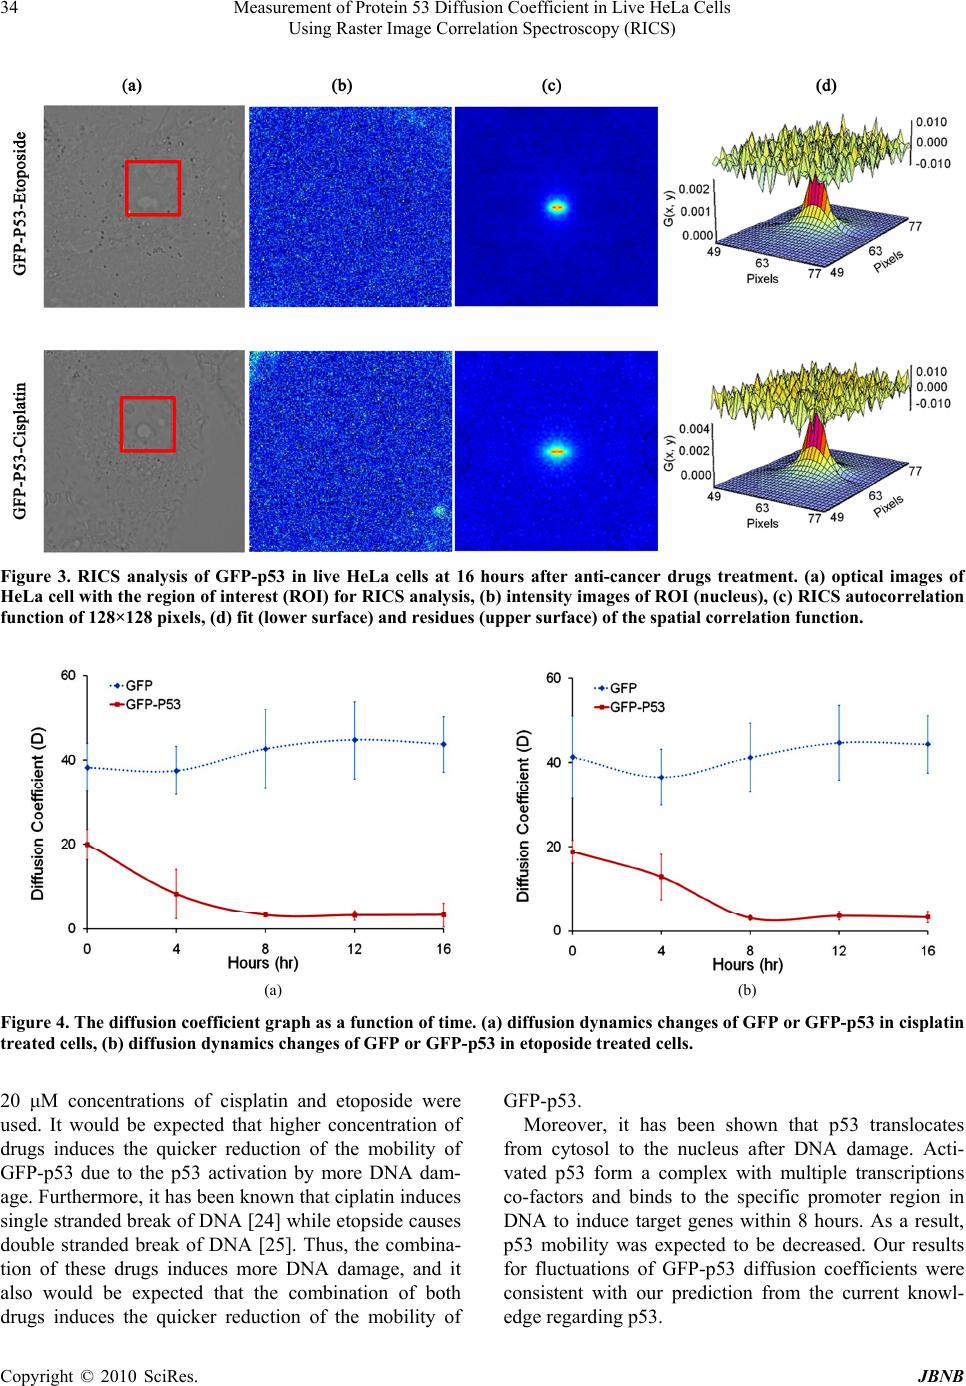 Measurement of Protein 53 Diffusion Coefficient in Live HeLa Cells 34 Using Raster Image Correlation Spectroscopy (RICS) Figure 3. RICS analysis of GFP-p53 in live HeLa cells at 16 hours after anti-cancer drugs treatment. (a) optical images of HeLa cell with the region of interest (ROI) for RICS analysis, (b) intensity images of ROI (nucleus), (c) RICS autocorrelation function of 128×128 pixels, (d) fit (lower surface) and residues (upper surface) of the spatial correlation function. (a) (b) Figure 4. The diffusion coefficient graph as a function of time. (a) diffusion dynamics changes of GFP or GFP-p53 in cisplatin treated cells, (b) diffusion dynamics changes of GFP or GFP-p53 in etoposide treated cells. 20 μM concentrations of cisplatin and etoposide were used. It would be expected that higher concentration of drugs induces the quicker reduction of the mobility of GFP-p53 due to the p53 activation by more DNA dam- age. Furthermore, it has been known that ciplatin induces single stranded break of DNA [24] while etopside causes double stranded break of DNA [25]. Thus, the combina- tion of these drugs induces more DNA damage, and it also would be expected that the combination of both drugs induces the quicker reduction of the mobility of GFP-p53. Moreover, it has been shown that p53 translocates from cytosol to the nucleus after DNA damage. Acti- vated p53 form a complex with multiple transcriptions co-factors and binds to the specific promoter region in DNA to induce target genes within 8 hours. As a result, p53 mobility was expected to be decreased. Our results for fluctuations of GFP-p53 diffusion coefficients were consistent with our prediction from the current knowl- edge regarding p53. Copyright © 2010 SciRes. JBNB  Measurement of Protein 53 Diffusion Coefficient in Live HeLa Cells 35 Using Raster Image Correlation Spectroscopy (RICS) 5. Conclusions In conclusion, we have successfully measured the diffu- sion coefficients of GFP-p53 in living HeLa cells sub- jected to DNA damage agents by using commercial con- focal microscope to RICS analysis method. RICS is able to measure protein diffusion in live cells using regular confocal microscope and require relatively short period of time. Therefore, it may be applied to a large-scale, high throughput drug screening based on the activation or inactivation of tumor suppressors or oncogene prod- ucts in the future. 6. Acknowledgements This project has been supported by the CMUH Cancer Research Center of Excellence DOH 99-7D-C-111-005, Taiwan, Institute of Basic Science, China Medical Uni- versity and Hospital/M. D. Anderson Cancer Center Sis- ter Institution Fund, CCSG CA16672, NIH R 01 CA109311, NIH PO1 099031, and US Army Department Breast Cancer Research Program W81XWH-08-1-0649- 01 to M.-C.H.; NIH R21 CA135318-01A1 and US Army Department Breast Cancer Research Program W81XWH-08-1-0644 to J.K. The use of the Micr- soscopy and Imaging Center facility at Texas A & M University is acknowledged. The Olympus FV1000 con- focal microscope acquisition was supported by the Office of the Vice President for Research at Texas A & M Uni- versity. REFERENCES [1] Y. Wu, Q. Li and X.-Z. Chen, “Detecting Protein-Protein Interactions by Far Western Blotting,” Nature Protocols, Vol. 2, No. 12, 2007, pp. 3278-3284. [2] P. Yaciuk, “Co-Immunoprecipitation of Protein Com-plexes,” Methods in Molecular Medicine, Vol. 131, 2007, pp. 103-111. [3] D. Figeys, L. D. McBroom and M. F. Moran, “Mass Spectrometry for the Study of Protein-Protein In- terac-tions,” Methods, Vol. 24, No. 3, 2001, pp. 230-239. [4] M. Gaudreault, M.-E. Gingras, M. Lessard, S. Leclerc and S. L. Guérin, “Electrophoretic Mobility Shift Assays for the Analysis of DNA–Protein Interactions,” Methods in Molecular Biology, Vol. 543, 2009, pp. 15-35. [5] B. G. Hoffman and S. J. M. Jones, “Genome-Wide Iden- tification of DNA-protein Interactions Using Chromatin Immunoprecipitation Coupled with Flow Cell Sequenc- ing,” Journal of Endocrinol, Vol. 201, No. 1, 2009, pp. 1-13. [6] K. Jaqaman, D. Loerke, M. Mettlen, H. Kuwata, S. Grin-stein, S. L. Schmid, et al., “Robust Single-Particle Tracking in Live-cell Time-lapse Sequences,” Nature Methods, Vol. 5, No. 8, 2008, 695-702. [7] D. Axelrod, D. E. Koppel, J. Schlessinger, E. Elson and W. W. Webb, “Mobility Measurement by Analysis of Fluorescence Photobleaching Recovery Kinetics,” Bio- physical Journal, Vol. 16, No. 9, 1976, pp. 1055-1069. [8] P. Roy, Z. Rajfur, P. Pomorski and K. Jacobson, “Micro- scope-based Techniques to Study Cell Adhesion and Mi- gration,” Nature Cell Biology, Vol. 4, No. 4, 2002, pp. E91-E96. [9] I. A. Demarco, A. Periasamy, C. F. Booker and R. N. Day, “Monitoring Dynamic Protein Interactions with Photoquenching FRET,” Nature Methods, Vol. 3, No. 7, 2006, pp. 519-524. [10] M. A. Digman, P. Sengupta, P. W. Wiseman, C. M. Brown, A. R. Horwitz and E. Gratton, “Fluctuation Cor- relation Spectroscopy with a Laser-Scanning Microscope: Exploiting the Hidden Time Structure,” Biophysical Journal, Vol. 88, No. 5, 2005, pp. L33-L36. [11] M. A. Digman, C. M. Brown, P. Sengupta, P. W. Wise-man, A. R. Horwitz and E. Gratton, “Measuring Fast Dynamics in Solutions and Cells with a Laser Scan- ning Microscope,” Biophysical Journal, Vol. 89, No. 2, 2005, pp, 1317-1327. [12] C. M. Brown, R. B. Dalal, B. Hebert, M. A. Digman, A. R. Horwitz and E. Gratton, “Raster Image Correlation Spectroscopy (RICS) for Measuring Fast Protein Dy- namics and Concentrations with a Commercial Laser Scanning Confocal Microscope,” Journal of Microscopy, Vol. 229, No. 1, 2008, pp. 78-91. [13] M. A. Digman and E. Gratton, “Analysis of Diffusion and Binding in Cells Using the RICS Approach,” Microscopy Research and Technique, Vol. 72, No. 4, 2009, pp. 323- 332. [14] [14] K. M. Ryan, A. C. Phillips and K. H. Vousden, “Regulation and Function of the p53 Tumor Suppressor Protein,” Current Opinion in Cell Biology, Vol. 13, No. 3, 2001, pp. 332-337. [15] A. M. Bode and Z. Dong, “Post-Translational Modifica- tion of p53 in Tumorigenesis,” Nature Reviews Cancer, Vol. 4, No. 10, 2004, pp. 793-805. [16] O. Laptenko and C. Prives, “Transcriptional Regulation by p53: One Protein, Many Possibilities,” Cell Death & Differentiation, Vol. 13, No. 6, 2006, pp. 951-961. [17] J. K. Sax and W. S. El-Deiry, “p53 Downstream Targets and Chemosensitivity,” Cell Death & Differentiation, Vol. 10, No. 4, pp. 413-417. [18] M. Jiang, X. Yi, S. Hsu, C.-Y. Wang and Z. Dong, “Role of p53 in Cisplatin-induced Tubular Cell Apoptosis: De- pendence on p53 Transcriptional Activity,” American Journal of Physiology Renal Physiology, Vol. 287, No. 6, 2004, pp. F1140-1147. [19] P. J. Smith, (1990), “DNA Topoisomerase Dysfunction: A New Goal for Antitumor Chemotherapy,” BioEssays, Vol. 12, No. 4, pp. 167-172. [20] H. Yamaguchi, N. T. Woods, L. G. Piluso, H.-H. Lee, J. Chen, K. N. Bhalla, et al., “p53 Acetylation Is Crucial for Its Transcription-Independent Proapoptotic Functions,” Copyright © 2010 SciRes. JBNB  Measurement of Protein 53 Diffusion Coefficient in Live HeLa Cells Using Raster Image Correlation Spectroscopy (RICS) Copyright © 2010 SciRes. JBNB 36 Journal of Biological Chemistry, Vol. 284, No. 17, 2009, 11171-11183. [21] J. Beechem, E. Gratton, M. Ameloot, J. Knutson and L. Brand, “The Global Analysis of Fluorescence Intensity and Anisotropy Decay Data: Second-Generation Theory and Programs,” Topics in Fluorescence Spectroscopy, Vol. 2, 2002, pp. 241-305. [22] P. Hinow, C. E. Rogers, C. E. Barbieri, J. A. Pietenpol, A. K. Kenworthy and E. DiBenedetto, “The DNA Binding Activity of p53 Displays Reaction-Diffusion Kinetics,” Biophysical Journal, Vol. 91, No. 1, 2006, pp. 330-342. [23] D. P. Lane, “p53, Guardian of the Genome,” Nature, Vol. 358, No. 6381, 1992, pp. 15-16. [24] L. Yen, N. Zeng-Rong, X.-L. You, S. Richard, B. C. Langton-Webster and M. A. Alaoui-Jamali, “Regulation of Cellular Response to Cisplatin-induced DNA Damage and DNA Repair in Cells Overexpressing p185erbB-2 is Dependent on the Ras Signaling pathway,” Oncogene, Vol. 14, No. 15, 1997, pp. 1827-1835. [25] S. A. S. Walles, R. Zhou and E. Liliemark, “DNA Dam- age Induced by Etoposide; A Comparison of Two Dif- ferent Methods for Determination of Strand Breaks in DNA,” Cancer Letters, Vol. 105, No. 2, 1996, pp. 153- 159. |