Journal of Electromagnetic Analysis and Applications
Vol.4 No.8(2012), Article ID:21532,7 pages DOI:10.4236/jemaa.2012.48046
Measurement and Analysis of Extremely Low Frequency Electromagnetic Field Exposure in Oman
![]()
Department of Electrical & Computer Engineering, College of Engineering, Sultan Qaboos University, Muscat, Oman.
Email: albadi@squ.edu.om
Received June 20th, 2012; revised July 17th, 2012; accepted July 27th, 2012
Keywords: Electromagnetic Fields; Field Measurements; Exposure Limits; ICNIRP
ABSTRACT
Concern about the possible health effects from exposure to Extremely Low Frequency (ELF) electromagnetic fields is increasing worldwide. This paper presents analyses of measurements of low frequency magnetic and electric fields caused by conductors carrying current in the Oman electric power system. Measurements were taken during the summer period at around 3 PM to capture peak loads. Field measurements were from several high voltage environments which include different types of electricity infrastructure comprising overhead lines, underground cables and substations. The measured values were compared to the International Commission on Non-Ionizing Radiation Protection (ICNIRP) standards for both general public and occupational exposure. All the Oman values of electric and magnetic fields are lower than the recommended values provided by ICNIRP.
1. Introduction
Electric and magnetic fields are generated from electric overhead transmission lines and all electric installations and appliances. Owing to their widespread use nowadays, people are being exposed in all places and times. Epidemiological studies have indicated a statistical association between childhood leukemia and long-term exposure to magnetic fields [1,2] resulting in an increasing concern about them. Subsequently, studies of workers in electric utilities and workers exposed to radiation from cathode ray tubes (such as computer monitors) were unable to verify the original conclusion [3]. Laboratory studies rodents to determine the biological effects of low-frequency magnetic fields also produced conflicting results, and, since no studies had been performed on humans, this topic is still debatable [4].
To protect people against the adverse effect of electrical and magnetic fields, several international commissions have reviewed the biological effects of exposure to low frequency electromagnetic fields and formulated recommendations for exposure limits. These groups include the Advisory Group on Non-Ionizing Radiation of the UK’s National Radiological Protection Board (AGNIR) [5], Institute of Electrical and Electronics Engineers (IEEE) [6], the International Agency for Research on Cancer (IARC) [7], the International Commission on Non-Ionizing Radiation Protection (ICNIRP) [8], and the World Health Organization (WHO) [9].
Levels of electromagnetic fields in Oman, are expected to increase in the future owing to the growth in the power demand which will require transmitting electric power at higher voltage and current levels compared with the present levels. The maximum power demand in the main interconnected system (MIS) in Oman is expected to grow from 3613 MW in 2010 to 6043 MW by 2016, an average increase of around 8.5% or 374 MW per year [10]. Currently, the system interconnects seven main power plants with around 3726 MW of net generation capacity and transmits power over 220 kV and 132 kV lines. The residential sector is the largest consumer category taking more than half of the total system energy [11]. The annual demand curve reflects the climate in Oman and is highly seasonal. The average summer demand is more than double of the average winter demand, owing to the increase in residential demand during the hot weather in summer. The demand peaks typically in June reflecting the highest temperatures and intensive use of air-conditioning.
2. Electromagnetic Fields
In the environment surrounding any conductor carrying electric current, there exists an electric field and a magnetic field, together referred to as electromagnetic fields. These fields often extend for considerable distances around the conductor.
2.1. Electromagnetic Spectrum
Non-ionization radiation is referred to as radiation that has enough energy to move atoms in a molecule around or cause them to vibrate, but not enough to remove electrons. Examples of this kind of radiation are radio frequency, visible light, and microwaves. Ionization radiation is referred to a radiation range that has enough energy to remove tightly bound electrons from atoms, thus creating ions. Examples of this kind of radiation are Xrays and Gamma rays [12].
Electromagnetic waves cover a wide range of frequencies and wavelengths, which is called the electromagnetic spectrum and comprises ionizing, optical and non-ionizing radiations. The non-ionizing radiation is further subdivided into static fields (0 Hz), extremely low frequency fields (ELF), intermediate frequency fields (IF), and radio frequency fields and microwaves (RF) as shown in Table 1 [2].
2.2. Magnetic Fields
Magnetic fields are defined in terms of the force exerted on a moving unit charge and thus are proportional to the flow of electric current, irrespective of system voltage [13]. Magnetic fields induce currents in the body, which are greatest near the body’s periphery and smallest at its center. There are several factors that affect the level of magnetic field produced by overhead transmission lines: the arrangement of transmission lines, the amount of current flow though the lines, the height of conductors from the ground, the balance between phases, and the presence of earth conductor [14-19]. It should be noted that higher voltage lines usually carry higher currents and have larger spacing between conductors. Therefore, they produce higher magnetic field, even though the magnetic field does not depend on the voltage level.
2.3. Electric Fields
The electric field describes the force exerted on a unit electric charge, thus the field is produced by electric charges irrespective of their state of motion and is related to the system voltage and not to current level [13]. Electric fields from nearby power lines and appliances induce
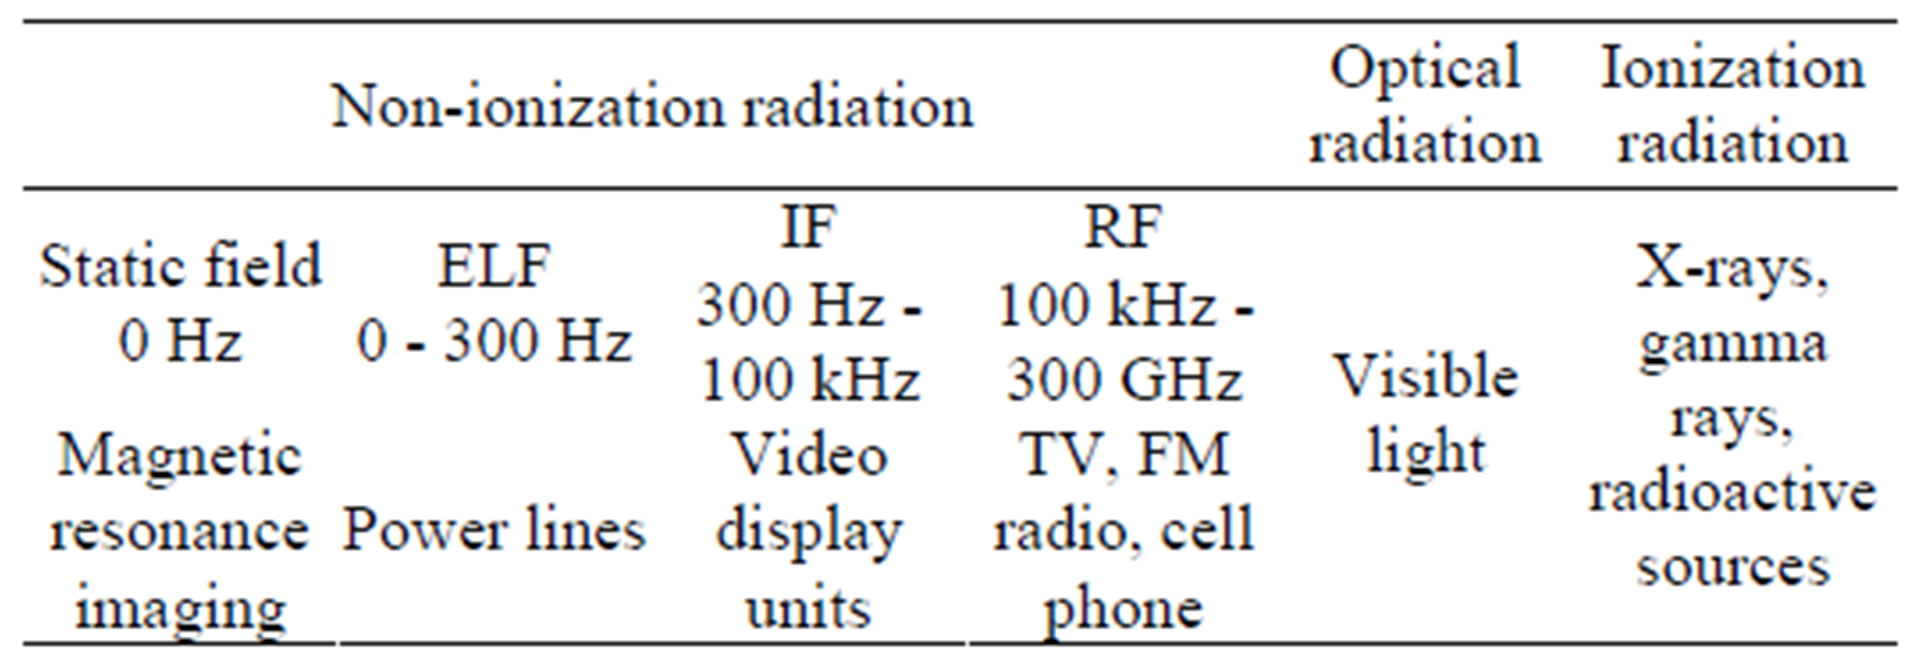
Table 1. Electromagnetic spectrum.
currents in the body as well as charges on the body’s surface. This is because the charge on power lines alternates from positive to negative many times per second. The strength of an electric field near a power line depends on the voltage of the line, the distance between the power line to point of measurement, the arrangement of power lines, the radius of current carrying conductors, and the balance of the phases [14,15].
2.4. Shielding of Fields
Electric fields are easily perturbed by materials with a high relative permittivity and even more significantly by conducting objects [13]. Electric fields can be shielded by any structure such as buildings, fences or even trees, thus attenuating the values from nearby power lines. Magnetic fields are perturbed by materials that have a very high relative permeability. Magnetic fields are shielded by structures containing large amounts of magnetic materials such as iron and its alloys.
3. Standards
Different standards that define the maximum permissible exposure levels for electromagnetic exist as for example by those from ICNIRP [7] and IEEE [5].
3.1. International Commission on Non-Ionizing Radiation Protection (ICNIRP)
ICNIRP is an international commission of scientific experts in the area of biological and health effects of electric and magnetic fields [7]. The main objective of this standard is to establish guidelines for limiting exposure to electric and magnetic fields that will provide protection against all established adverse effects. Guidance is given for two categories: occupational and general public exposures. Occupational exposure refers to adults exposed to electromagnetic fields at their workplace, generally under known conditions. General public exposure refers to individuals of all ages and of varying health status, who are unaware of their exposure to fields. Table 2 presents the relevant ICNIRP reference levels for 50 Hz.
3.2. IEEE
The purpose of the IEEE standard is to define an exposure levels to protect against adverse effects from exposure to electromagnetic fields from 0 - 3 kHz [5]. The standard was developed with respect to established mechanisms of the
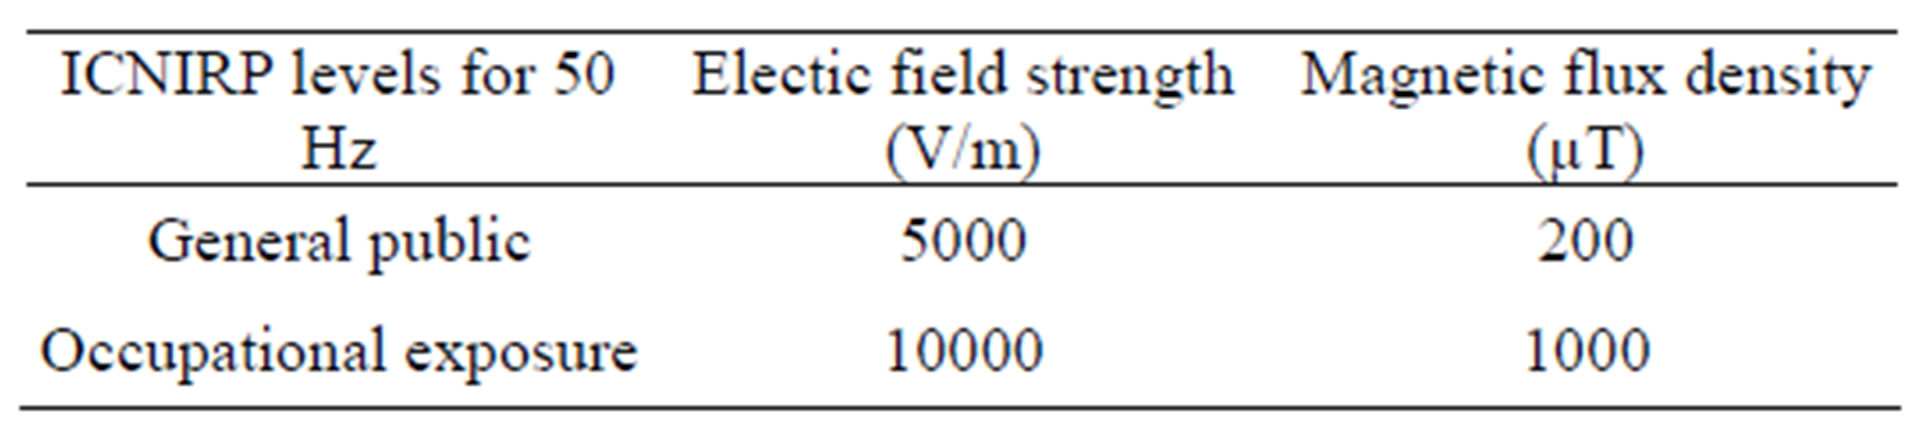
Table 2. ICNIRP standards.
biological effects in humans from electric and magnetic field exposures. For 50 Hz the maximum permissible exposures are as follows:
Ÿ Magnetic field: 904 µT (head and torso), 75,800 µT (arms and legs);
Ÿ Electric field: 5 kV/m to 10 kV/m.
It is obvious that the IEEE limit for magnetic fields are much higher than ICNIRP’s reference value.
3.3. Other Standards
Scientists of the International Electromagnetic Fields Alliance (IEMFA), recommend reduced exposure limits for electromagnetic radiation from power lines and telecommunications technologies [20]. They recommend that global governments should adopt lower exposure guidelines to protect current public health and that of future generations. The new recommended value is 0.1 µT which is approximately 1000 - 10,000 times lower than the current ICNIRP/IEEE standards [20,21]. They conclude that the ICNIRP/IEEE public safety limits are inadequate and obsolete with respect to the prolonged, low intensity exposures that are common today.
4. Measurement Results
All measurements were taken at 1 m height above ground level using calibrated EMDEX II 50 Hz Electric Field Probe for the electric field measurement and EMDEX II 50 Hz magnetic field meter for magnetic field measurement.
The specified profiles used by KEMA were followed during the measurement [22,23]. The reference values chosen for these measurements are the values recommended by (ICNIRP) [7], as shown in Table 2. The measured values for the electric and magnetic fields strength were compared to the ICNIRP standards for both General Public exposure (for locations accessible by public) and Occupational exposure (operational location where no public access is allowed).
4.1. Measurements near Grid Station
There are several source of electromagnetic fields exist at the grid station. They consist of double circuit overhead transmission lines, transformers, cables and capacitor banks. Several profiles were taken inside the grid station, near the walls, transformers, and capacitor banks. A schematic overview is presented in Figure 1. The maximum measured value of the magnetic field near the borders of the grid station was 3.5 µT along Profile 1, as presented in Figure 2. The maximum measured value inside the grid station (excluding the control rooms) was 8 µT along Profile 2 near transformers, as shown in Figure 3. The maximum measured value inside the control room (Profile 3) was 7.5 µT, whereas the maximum measured value exceeds 180 µT inside the large control room along Profile 4 (Figure 4). This can be explained by the fact that very high current was flowing through the busbar inside the large control room.
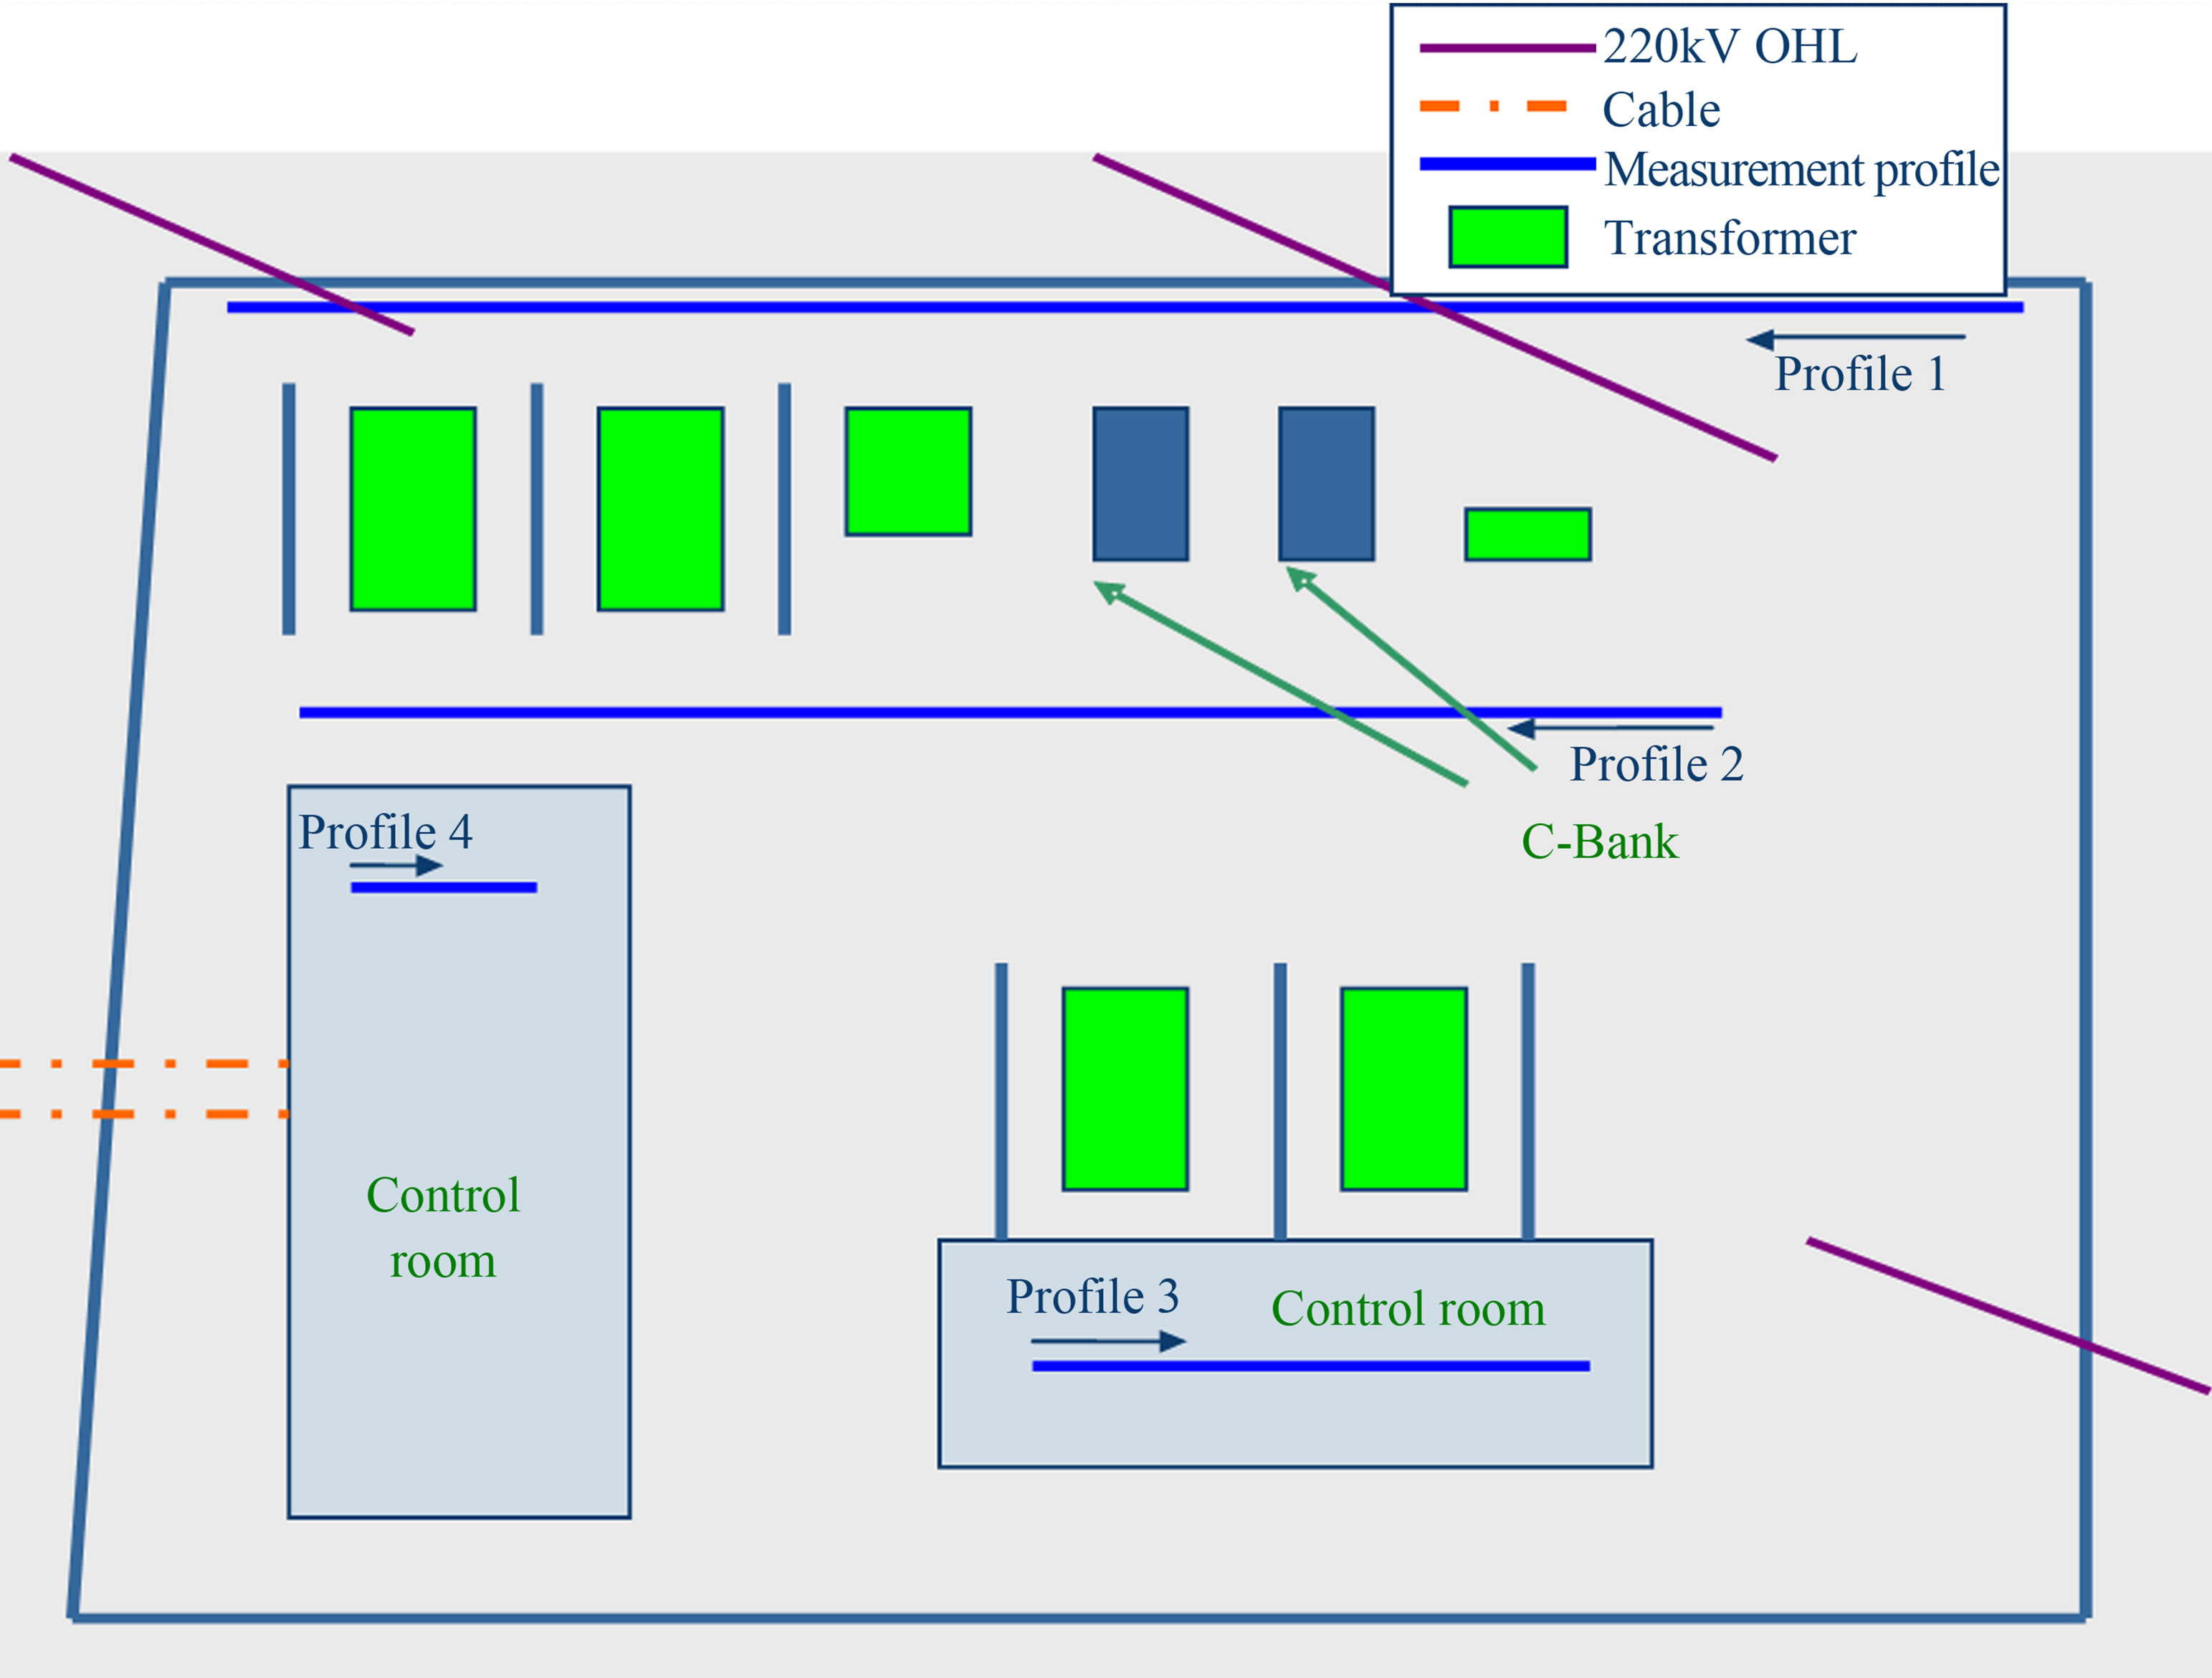
Figure 1. Schematic overview of grid station.

Figure 2. Profile 1, magnetic field.
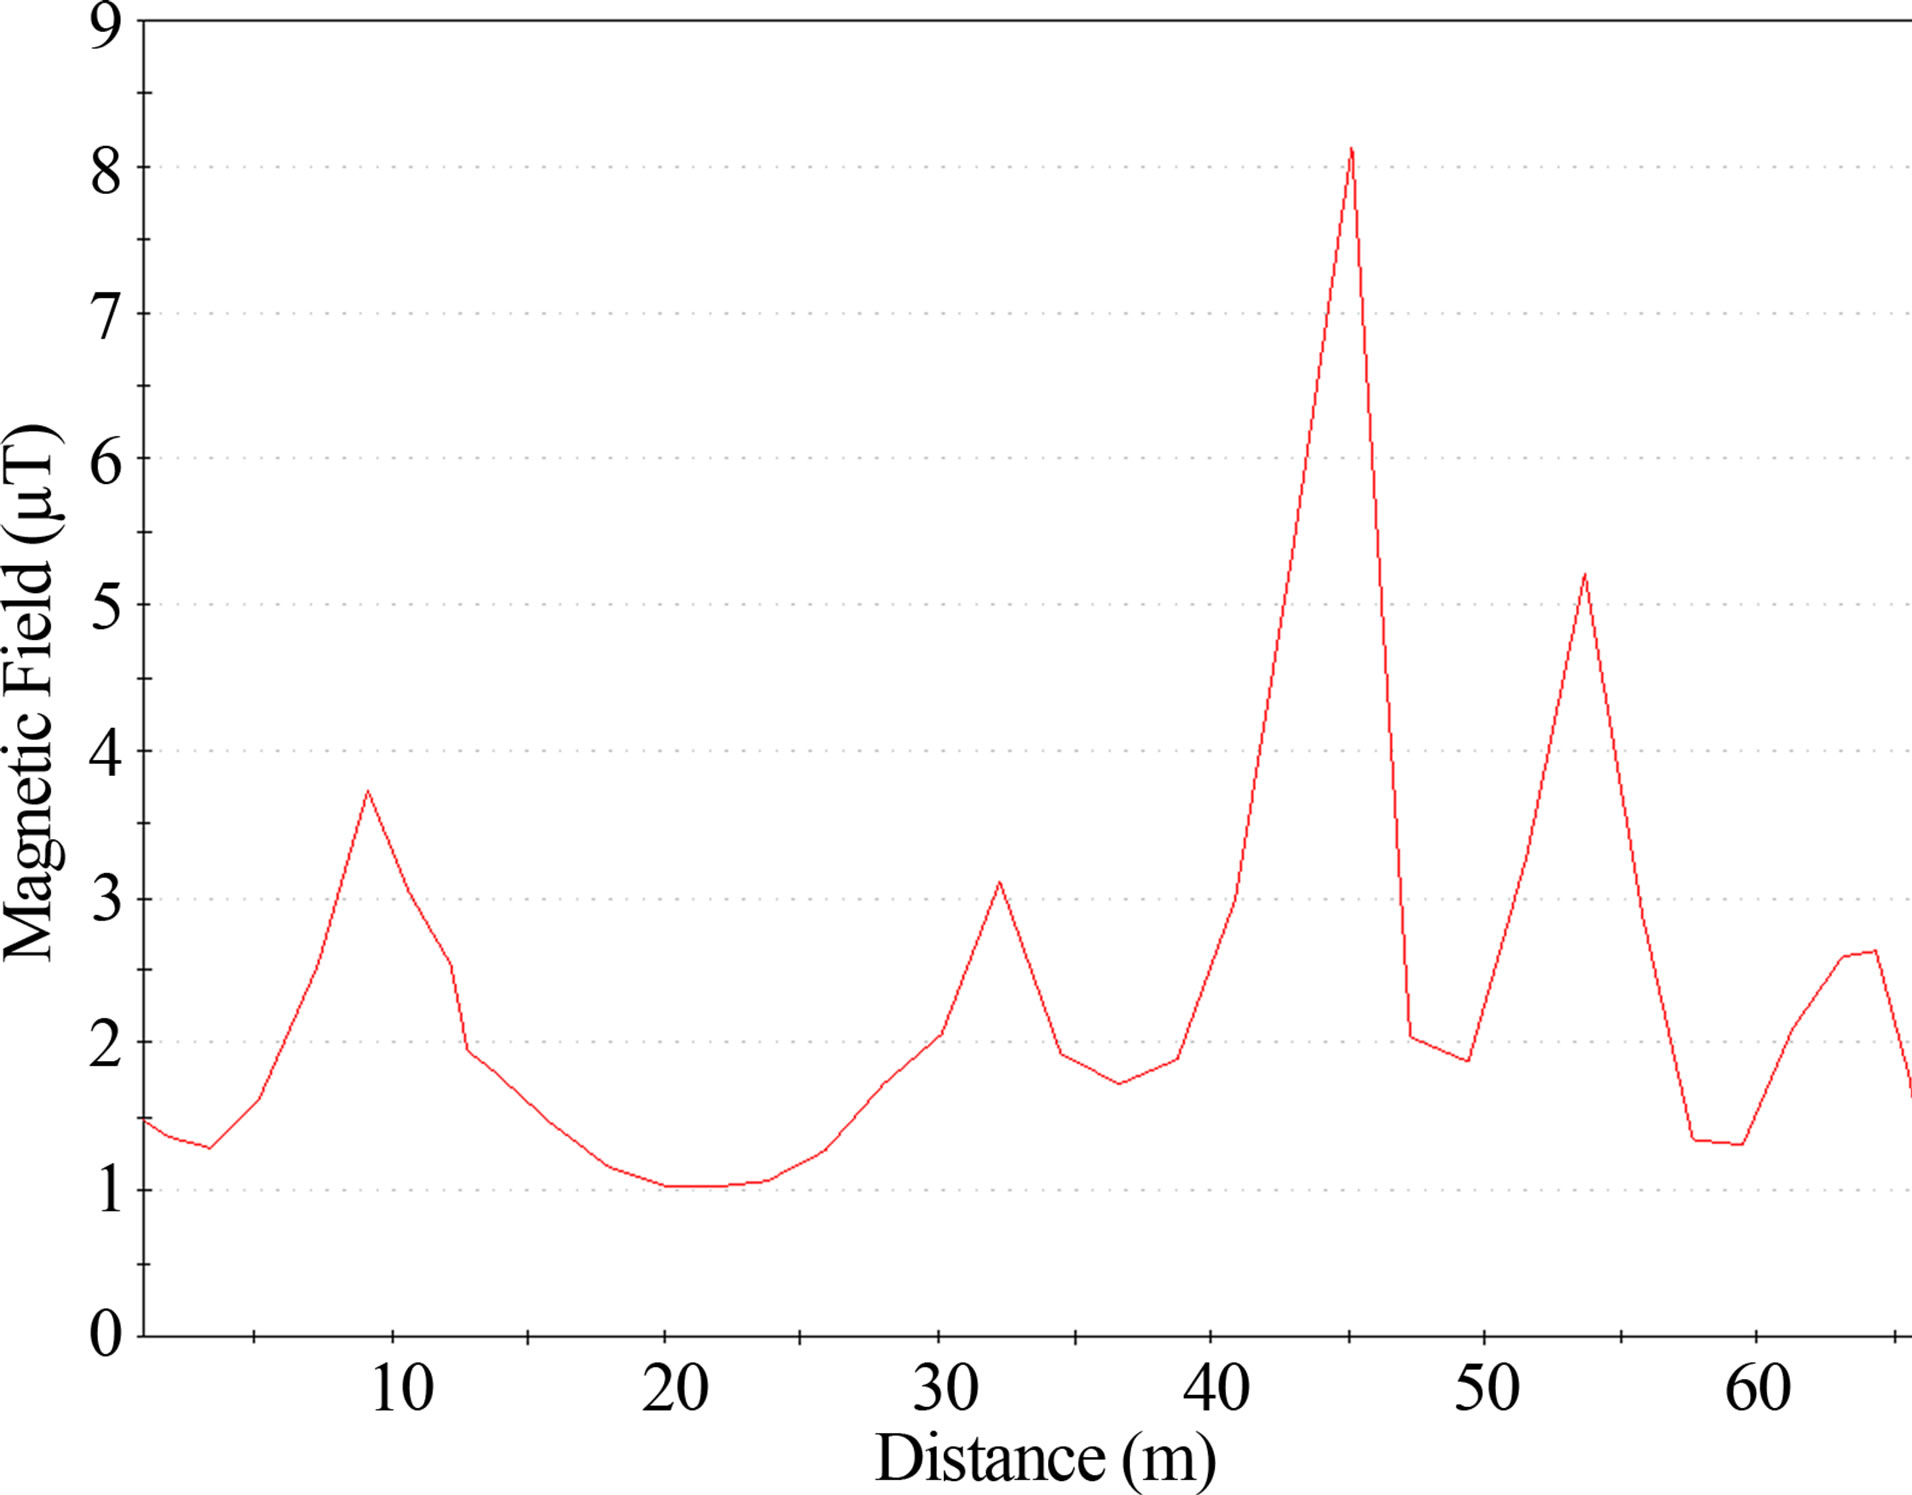
Figure 3. Profile 2, magnetic field.
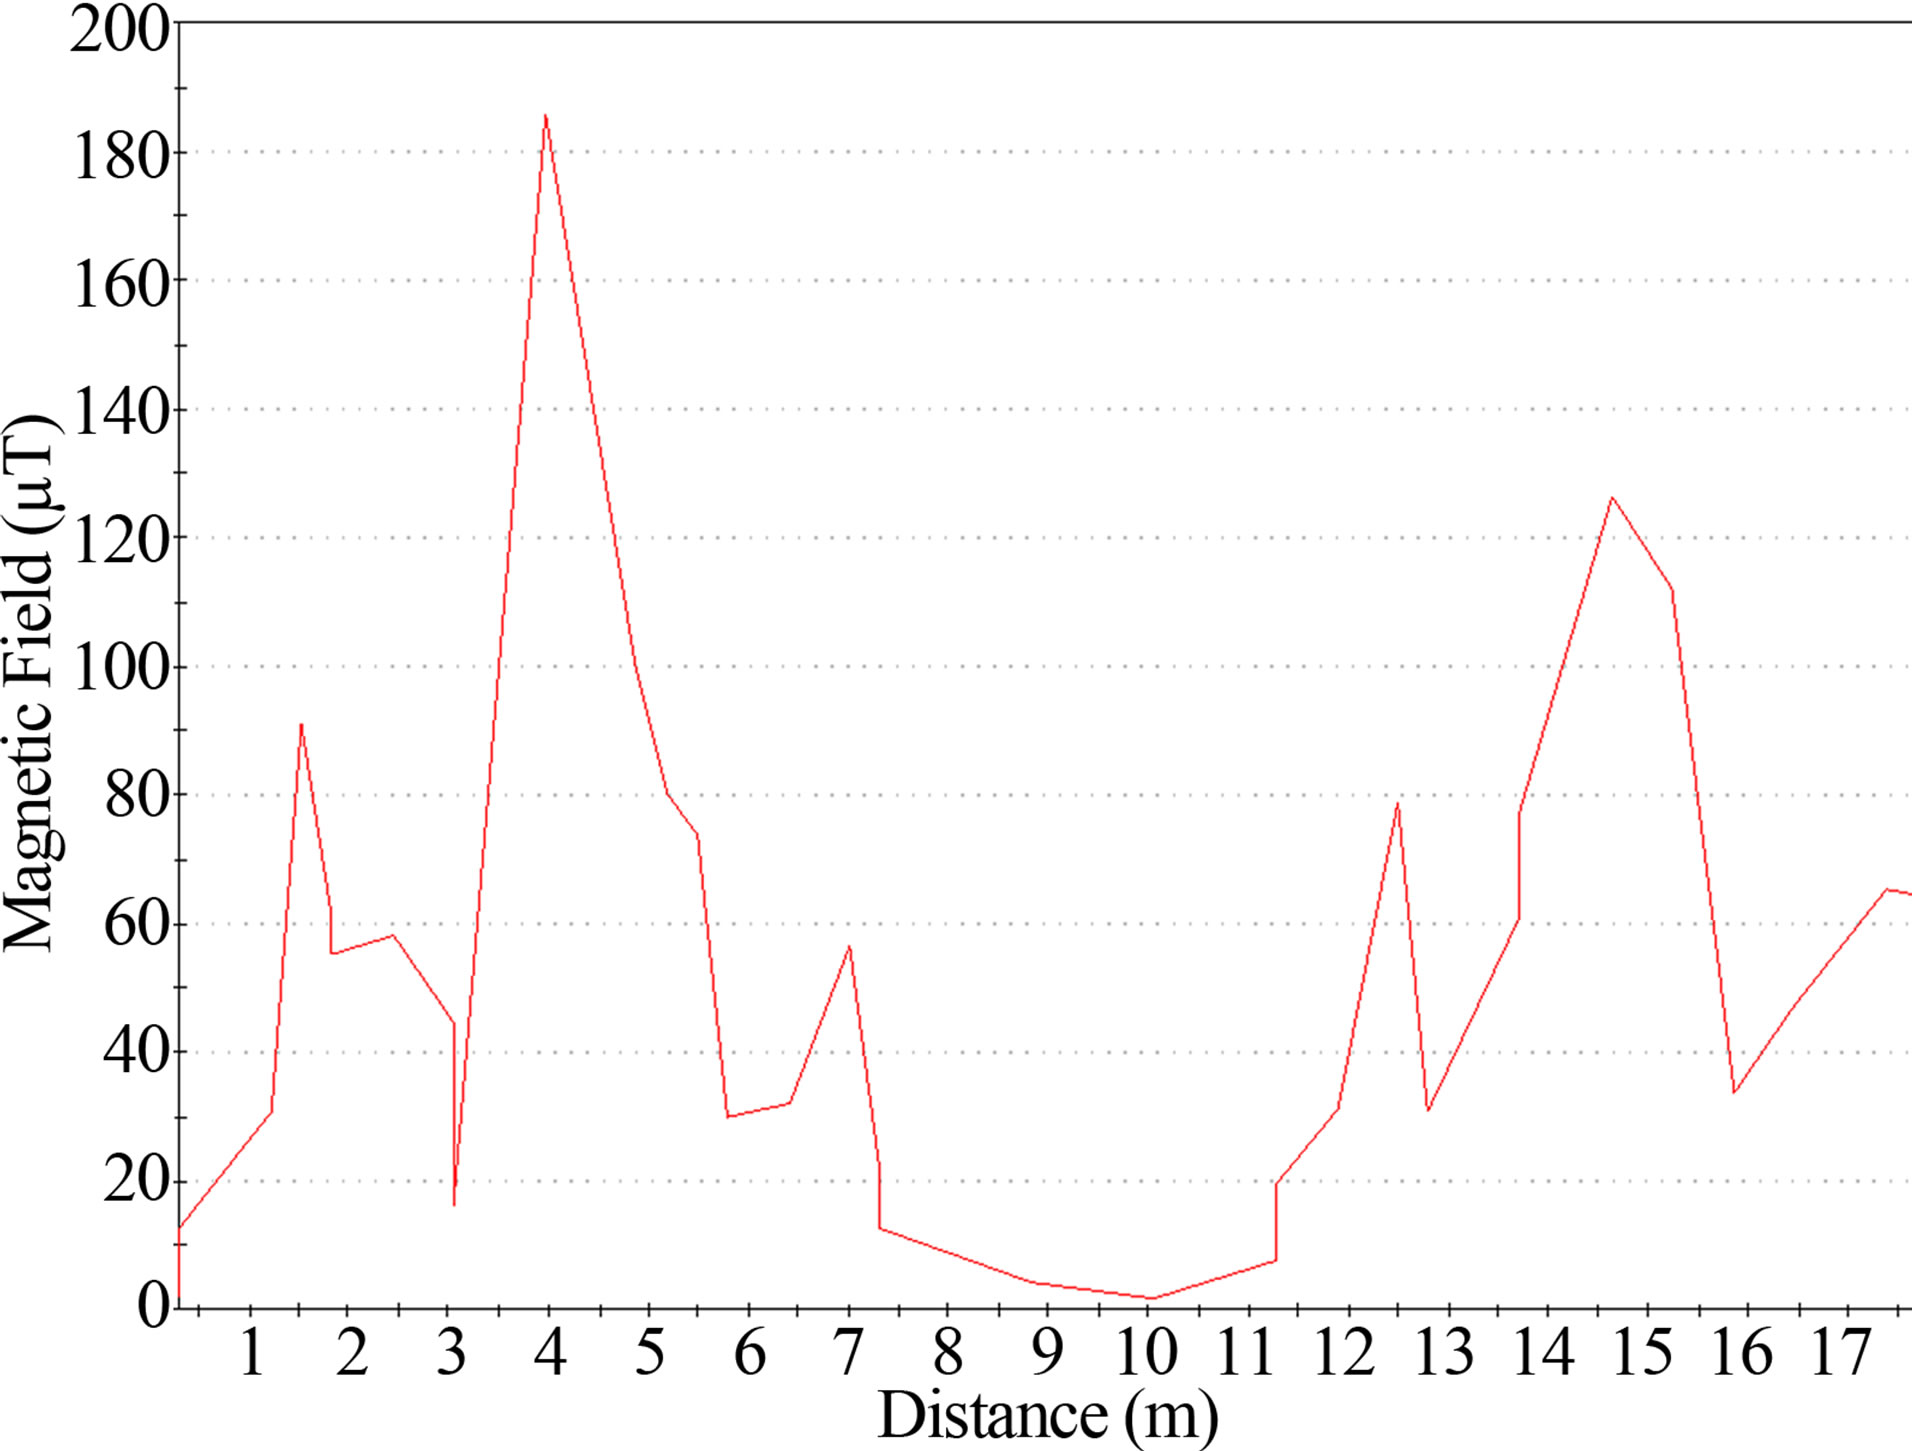
Figure 4. Profile 4, magnetic field.
4.2. Measurements near 132 kV and 33 kV Overhead Lines
This location contains three 132 kV and one 33 kV overhead transmission lines (OHTLs) as shown in the schematic diagram in Figure 5. The maximum measured value of the magnetic field along Profile 1, which is perpendicular to OHTLs, as presented in Figure 6, is 4.5 µT. This value was measured almost underneath the middle of 132 kV OHTL. Along Profile 2, the measurement is almost constant with an average of 0.21 µT because the profile was taken in parallel with OHTLs. The maximum value near the office was 0.2 µT. The maximum measured values of the electric field along Profile 1 are 0.94 kV/m, 0.48 kV/m and 0.42 kV/m, as shown in Figure 7. These values were respectively measured underneath the 132 kV OHTLs. The maximum value of the electric field along Profile 2 was 0.13 kV/m which was near the office.
4.3. Measurements near 220 kV Overhead Transmission Lines
The source of the fields in this case is only double circuit 220 kV OHTLs. The starting point of the profile was taken in the middle of the two towers. The maximum measured value of electric field was 2.7 kV/m and it was recorded underneath the 220 kV OHTLs. The value of
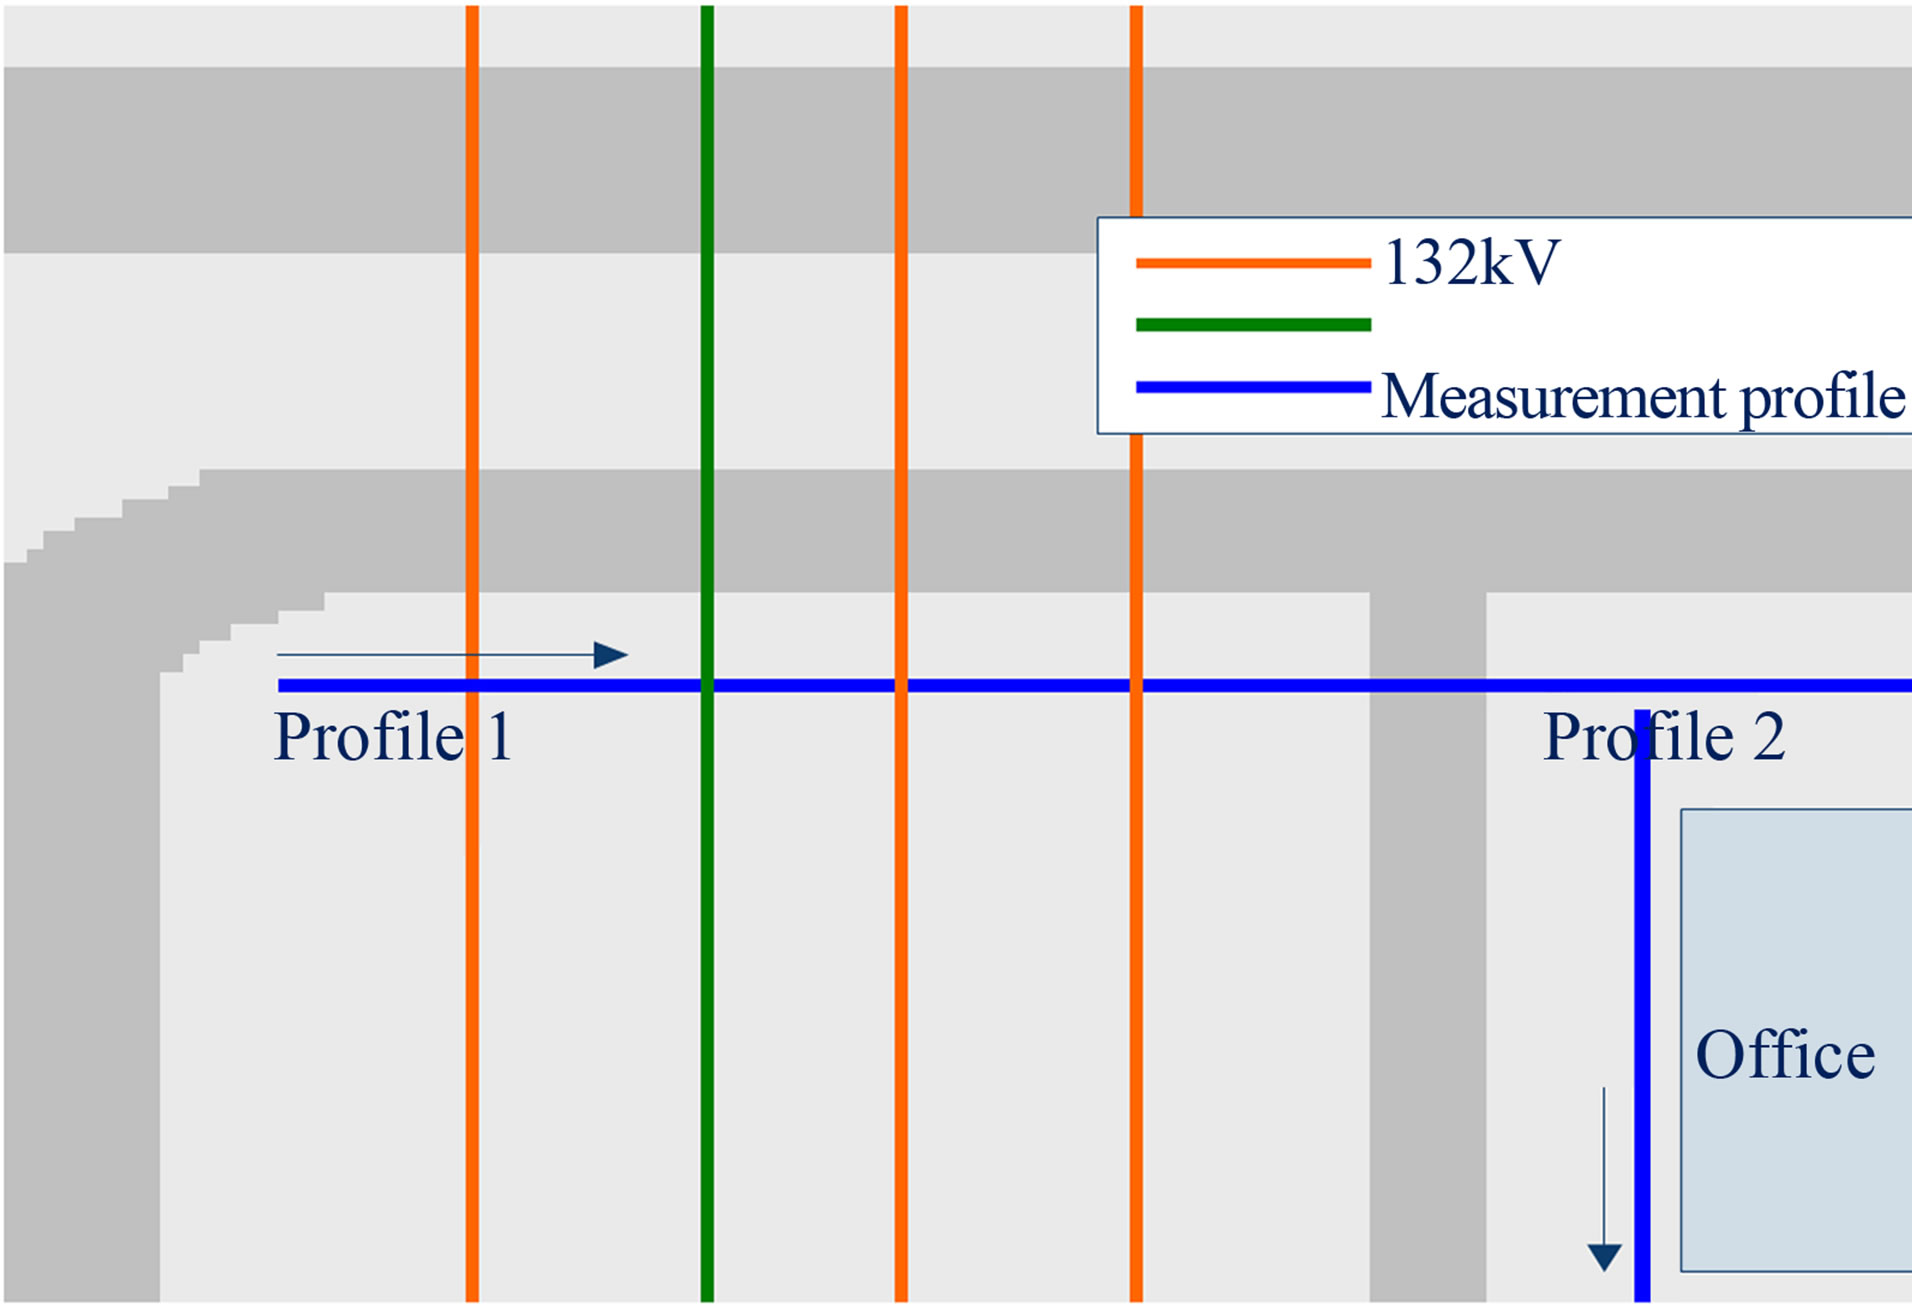
Figure 5. Schematic overview of 132 kV and 33 kV overhead lines.
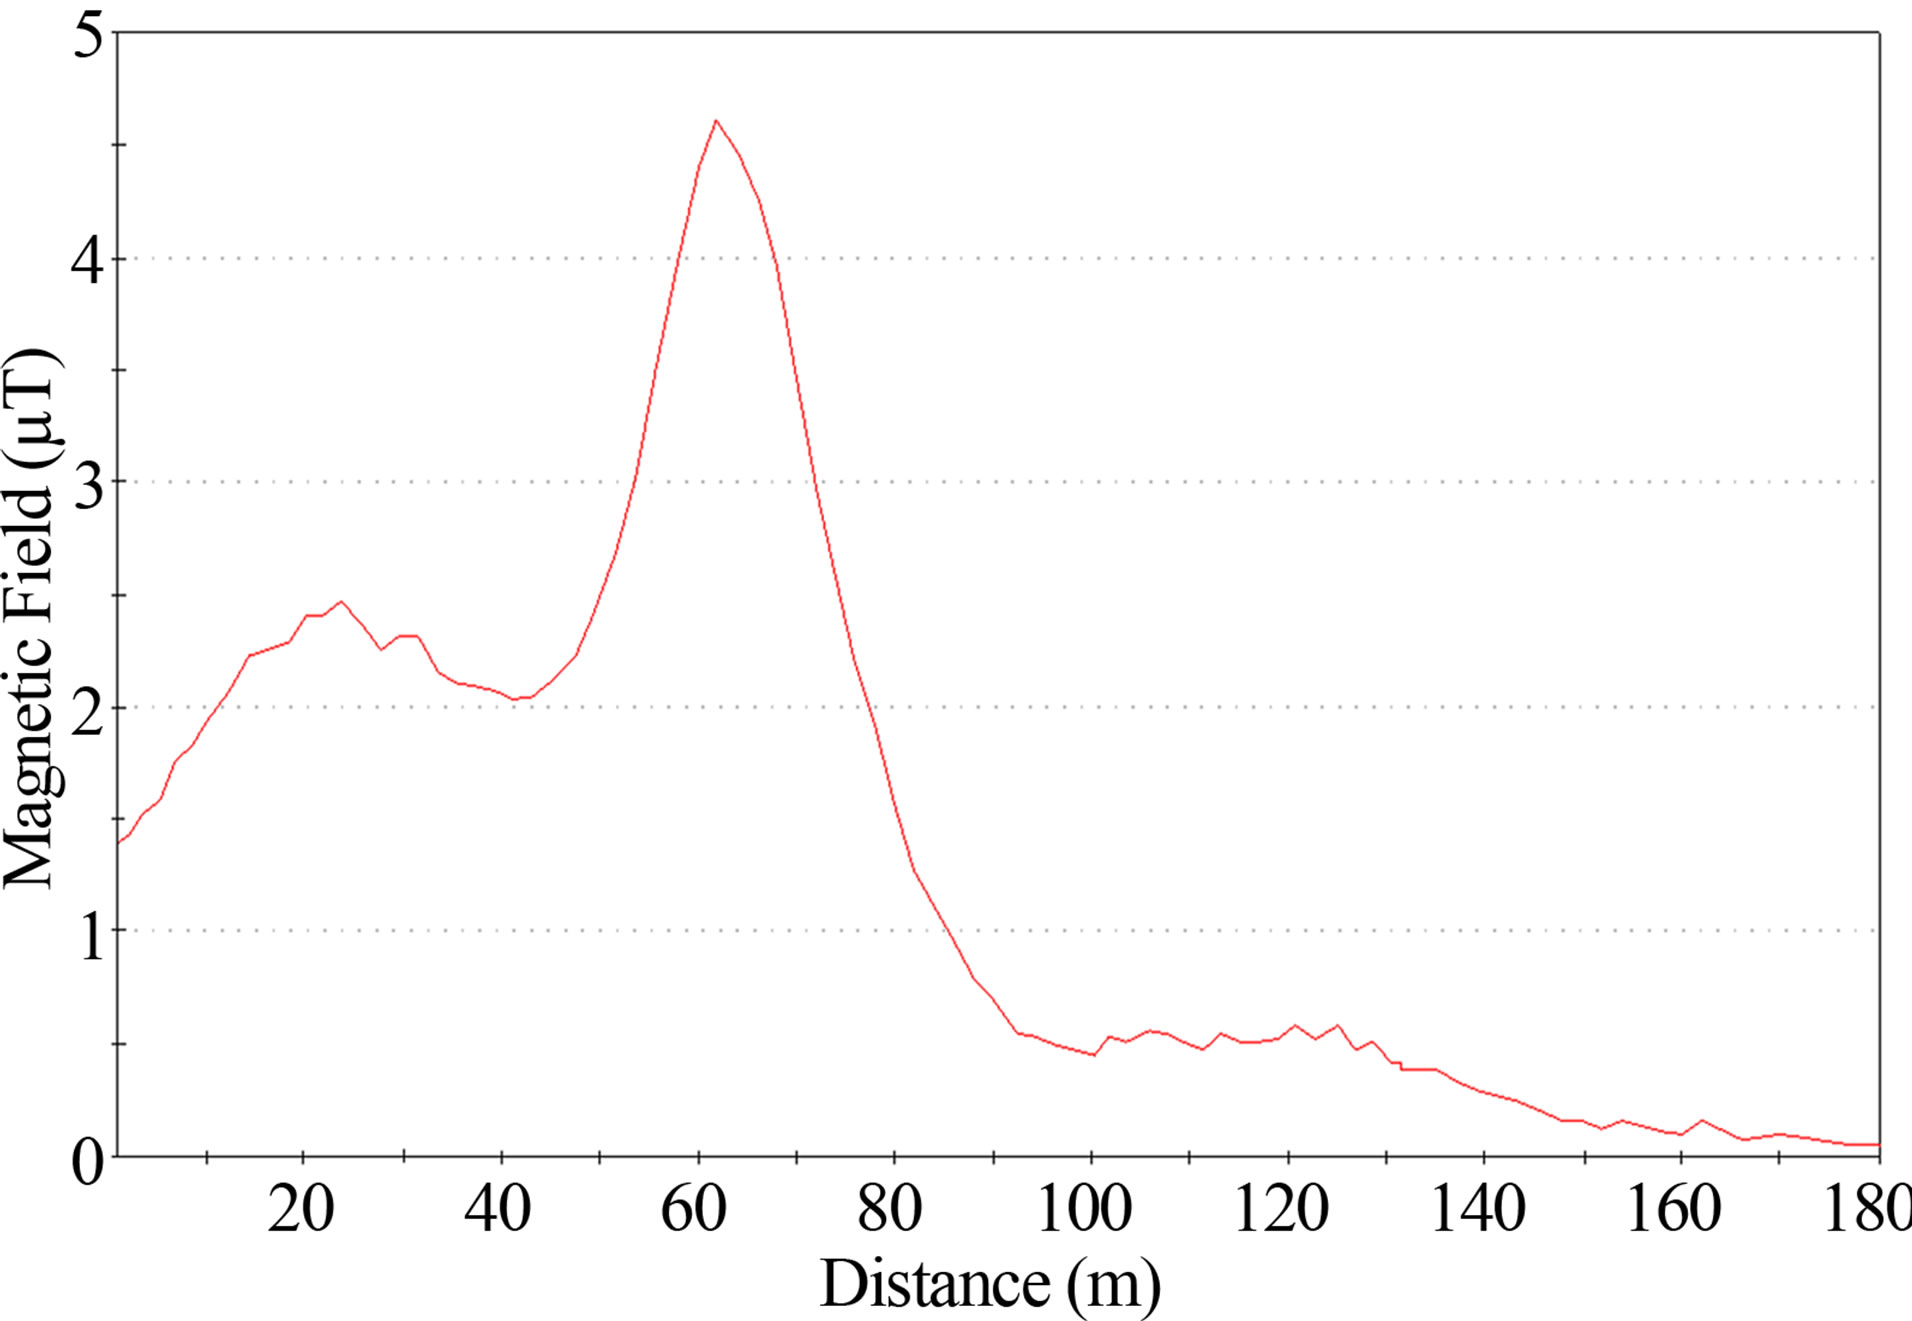
Figure 6. Profile 1, magnetic field.
the electric field decreases as the distance from the line increases, as shown in Figure 8. The maximum measured value of the magnetic field was 4.3 µT occurred underneath OHTL and then the values decreases with the increase in the distance, as presented in Figure 9.
4.4. Measurements around Distribution Transformer
In this site, a fenced distribution transformer is placed between a number of houses as shown in Figure 10. The

Figure 7. Profile 1, electric field.
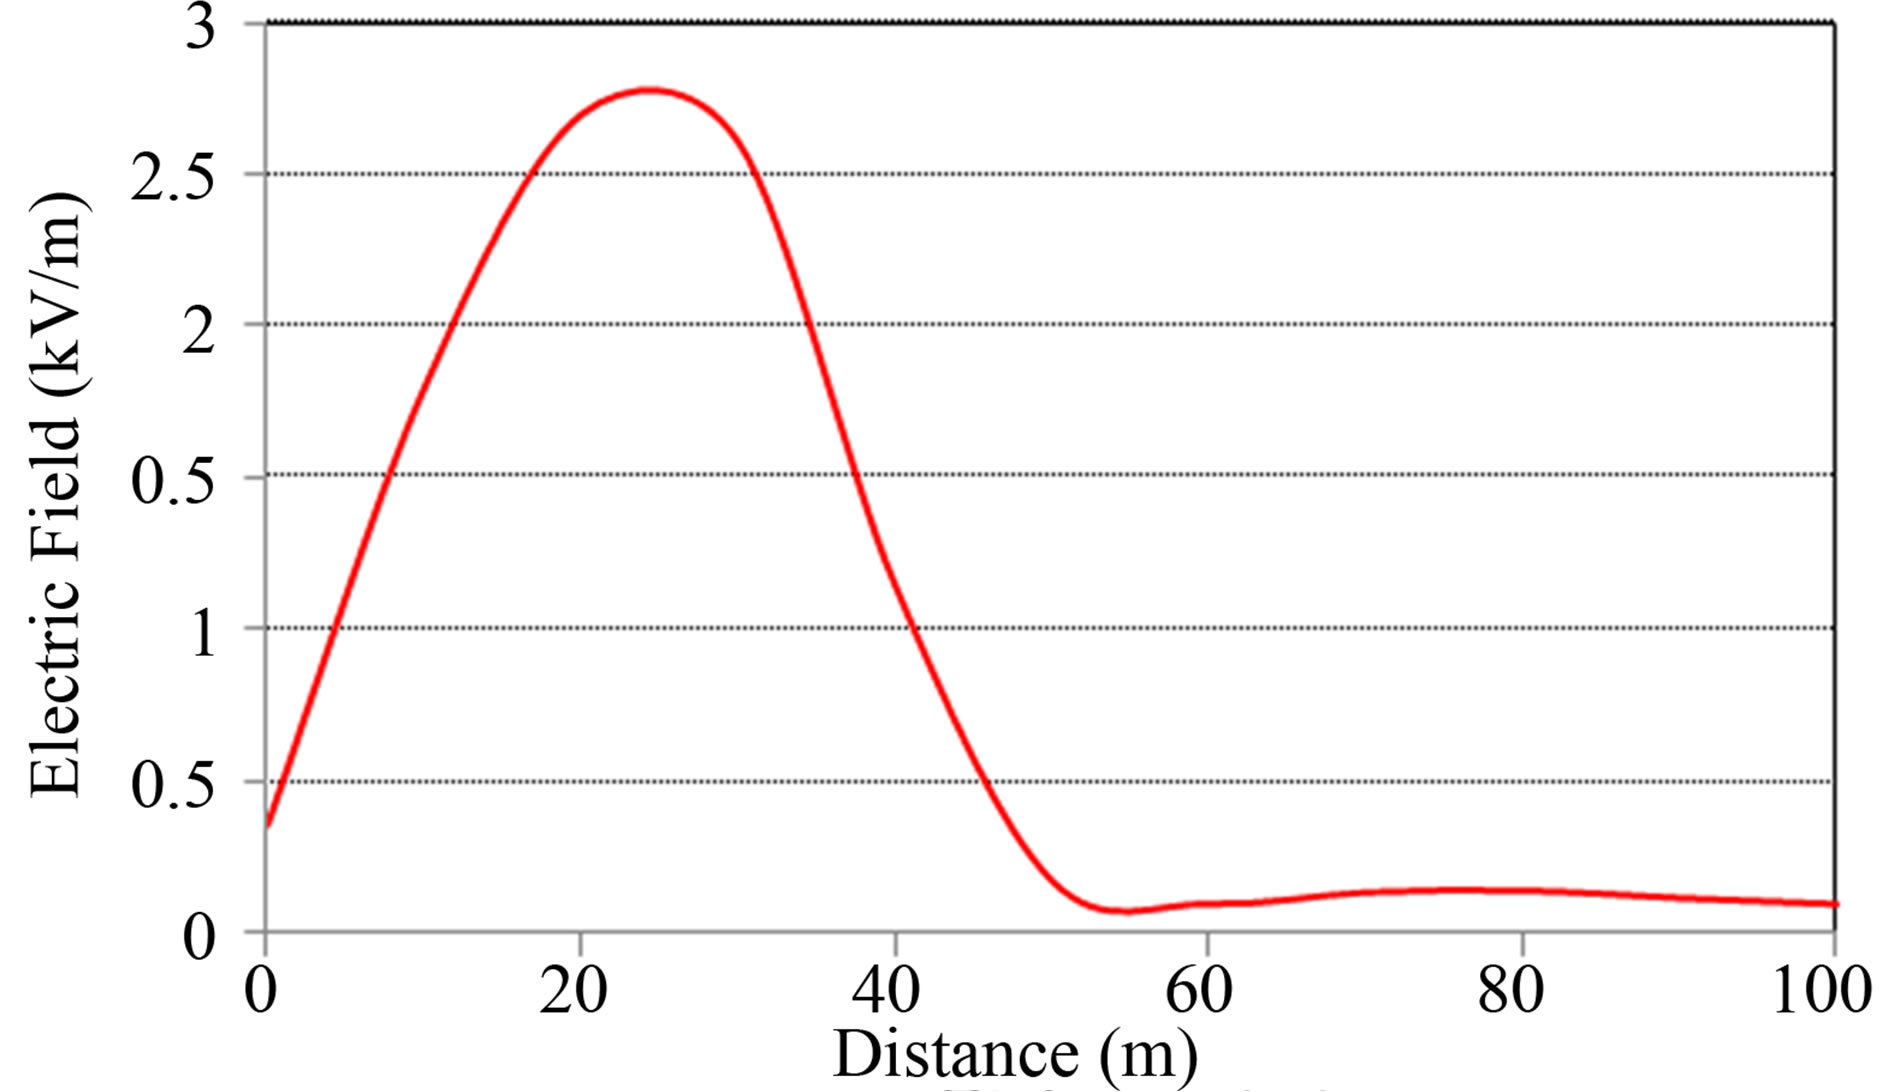
Figure 8. Electric field.

Figure 9. Magnetic field.
transformer is fed from 11 kV line through cable. The maximum measured value of the magnetic field was 5.5 µT along Profile 1. Profile 2 was taken around the transformer fence and at a distance of about 20 cm from the transformer fence. Figure 11 illustrates the measured value of the magnetic field along Profile 2 which has a maximum value of 9 µT close to the transformer.
The maximum measured value of the electric field was 0.0375 kV/m along Profile 2. This value was measured underneath 11 kV OHTL. The electric field along Profile 1 was very small.
4.5. Measurements around and inside the Fence of a Distribution Transformer
In this site, the electromagnetic field sources are coming from several underground cables, a distribution transformer, and a switch box. A schematic overview is given in the Figure 12. Because there was no OHTL nearby and the transformer was connected to ground, the electric field inside and outside the structure was zero. The maximum value of the magnetic field measured was 135 µT, as shown in Figure 13. This value was measured inside
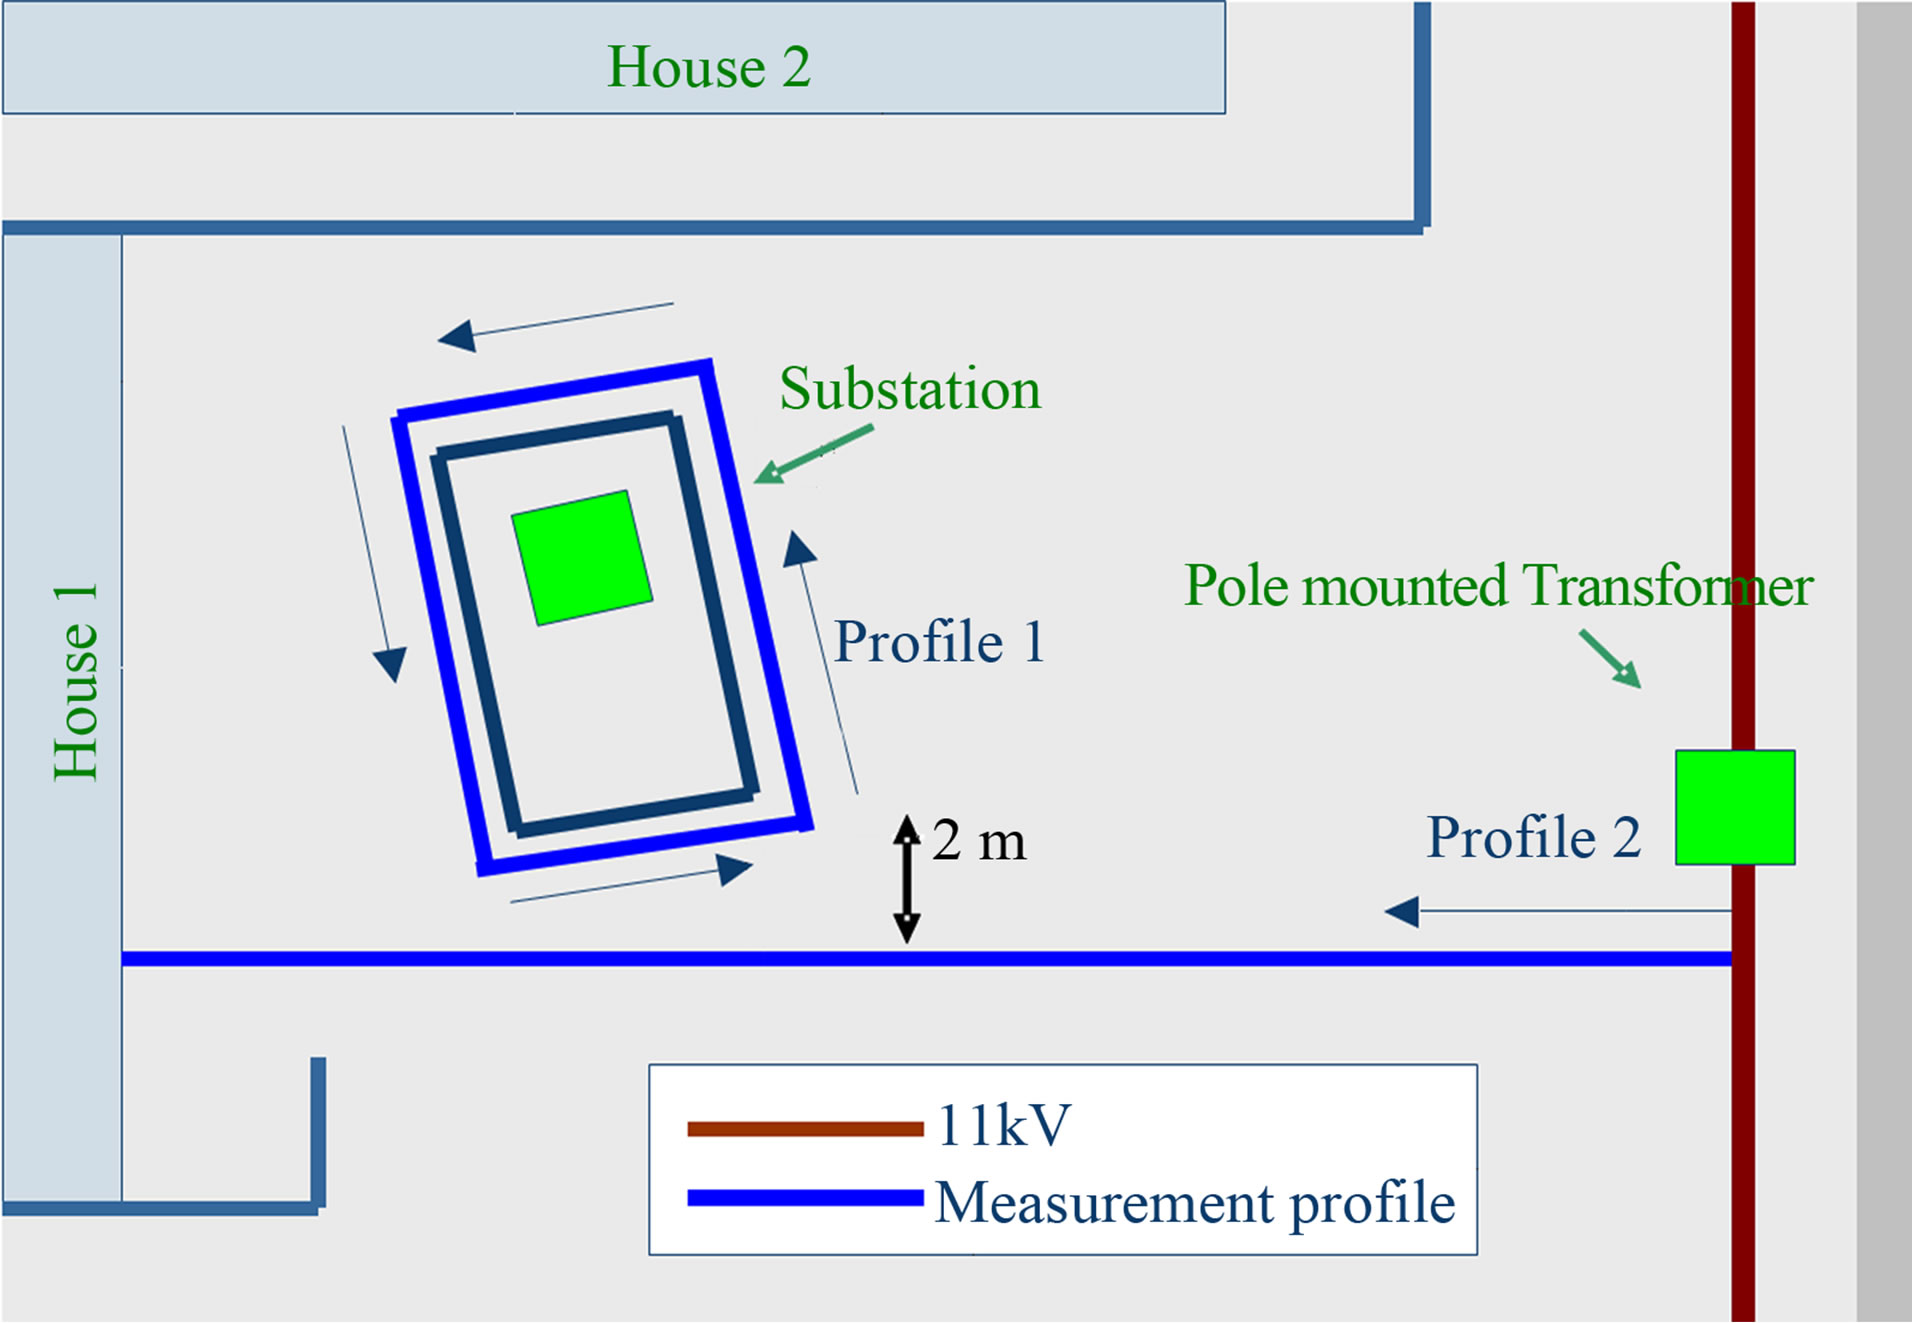
Figure 10. Schematic overview of the location.
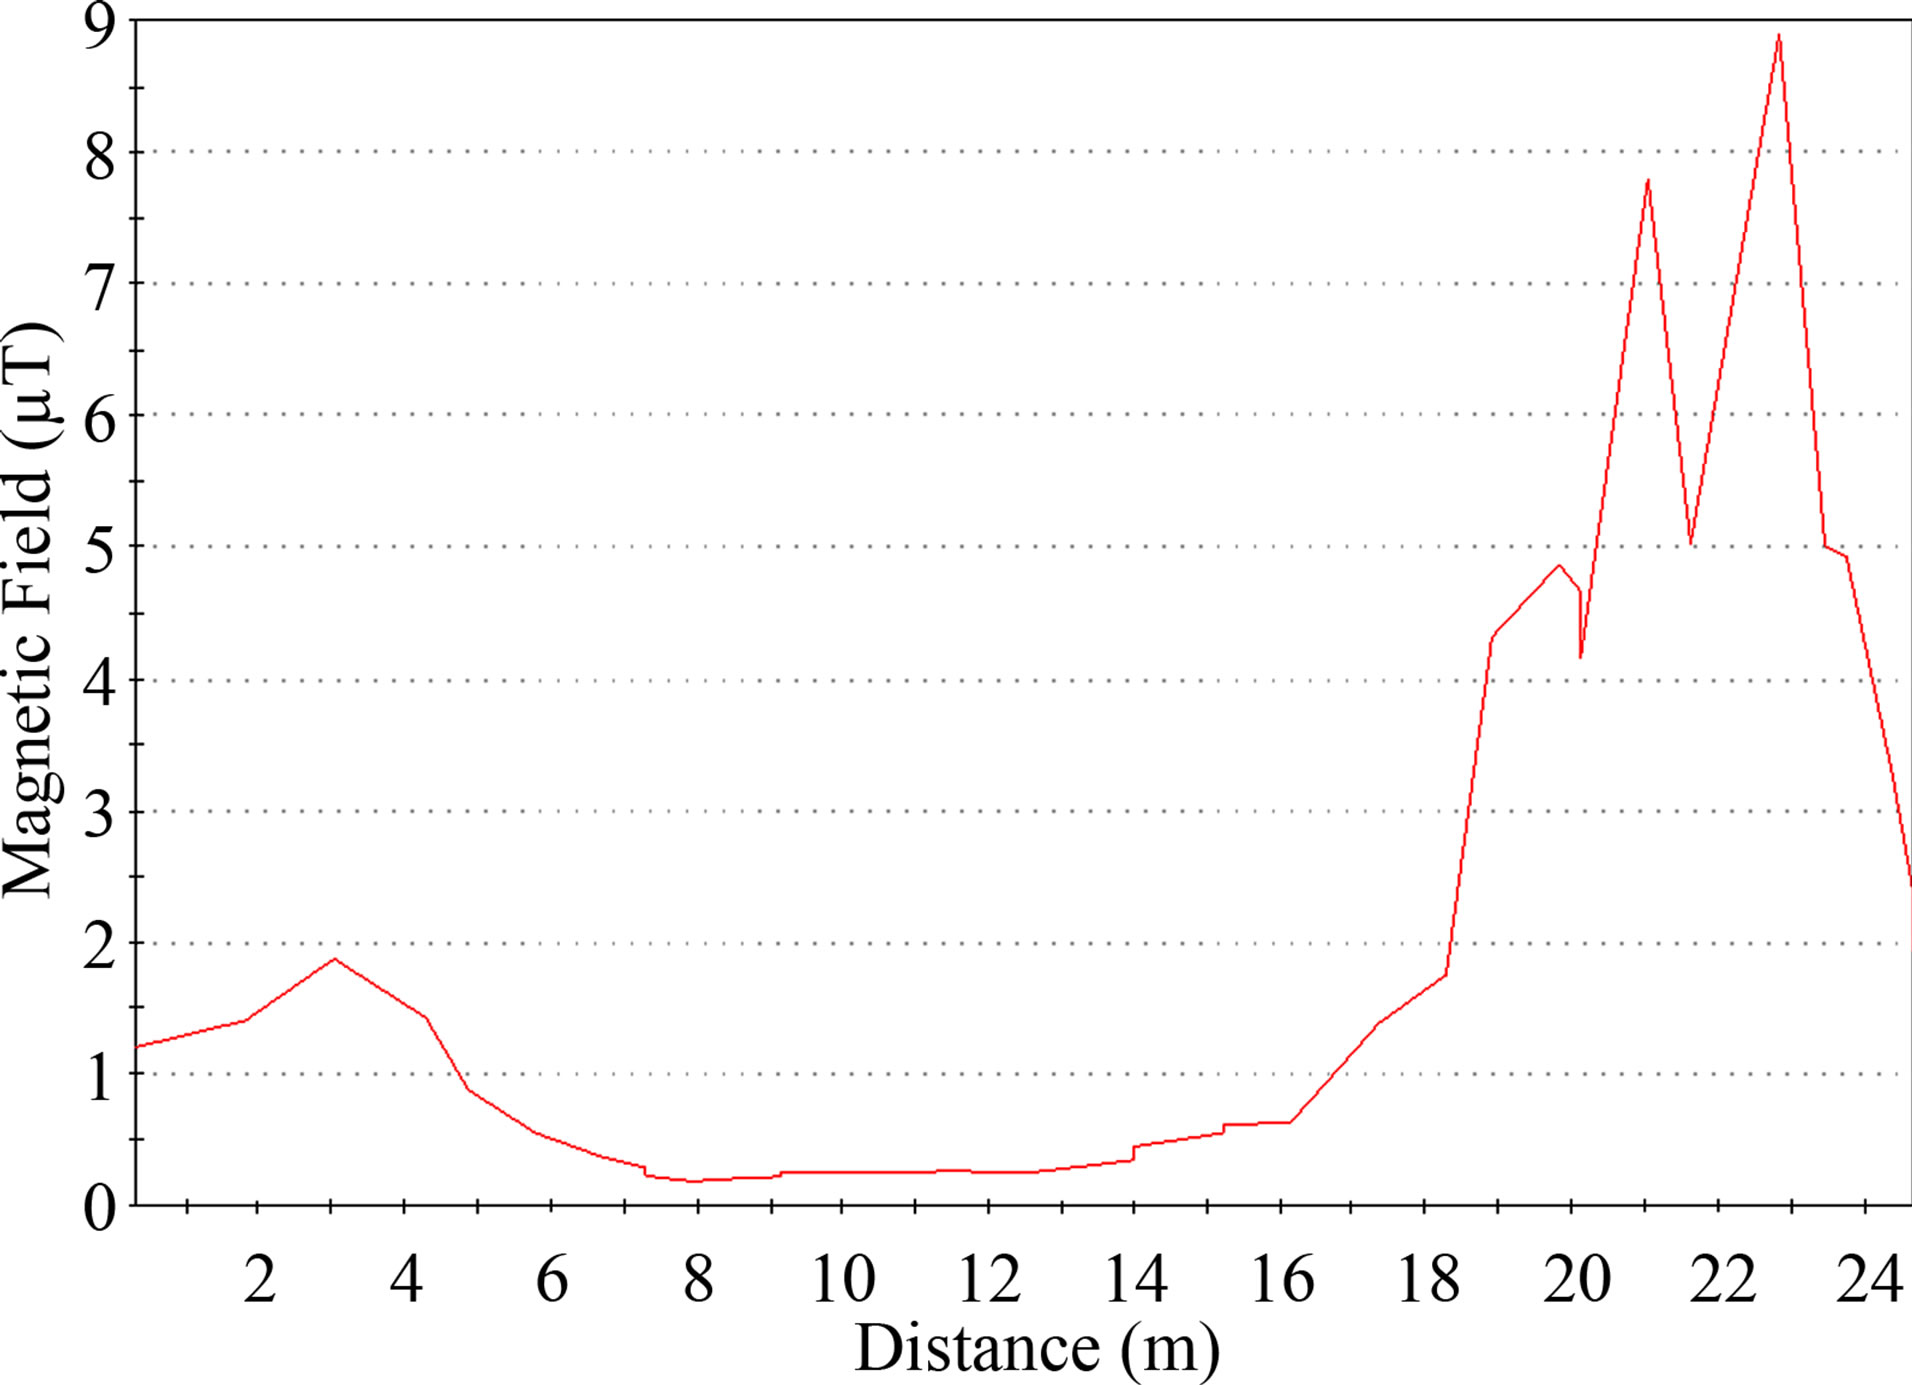
Figure 11. Profile 2, magnetic field.
the transformer structure (Spot number 4) between the switch box and the transformer. The maximum measured value of the magnetic field outside the structure was 16.1 µT, along Profile 2 near the switch box, as presented in Figure 14. The maximum measured value of the magnetic field along Profile 1 was 6 µT which was near the fence of the house.
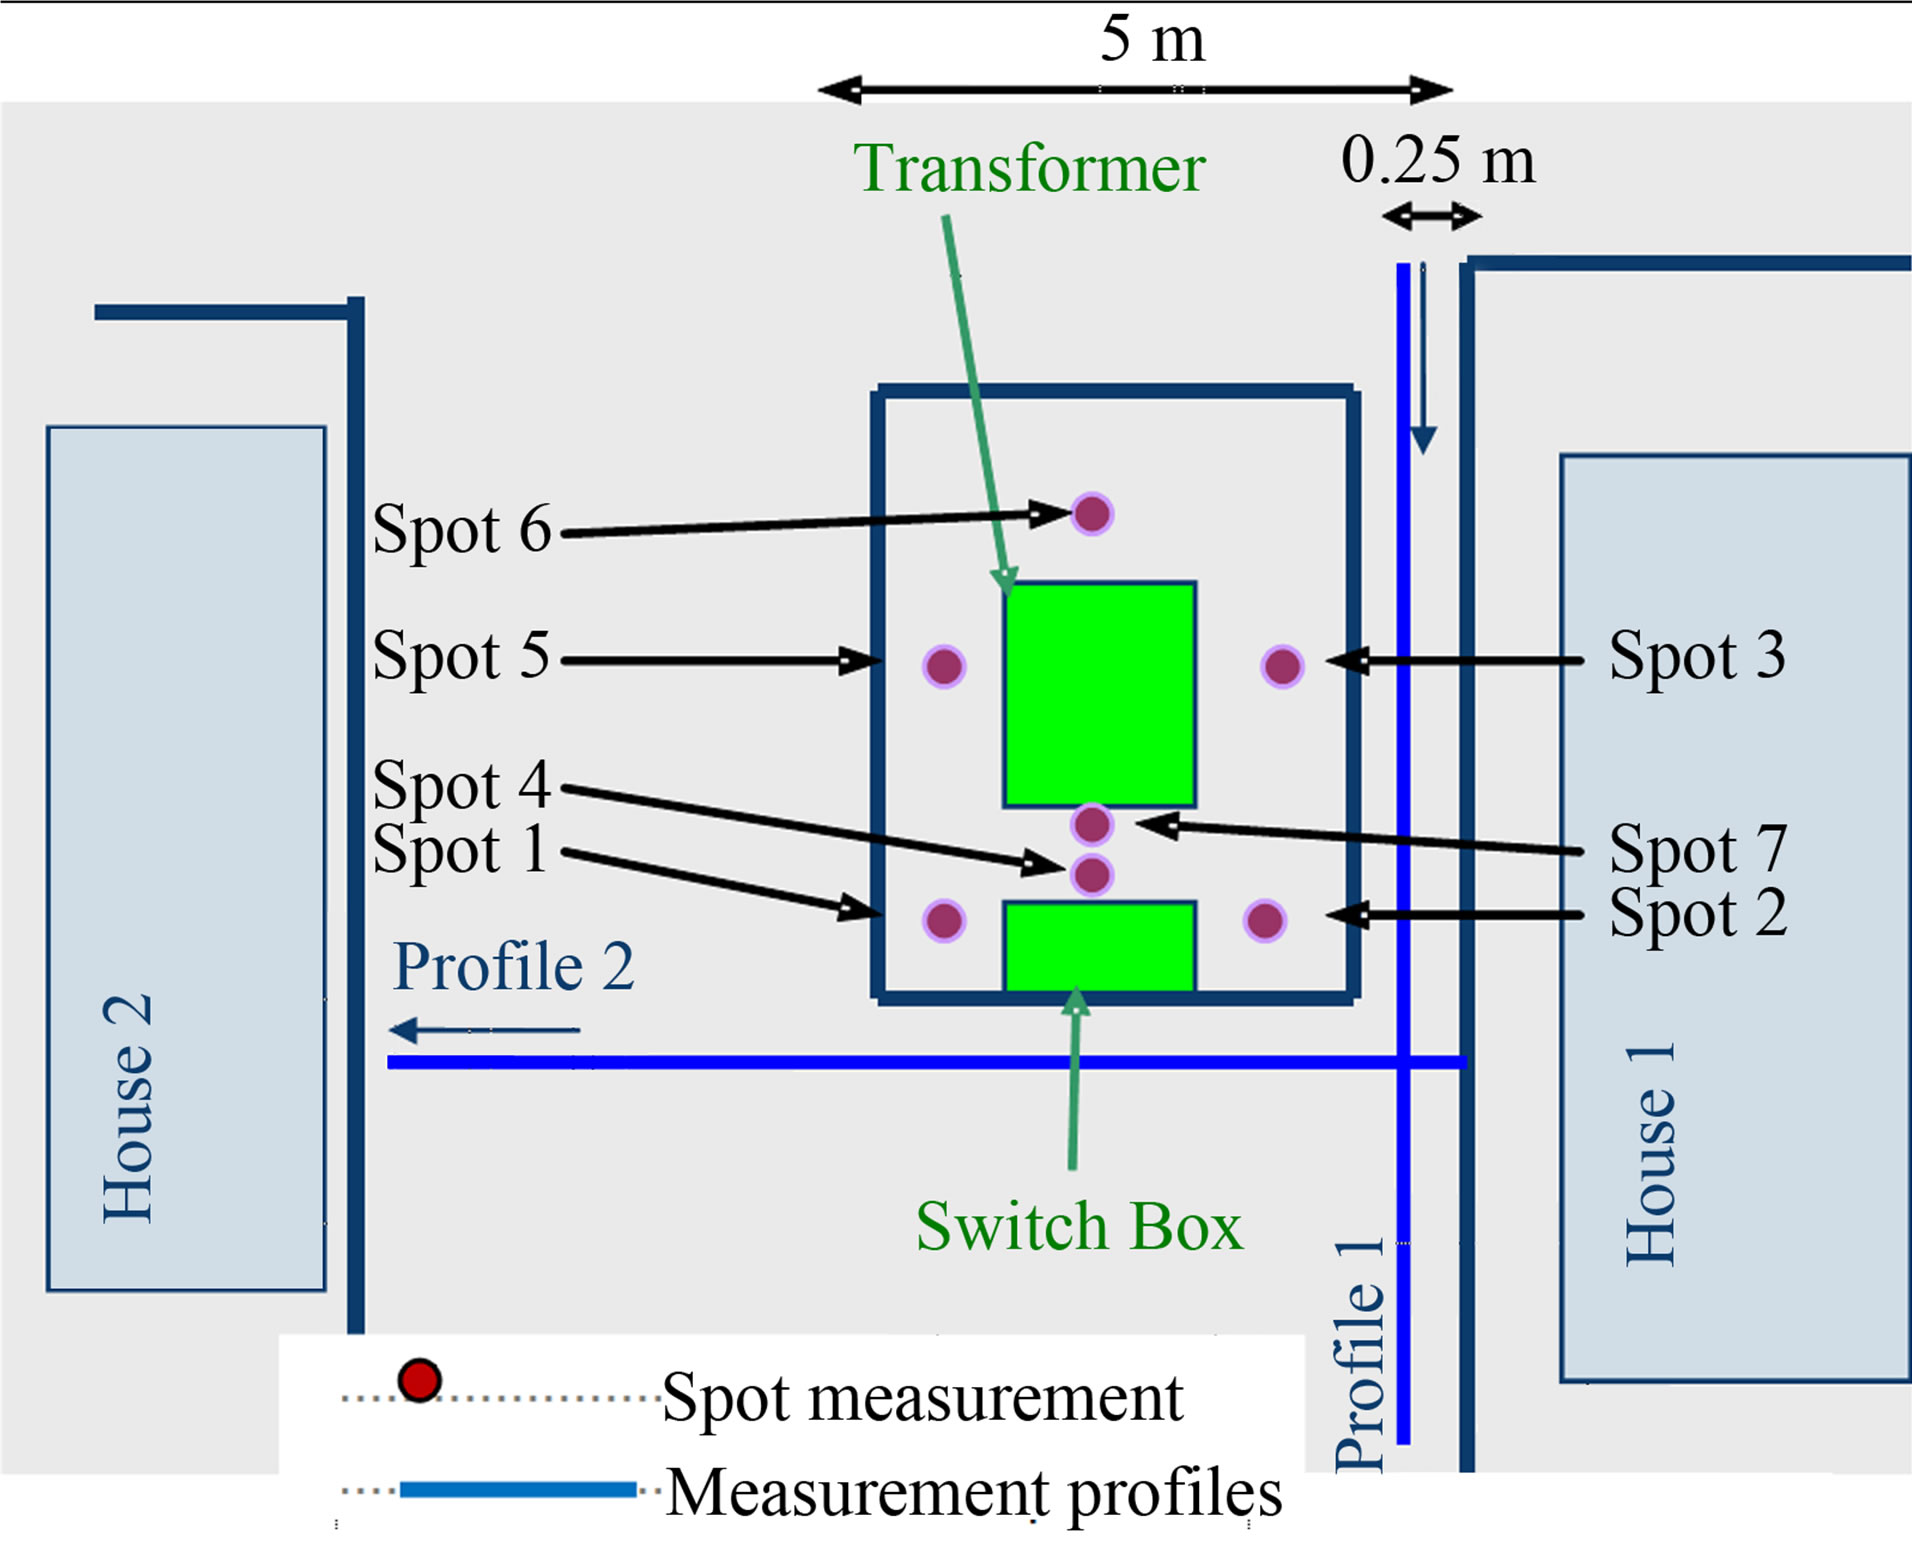
Figure 12. Schematic overview of the location.

Figure 13. Spot measurement, magnetic field.
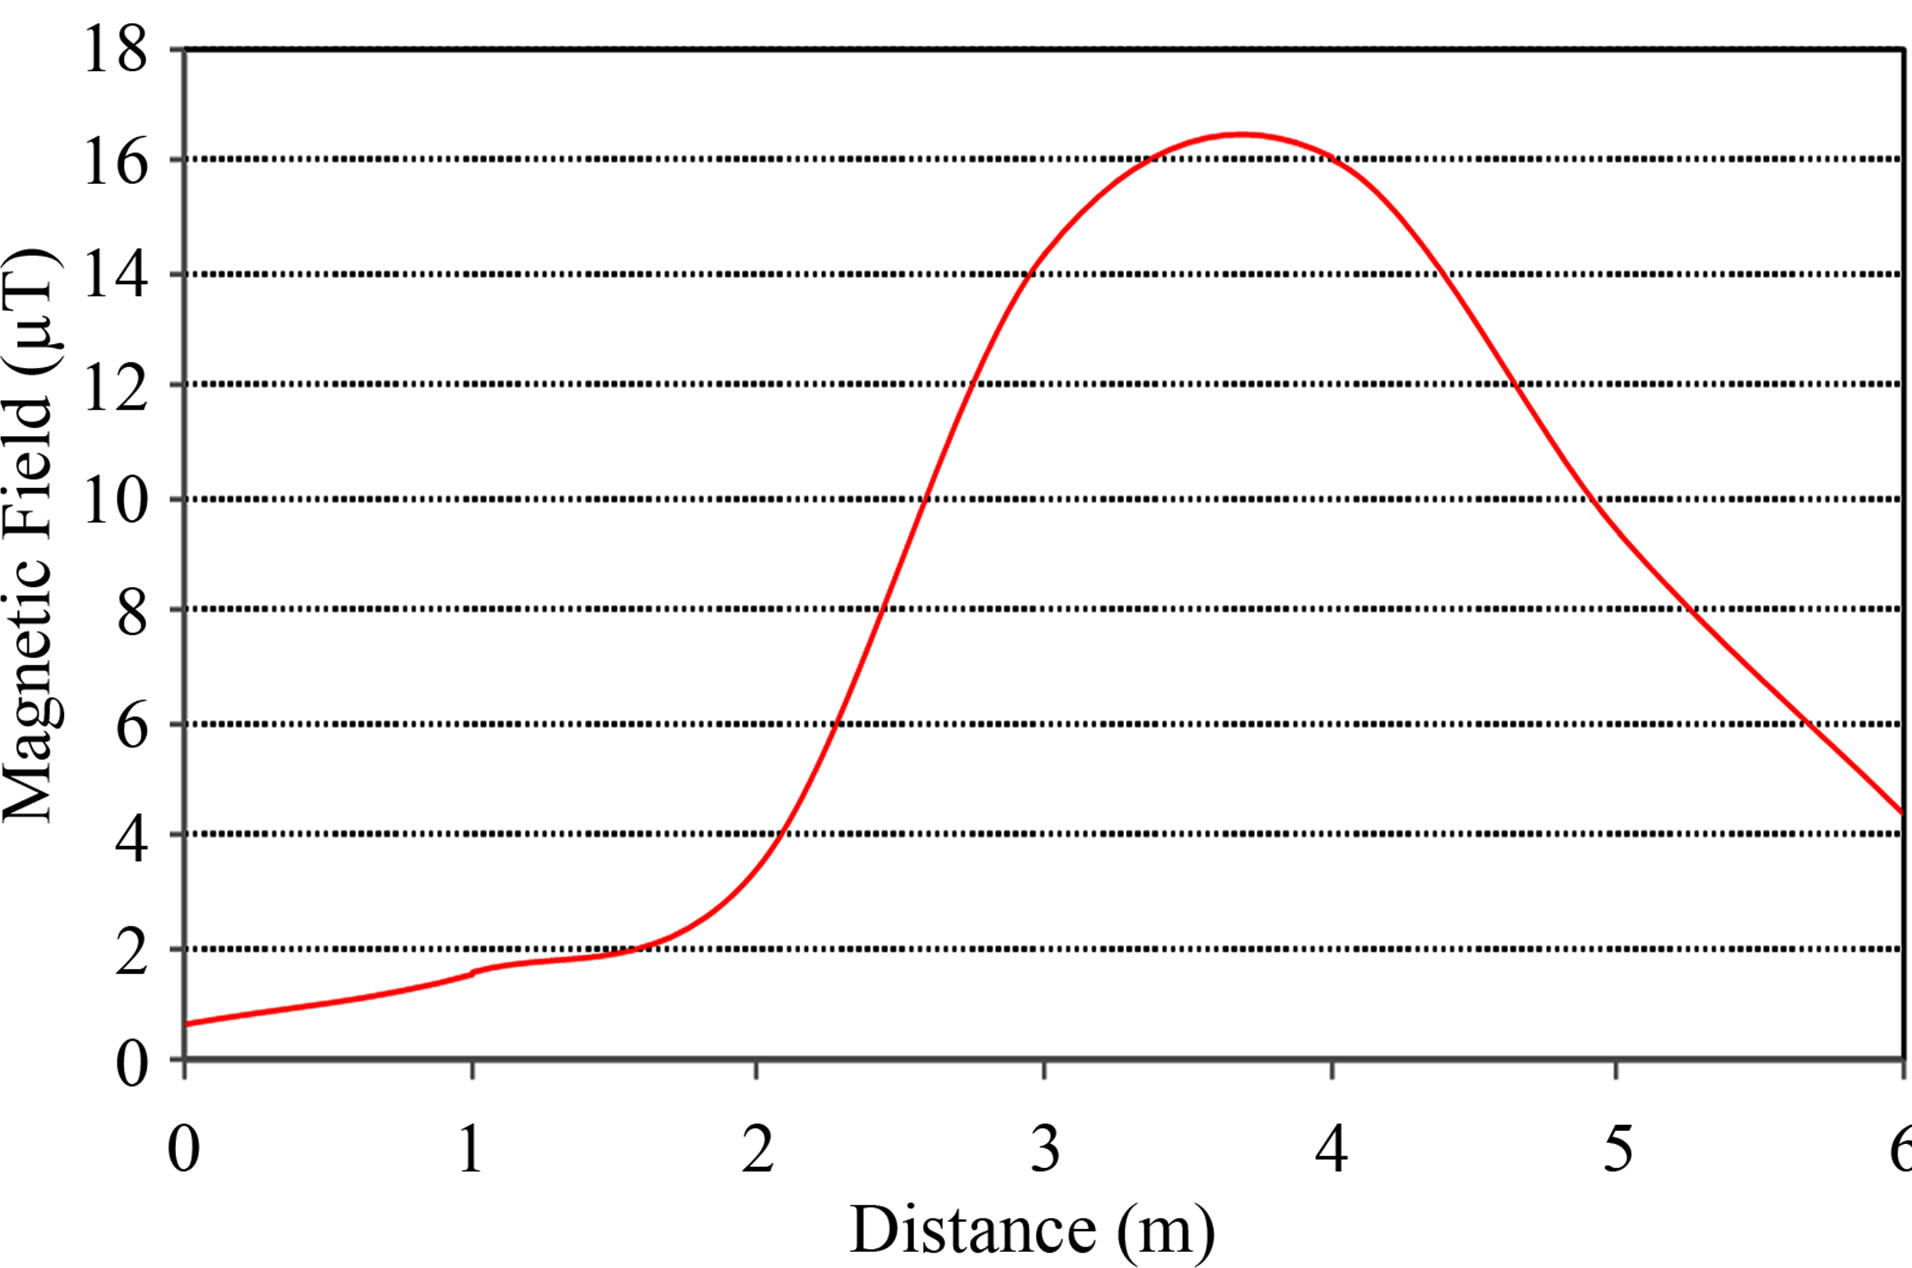
Figure 14. Profile 2, magnetic field.
5. Conclusions
Electric and magnetic fields were measured at several locations in Oman power system. The measurements were performed in several high voltage environments (including 220 kV, 132 kV, 11 kV, and 415 V), as well as near several types of electricity infrastructure (including grid stations, distribution transformers, overhead transmission lines and underground cables). All measured values of electric and magnetic fields are lower than the recommended values provided by ICNIRP.
The maximum values for electric fields were measured underneath 220 kV overhead lines; however the values are lower than the recommended limit (5 kV/m). It was found that the highest values for magnetic fields were measured inside the grid stations and substations, with values exceeding 180 µT in some places. Nevertheless, these locations are not accessible by general public and the limit value for occupational exposure was 1000 µT. In addition, the highest values for magnetic fields in areas where members of the general public would be exposed to the fields were at the boundaries of substations, with a maximum value of 16 µT being measured. Yet, this is significantly lower than the maximum value suggested by the ICNIRP.
It is expected that the level of electromagnetic fields, in Oman, will increase in the future owing to the growth in power demand which may require transmitting the electric power at higher voltage and current levels. Thus, new measurements should be carried out to verify that the general public is exposed to permissible exposure levels.
6. Acknowledgements
The author would like to acknowledge the financial support provided by the Authority for Electricity Regulation, Oman for doing research project number AS/ENG/ECED/- 09/04 and for Dr. Amer Al-Hinai and Engr Salem Al-Hinai who helped during the measurement phase.
REFERENCES
- T. S. Perry, “Today’s View of Magnetic Fields,” IEEE Spectrum, Vol. 31, No. 12, 1994, pp. 14-23. doi:10.1109/6.335811
- J. Schuz and A. Ahlbom “Exposure to Electromagnetic Fields and the Risk Childhood Leukemia,” Radiation Protection Dosimetry, Vol. 132, No. 2, 2008, pp. 202-211. doi:10.1093/rpd/ncn270
- A. Barth, I. Ponocny, E. Ponocny-Seliger, N. Vana and R. Winker, “Effects of Extremely Low-Frequency Magnetic Field Exposure on Cognitive Functions: Results of a MetaAnalysis,” Bioelectromagnetics, Vol. 31, No. 3, 2010, pp. 173-179.
- A. M. Garcia, A. Sisternas and S. P. Hoyos, “Occupational Exposure to Extremely Low Frequency Electric and Magnetic Fields and Alzheimer Disease: A MetaAnalysis,” International Journal of Epidemiology, Vol. 37, No. 2, 2008, pp. 329-340. doi:10.1093/ije/dym295
- National Radiological Protection Board, “ELF Electromagnetic Fields and the Risk of Cancer,” Report on an Advisory Group on Non-Ionizing Radiation, Vol. 12, No. 1, 2001, pp. 2-179.
- IEEE Std C95.6™, “IEEE Standard for Safety Levels with Respect to Human Exposure to Electromagnetic Fields, 0 - 3 kHz,” 2002.
- IARC, “Non-Ionizing Radiation. Part 1: Static and Extremely Low Frequency Electric and Magnetic Fields,” IARC Monographs on the Evaluation of Carcinogenic Risks to Humans, Vol. 80, 2002, pp. 361-365.
- ICNIRP Guidelines, “Guidelines for Limiting Exposure to Time-Varying Electric and Magnetic Fields (1 Hz to 100 Khz),” Health Physics, Vol. 99, No. 6, 2010, pp. 825-827.
- WHO, “Environmental Health Criteria 238. Extremely Low Frequency (ELF) Fields,” World Health Organization, Geneva, 2007.
- Oman Power and Procurement, “7-Year (2010-2016) Statement,” Oman, 2009.
- Authority for Electricity Regulation, “Annual Report,” Oman, 2010.
- US Environmental Protection Agency, “Ionizing & NonIonizing Radiation,” 9 July 2011. http://www.epa.gov/radiation/understand/ionize_nonionize.html
- WHO, “Extremely Low Frequency Fields: Radiation and Environmental Health,” World Health Organization, Geneva, 2007.
- A. H. Al-Badi and H. Al-Rizzo, “Simulation of Electromagnetic Coupling on Pipelines Close to Overhead Transmission Lines: A Parametric Study,” Journal of Communications Software and Systems (JCOMSS), Vol. 1, No. 2, 2005, pp. 116-125.
- A. H. Al-Badi, S. M. Ghania and E. F. El-Saadany, “Prediction of Metallic Conductor Voltage Owing to Electromagnetic Coupling Using Neural Fuzzy Modeling,” IEEE Transactions on Power Delivery, Vol. 24, No. 1, 2009, pp. 319-327. doi:10.1109/TPWRD.2008.2002657
- A. H. Al-Badi, I. Al-Zidi, F. Al-Amri, H. Al-Salmi and A. Al-Maamari, “Estimation of Population Exposure to Transmission Line Magnetic Field,” Industrial Applications of Energy Systems (IAES 2008), Sohar University, Sohar, 1-2 April 2008, pp. 35-40.
- S. Al-Alawi, A. H. Al-Badi and K. Ellithy, “An Artificial Neural Network Model for Predicting Gas Pipeline Induced Voltage Caused by Power Lines under Fault Conditions,” International Journal for Computation and Mathematics in Electrical and Electronic Engineering, Vol. 24, No. 1, 2005, pp. 69-80. doi:10.1108/03321640510571057
- A. H. Al-Badi, “Analysis of Factors Affecting the Level of Electromagnetic Interference on Pipelines Close to Power Lines,” WSEAS Transaction on Circuits and Systems, Vol. 3, No. 9, 2004, pp. 1977-1982.
- K. Ellithy, A. H. Al-Badi and S. Al-Alawi, “An Artificial Neural Network Model for Predicting Electromagnetic Interference Effects on Gas Pipelines Built in Power Lines Row,” International Journal of Engineering Intelligent System, Vol. 12, No. 4, 2004, pp. 229-235.
- The International Electromagnetic Fields Alliance (IEMFA), “Seletun Statement,” 2011. http://iemfa.org/index.php/publications/seletun-resolution
- “BioInitiative Report: A Rationale for a BiologicallyBased Public Exposure Standard for Electromagnetic Fields (ELF and RF),” 2007. http://www.bioinitiative.org/report/index.htm
- KEMA, “Authority for Electricity Regulation,” KEMA Measurement Report, 2009. http://www.aer-oman.org
- SQU, “Authority for Electricity Regulation,” SQU Measurement Report, 2009. http://www.aer-oman.org