Int'l J. of Communications, Network and System Sciences
Vol. 6 No. 6 (2013) , Article ID: 33226 , 9 pages DOI:10.4236/ijcns.2013.66032
A Measurement Study on Resource Popularity and Swarm Evolution of BitTorrent System
School of Computer Science and Technology, Harbin Institute of Technology, Harbin, China
Email: sumajing@gmail.com
Copyright © 2013 Majing Su et al. This is an open access article distributed under the Creative Commons Attribution License, which permits unrestricted use, distribution, and reproduction in any medium, provided the original work is properly cited.
Received April 24, 2013; revised May 24, 2013; accepted June 14, 2013
Keywords: P2P; BitTorrent; Measurement; Modeling; Popularity; Swarm Evolution
ABSTRACT
Analyzing and modeling of the BitTorrent (BT) resource popularity and swarm evolution is important for better understanding current BT system and designing accurate BT simulators. Although lots of measurement studies on BT almost cover each important aspect, little work reflects the recent development of BT system. In this paper, we develop a hybrid measurement system incorporating both active and passive approaches. By exploiting DHT (Distribute Hash Table) and PEX (Peer Exchange) protocols, we collect more extensive information compared to prior measurement systems. Based on the measurement results, we study the resource popularity and swarm evolution with different population in minute/ hour/day scales, and discover that: 1) the resources in BT system appear obvious unbalanced distribution and hotspot phenomenon, in that 74.6% torrents have no more than 1000 peers; 2) The lifetime of torrents can be divided into a fast growing stage, a dramatically shrinking stage, a sustaining stage and a slowly fading out stage in terms of swarm population; 3) Users’ interest and diurnal periodicity are the main factors that influence the swarm evolution. The former dominates the first two stages, while the latter is decisive in the third stage. We raise an improved peer arrival rate model to describe the variation of the swarm population. Comparison results show that our model outperforms the stateof-the-art approach according to root mean square error and correlation coefficient.
1. Introduction
BitTorrent (BT) is one of the most popular P2P filesharing systems and has a large amount of users. Despite BT is argued for copyright issues in recent years, the security and performance of BT systems still attract much attention. Researchers work hard to improve its performance. For example, extensions such as Distribute Hash Table (DHT) and Peer Exchange (PEX) have been applied in BT to ease the bottleneck of trackers. uTP is used to improve download speed. Trust and reputation mechanisms are applied to enhance security. These technologies not only improve the efficiency of indexing and robustness of the system, but also may bring new changes to resource distribution, user behavior and swarm evolution. Therefore, to better understand the characteristics of current BT network, it is necessary to perform new measurement to the BT swarms.
Existing measurement studies on BT systems nearly cover all of the important aspects such as torrent popularity [1], resource availability [2], traffic [3] and attacks [4]. However, little work reflects recent developments of BT systems, and the data used to analyzing and modeling BT system is usually collected from a single source (e.g. track logs, active peer detection). Many studies on evolution and performance of BT system usually assume the peer arrival rate obeys Poisson distribution [5], which have been proved not fitting the real measurement result [6]. A well accepted model is an exponential decreasing distribution proposed in [7] based on the logs of a tracker farm, which is widely used in designing BT simulators [8] and analyzing BT performances. However, they neglect the rapid changing period at the beginning of swarm evolution and the periodicity [9]. Moreover, their analysis and modeling of BT systems usually in day scale, which may miss some features because of the loss of precision.
Based on previous work, in this paper, we design a new measurement system combining active and passive approaches to get more comprehensive dataset. We study the resource popularity and re-modeling swarm evolution of BT networks in different time scales. Our measurement would be helpful for further understanding BT system, improving the system performance and designing BT simulators. Our main work and contributions include the following aspects:
First, we design a hybrid measurement system incurporating both active and passive approaches. We exploit Tracker, DHT, and PEX to gather peer information from BT Swarms more comprehensively compared to prior BT measurement systems.
Second, we discover resource distribution in BT is unbalanced. More than half of users are likely use μTorrent as the download client and 74.6% torrents have no more than 1000 peers. Torrents can be classified into 3 categories according their total peer population, that is, hot, ordinary and cold torrents.
Third, we study the swarm evolution of the three types of torrents in different time scales, and propose an improved peer arrival rate model to describe the variation of swarm population. Comparison results show our model is superior in terms of root mean square error and correlation coefficient. We divide the torrent lifespan into 4 stages and analysis the influential factors of peer arrival and leave rate.
The remainder of this paper is organized as follows. We introduce some related work in Section 2, and present our measurement system in Section 3. Based on the measurement results, in Section 4, we analyze the resource popularity and swarm evolution. We focus on the peer arrival rate, peer leave rate and the swarm evolution stages from a population perspective in minute/hour/day scales. We conclude our work in Section 5.
2. Related Work
Previous studies focus on measurement of various P2P systems, such as Gnutella [10], Napster [11], P2P-IPTV [12], etc. There are lots of measurement, analysis and modeling work on BT system as well. Some studies are about the popularity and performance of BT system. For example, Guo et al. [13] study the popularity of sharing files and downloading files by active measurement on 4 BT trackers, and shows the sharing-files popularity is unbalanced. Erman et al. [14] investigate the BT request message with Gaussian distribution, Log-normal distribution, Weibull distribution, etc. They point out that the request rate distributions are a composition of dual Webull and Gaussian distributions. A states transferring model designed by Tian et al. [15] for studying the performance of BT discovers the distribution of the download peer follows an asymmetric U-shaped curve under the stable state due to BT’s unchoking strategies.
Measurement study on BT also concern modeling of BT networks. Qiu et al. [5] propose a fluid model to examine the scalability, performance and efficiency of BT based on simulations and a 3-day tracker’s log. They assume the peer arrival rate as a Poisson process. However, on the other hand, Pouwelse et al. in their work [6] shows the peer arrival rate is not such a process based on the data collected from Suprnova [16] for 8 months. Pouwelse et al. also present detailed measurement results on the popularity, availability, integrity, flash crowd handling and download performance of BT systems. Based on [5], Petrovic et al. [17] present a fluid model for eMule-like systems and Guo et al. [7] improve the model by an exponential decreasing distribution and study the performance from a multiple torrents viewpoint by analyzing the file downloading statistics of peers recorded by the tracker sites. Their results are widely used in network analysis and simulator design. Different from the works above, Fan et al. [18] introduce a stochastic differential equation approach of modeling the dynamics of BT, which can provide a much higher accuracy than [5] according their simulation results. Li et al. [19] also estimate the average number of connection per peer using the stochastic model.
In our previous work [9], we improve Guo’s [7] model by a more detailed measurement. Compared to previous studies, in this paper, we study the BT swarm in a long time and develop the model in [9] to fit the swarm lifespan. Moreover, we concern about the new patterns of current BT network, the influence of time scale selection, and torrent popularity, providing the insight of current BT systems. Some results [20] in this paper were first presented at the IEEE International Conference on Cyber-enabled Distributed Computing and Knowledge Discovery (CyberC 2012). This paper is extended from the conference version, especially the analysis of resource popularity.
3. Measurement
3.1. Architecture of BT Measurement System
Most existing analysis and modeling of BT systems are based on tracker logs [7] or active measurement [6], which is only part of the whole BT network. Nevertheless, gathering information more quickly and more extensively helps to accurately analyze and model the measurement results. However, BT network is dynamic, and large amount of peers join and leave frequently. Therefore, it is impractical for a measurement system to track all the peers and torrents. To give a more comprehensive view of BT network, we combine active and passive measurement, and collect data from trackers, DHT and PEX. Figure 1 shows the architecture of our BT measurement system. The system crawls torrents from websites and gets peers from trackers, DHT, and PEX. Then it collects the downloading information of peer by interacting with them.
Once the Torrent Crawler downloads torrents from
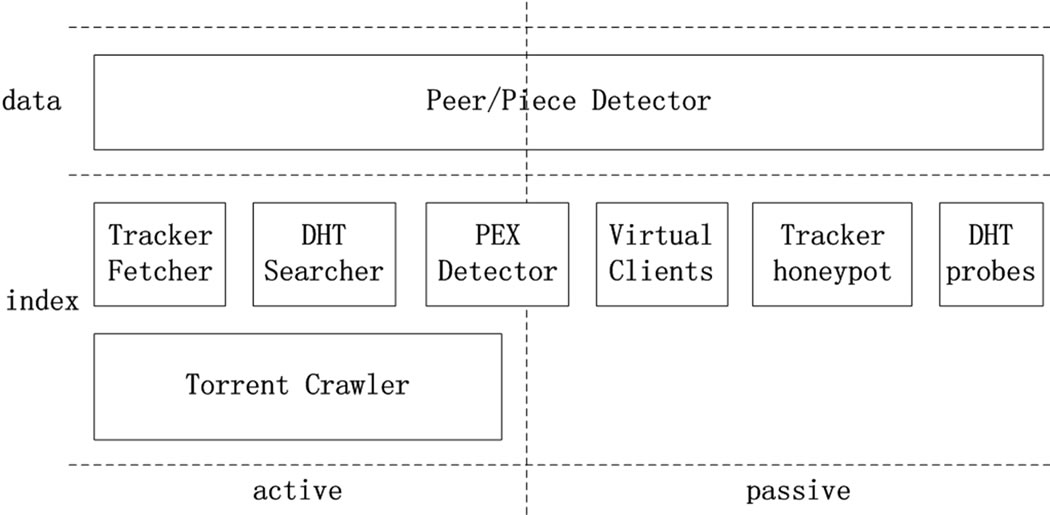
Figure 1. Architecture of BT measurement system.
website, the Tracker Fetcher will request peers periodically from the trackers in a known tracker list and trackers extracted from the torrents. At the same time, the Virtual Clients start to listen and accept BT sessions from remote peers downloading these torrents. The DHT Searcher scrapes peers in DHT network and DHT probes wait requests to identify peers. When a peer is found or a connection is accepted, PEX Detector and Peer/Piece Detector will exchange BT message with the peer to get their neighbors and BITFIELD. The sample time of each module is configurable. To optimize the speed, the system only track the basic information, including the torrents, its trackers, and peers in each tracker at each sample point.
3.2. Measurement Results
Our measurement system was deployed on 7 servers in the cities of Beijing, Guangzhou and Harbin with different ISPs and different bandwidth. The measurement ran from 2010-04-19 to 2010-06-15. The system collect about 0.5 million torrents (identified by infohash) from 72 world-wide BT torrent publish sites, and randomly chose 2320 torrents from them to do a long time measurement to study the swarm evolution. The system took peer list snapshots of the trackers extracted from torrents every 5 minutes, and then exchanged BITFIELD and PEX messages with captured peers every 30 minutes, with 368 GB raw compressed data collected. The torrents were measured in a minor delay after they were published to the website, and most of their swarm evolutions were caught.
4. Modeling and Analysis
We define the torrent lifetime as the duration from the time when the torrent is published in the website to the time after which there is no users downloading this torrent. We define the torrent population as the total number of peers (identified by IP and ports) who has downloaded this torrent. In this section, we study the distribution of torrent population and the swarm evolution with different torrent population in 10 minutes, 1 hour, and 1 day time scales.
4.1. Resource Popularity
4.1.1. Torrent Popularity
It can be seen from the torrent publish sites that the amount of downloaders of torrents is not balanced. Some hot movies have more peers while some software may have fewer peers. We extract peers (de-duplicated by
The Figure 2 indicates that the torrent population is unbalanced. Only 3.8% torrents have more than 10,000 peers and 76.2% torrents have no more than 1000 peers. Different from prior studies on torrent evolution that usually choose torrents with large population, we divide the peer into three types: hot torrents (n > 10,000), ordinary torrents (1000 < n ≤ 10,000), and cold torrents (n ≤ 1000), and study the characteristics of swarm evaluation of each type.
We also extract the shared files from the torrent and study their types. Results shows rar, mp3, rmvb and avi are the most popular types, which is consistent with our common sense. We classify the file types into video, audio, archive, document and other, shown in Figure 3. BT users may compress the large game software or video files to fast distribution, so the rar files take a large proportion (33.28%). Video files (such as rmvb, avi, mkv) are also very common in BT, about 22.68. Particularly, animation and TV series usually are published as rmvb files, while movies often use the avi and mkv types. We randomly choose 100 torrents from each type and analyze with human insight to understand the piracy prob-
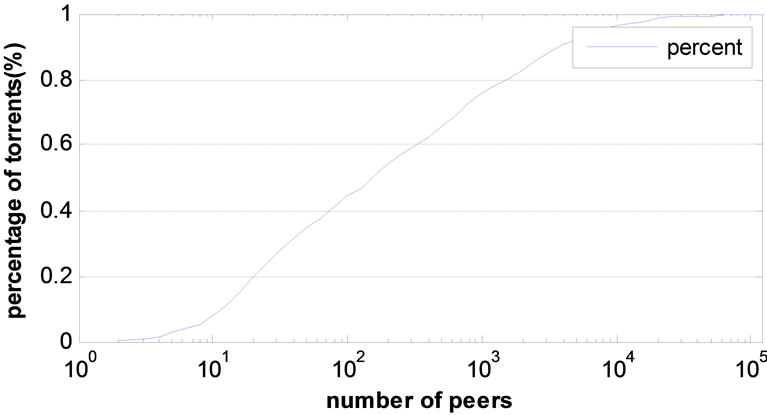
Figure 2. CDF distribution of torrent population.

Figure 3. Percentage of shared file types in BT.
lems in BT networks. Results show that more than 87% of the contents are infringing, especially the hot movies, TV series and music. Therefore, we must attack much importance to the copyright protection.
Due to the efficiency of BT, users like to share large files with BT network. The size of resource files also indirectly influence peer downloading time. Therefore, we examine the file size as well. We find about 79% of the shared files are less than 1G, most of which are TV series and music. The left 21% are larger than 1G, the majority of which are HD movies.
4.1.2. BT Client Popularity
BT protocol has been implemented as more than 50 BT clients, such as μTorrent (UT), Vuze (VZ), BitComet (BC), BitSprit (BS), etc. In this paper, we collect 1.91 million worldwide peers and analyze their client software. Results are shown in Figure 4. The proportion of clients observed by active measurement is consistent with that from passive measurement. More than half of the peers tend to use μTorrent, while the widely-used client Xunlei only take 3.07% all over the world. And there are more Chinese users begin to use μTorrent. Despite there are great differences (e.g., protocol implementation, peer and

Figure 4. Percentage of BT client versions.
piece selection policy) among these clients, they are usually compatible with each other. However, the concentration of using one client may bring security risks. If an attacker finds vulnerabilities of a client, it can launch large-scale attacks.
4.2. Swarm Evolution
Prior studies on swarm evolution generally use one day as the time unit [6]. However, to our observation, the swarm populations of hot torrents change dramatically in the first few hours since torrents are published, while for cold torrents, the population does not fluctuate obviously. To verify this, we first analyze the peer arrival rate in different time scale and then we discuss the peer leave rate and the stages of swarm evolution. We choose one torrent from each of them to illustrate the analysis result as shown in Table 1. Other torrents have similar characteristics.
4.2.1. Peer Arrival Rate
We identify a new peer as it is never discovered before during our measurement, and its arrival time is the sample point of time when it is first observed. Note that there already exist some peers in the swarms before measurement starts due to the delay of torrent discovering and system initializing.
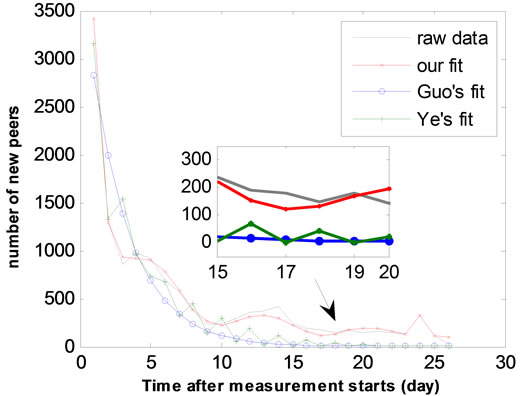
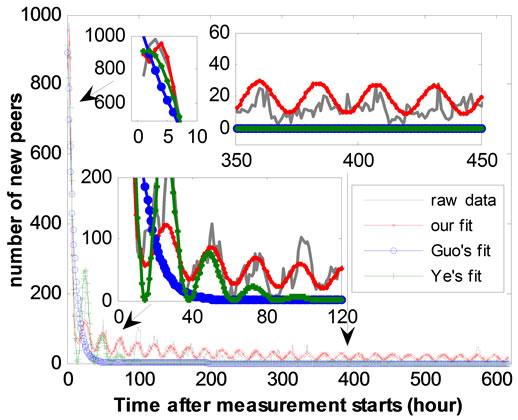
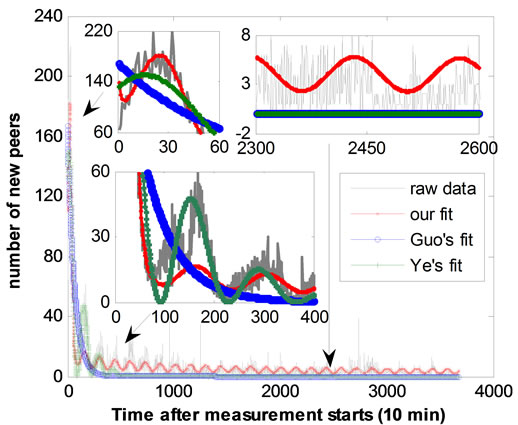
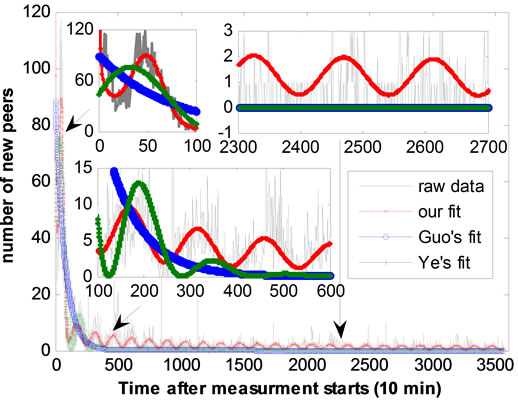
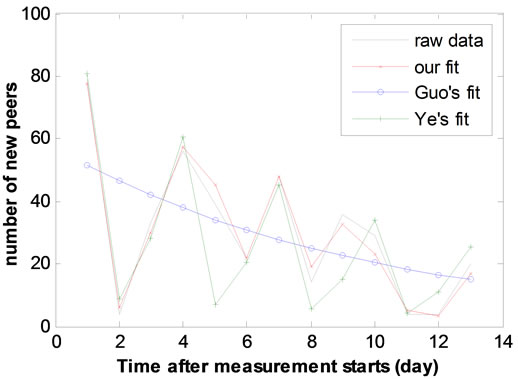
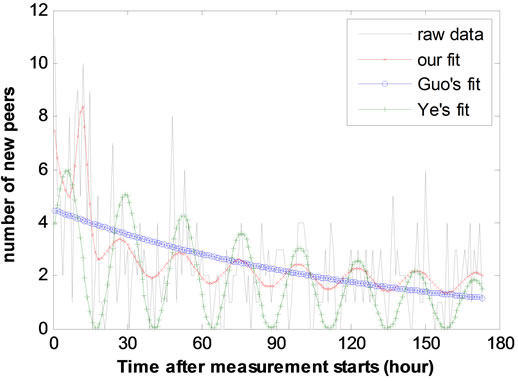
Figures 5-7 show the peer arrival rate varies with time in 10-minutes scale, 1-hour scale and 1-day scale of the three torrents. The x-axis is the time after measurement starts. The y-axis is the number of new incoming peers of each time unit. We can observe from the Figures 5-7, the peer arrival rate changes rapidly at the first few hours, and has obvious periodicity according to results in 10 minutes and 1 hour scales (Figure 5(b)). However, the day scale could not reveal this phenomenon. Besides, for the cold torrents (e.g. torrent #3), the number of peers newly added in 10-minutes scale is generally one or two, and sometimes zero. This suggests that the 10-minutes scale is too small for such torrents to identify peer behaviors. It seems that 1 hour scale is a reasonable timegranularity for modeling the swarm evolution in our in-
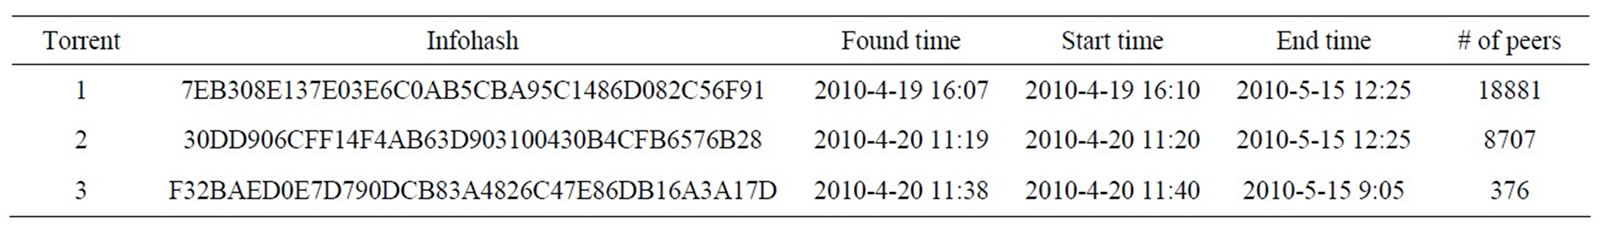
Table 1. Information of the example torrents
(a) 10-min scale (b) 1-hour scale (c) 1-day scale
Figure 5. Peer arrival rate in 10-minutes/1-hour/1-day scale of #1 torrent.


(a) 10-min scale (b) 1-hour scale (c) 1-day scale
Figure 6. Peer arrival rate in 10-minutes/1-hour/1-day scale of #2 torrent.

(a) 10-min scale (b) 1-hour scale (c) 1-day scale
Figure 7. Peer arrival rate in 10-minutes/1-hour/1-day scale of #3 torrent.
vestigation. Moreover, we can see that for the hot torrents (such as #1), the number of newly incoming peers are more than one hundred, while for the cold torrent #3, it is only less than ten even most time 0 in minutes scale. This indicates that the peer arrival rate can also be used to identify torrent popularity.
By studying request patterns of most torrents, we discover that the trend of peer request is the composition of decrease and volatility. The factors that influence the peer arrival rate mainly lie in three aspects: torrent popularity H(t), diurnal periodicity P(t), and stochastic noise N(t). The influence of these factors varies with different torrents, and even with different time spot for individual torrent. Thus, we define k1, k2, k3 as the weight of H(t), P(t) and N(t) respectively, and the peer arrival rate can be defined as:
 (1)
(1)
Based on [7,9,14], we assume H(t) obeys a Gaussianlike distribution and P(t) follows an sinusoidal-like periodic mode, and we ignore the stochastic noise(by setting k3 to 0). Therefore, the model of the peer arrival rate with respect to time t is:
 (2)
(2)
where t is the time after the torrent published. k1 and k2 are the weight of torrent popularity and diurnal periodicity factors. D is the time when peek occurs and w is the offset of the peak. T is the period of the diurnal periodicity factor and it’s value is around 2p/24 = 0.26. B is the diurnal offset. C is the initial offset of amplitude and it reflects the number of initial seeders. t is the attenuation parameter of the amplitude.
We use Equation (2) to fit our measurement result. We also compare our model with Guo’s model (Equation (3)) [7] and Ye’s model (Equation (4)) [9]. Results are shown in Figures 5-7. The parameters of 1-hour scale are listed in Table 2.
 (3)
(3)
 (4)
(4)
As shown in Figures 5-7, in our measurement data set, intuitively, our mode is closest to the real value in all time scales. It can reflect both the reduction process and the diurnal periodicity of new peer population. The fitting parameter T of our model is 0.26 ~ 0.28, suggesting the cycle of fluctuation is about 24 hours, consistent with human daily routine. We can see that Guo’s model [7] is suitable for identifying the overall trend in large time scale, while Ye’s model [9] can fit the initial period. A common disadvantage of their model is that they are not suitable for the hot torrent with a long term modeling. This because the exponential decreasing distribution in their models falls to nearly zero rapidly.
Quantitatively, we use root mean square error (RMSE) in (5) and correlation coefficient (R) in (6) to evaluate the fit results:
 (5)
(5)
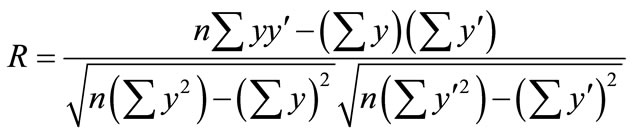 (6)
(6)
where yi and  are the i-th measurement value and the fit value respectively, and n is the number of pairs of data.
The results summarized in Table 2 show that the RMSE of our model is less than Guo’s model [7] and Ye’s model [9], and the R is larger than their models. This demonstrates our model fits better than theirs on the test set. Besides, we also fit in other time scales for more than 100 torrents chosen randomly. Comparison results indicate that our model is superior to their models in terms of RMSE and R. We could not give all these results here for the sake of space limit.
4.2.2. Peer Leave Rate
We identify a leave peer as it will never appear in the measurement result after the last time of being discovered. The main factors influencing peer leave rate are torrent popularity, diurnal periodicity, and incentive mechanisms. As time goes by, the number of newly added peers decreases, so does the newly removed peers. Diurnal periodicity is obvious in our measurement result shown as Figure 8. The incentive mechanisms can influence the peer’s downloading and seeding time implicitly to influence peer leave rate.
Measurement results show that the peer leave rate has

Table 2. Parameters, RMSE and R of fit results of peer arrival rate in 1-hour scale.
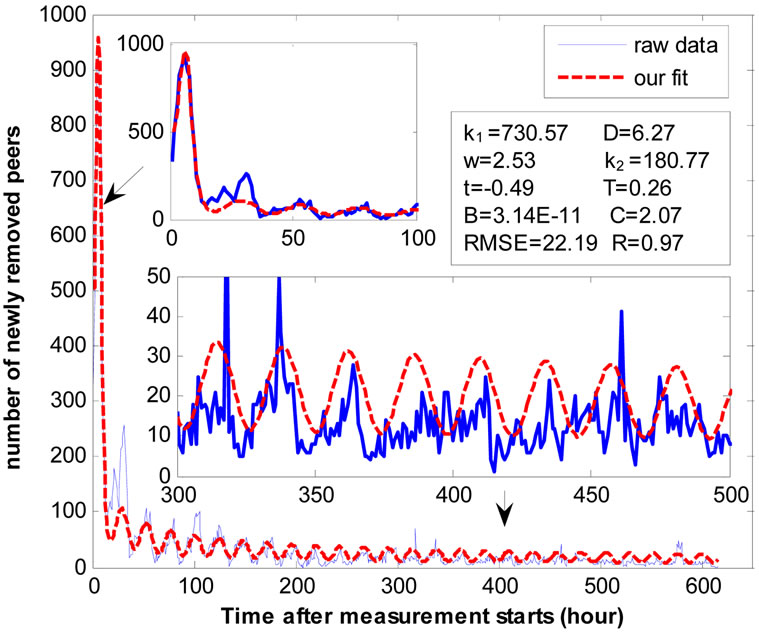
Figure 8. Peer leave rate of torrent # 1 in 1-hour scale.
the same growing trend with peer arrival rate. In this paper, we only consider the torrent popularity factor and the diurnal periodicity factor. The peer leave rate g(t) is given by Equation (7). The definition of the parameters is the same with as in (2).
 (7)
(7)
Figure 8 shows the fit result of our model to the second torrent selected in hour scale. The x-axis is the time after measurement starts. The y-axis is the number of leave peers during the hour. Apparently, our model is close to the actual measurement result.
4.2.3. Swarm Evolution
We define f(t) = l(t) − g(t) as the net increasing rate of peer population at time t. So the swarm population F(t) at time t is
 (8)
(8)
We calculate f(t) of the torrent #1 with the parameters given in Table 2 and Figure 9, then we fit the measurement results, as shown in Figure 9. The x-axis is the hours after measurement starts and the y-axis is the net increasing population of swarm at that moment.
We observed that for the three torrents, the swarm evolution can be divided into a fast growing stage, a dramatically shrinking stage, a sustaining stage and a slowly fading out stage in terms of f(t). We mark these stages in Figure 9. The stages are more apparent for the hot torrents than the cold ones. The fast growing stage is the time from the torrent published to the first zero-point of f(t). This stage is often very short. At this stage, lots of new peers continuously join into the swarm but have not yet finished downloading. Consequently, the population increases rapidly.
The dramatically shrinking stage is the time from the first zero-point of f(t) to a certain steady period. In this period, both peer arrival rate and peer leave rate decrease dramatically. As peers finish downloading and quit the swarm, the number of leaving peers is larger than that of incoming peers. Therefore, the swarm size experiences a fast decreasing process in this stage. Peer arrival rate and peer leave rate is dynamically balanced with obvious daily periodicity in the sustaining stage, resulting in a range of volatility of swarm size. Generally, with the departure of existing peers and the reduction of new peers, the swarm population decrease to zero gradually in the fading out stage. During this period, the replicas become rare until there is no complete copy of the file.
Based on the models, we deem that the users’ interest dominates the first two stages, while diurnal periodicity is decisive in the third stage. To verify this, we fit the peer arrival rate in the first three stages to the torrent #1, as shown in Figure 10. The x-axis is the time after the measurement starts (in 1-hour scale). The y-axis is the number of newly added peers during the hour. As shown in the Figure 10, in the growing stage and shrinking stage, the weight of user’s interest k1 is significantly lar-
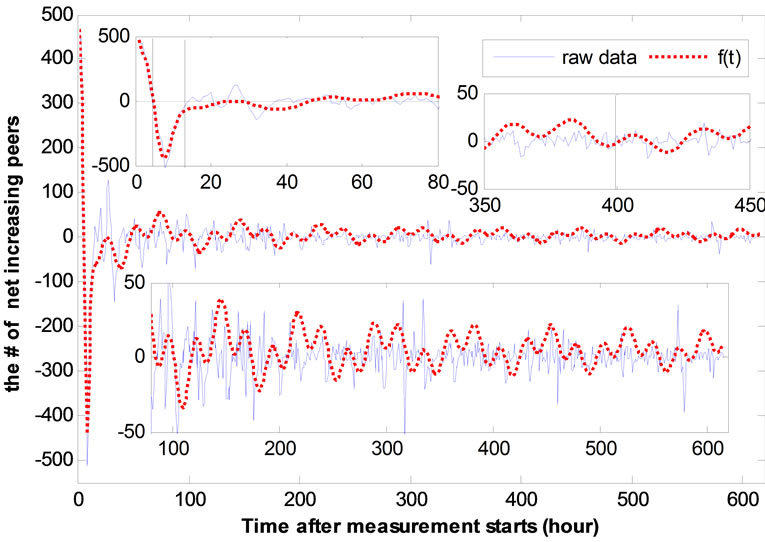
Figure 9. Net increasing rate of torrent # 1 in 1-hour scale.

Figure 10. Comparison of the parameters of the #1 torrent’s peer request rate in different stages.
ger than the weight of diurnal periodicity k2, and it goes to the opposite in the sustaining stage and fading out stage. The peer leave rate of the torrent #1 is similar (1440.73 compared to 490.95 in the first two stages and 2.56 vs. 729.21 in the third stage).
We speculate the reasons as follows: Once the torrent is published to the website, its interest groups will download it immediately, so the swarm size increase dramatically. Then, as these peers finished downloading, most of them quit the swarm, so the number of leaving peers increases. As the time goes by, the number of users interested in the torrent becomes smaller. Besides, the rank of the torrent drops in the website. Consequently, the number of peers who unintentionally download the torrent also significantly drops. This further decreases the number of incoming peers.
5. Conclusions
In this paper, we designed a hybrid BT measurement system with the combination of active and passive approaches incorporation existing BT protocols to get a comprehensive measurement dataset. Based on this, we examined the resource popularity and swarm evolution of BitTorrent system. We found that the resources in BT system appear obvious unbalanced distribution and hotspot phenomenon. More than half of users are likely use μTorrent and share large audio and video files. 74.6% of the torrents have no more than 1000 peers.
Users’ interest and diurnal periodicity are the main factors that influence the swarm evolution. We divide the torrent lifespan into a fast growing stage, a dramatically shrinking stage, a sustaining stage and a slowly fading out stage in terms of swarm population. We analyze the peer arrival rate, peer leave rate and swarm population of torrents with different population in 10-minute/1-hour/ 1-day scales. We propose an improved peer arrival rate model to describe the variation of the newly incoming peers. Comparison results show that modeling in 1-hour scale is more suitable and our model is much closer to the real data according to root mean square error and correlation coefficient. The time scale study and model evaluation methods can also be used in measurement analysis of other P2P systems.
6. Acknowledgements
This work is supported by the National Basic Research Program of China under Grant No. 2011CB302605, the National High-Tech Development 863 Program of China under Grant No. 2011AA010705, the National Natural Science Foundation of China under Grant No. 60903166, 61173145, the Fundamental Research Funds for Central Universities under Grant No. HIT.NSRIF.2010041.
REFERENCES
- J. A. Pouwelse, P. Garbacki, D. H. J. Epema and H. J. Sips, “The BitTorrent P2P File-Sharing System: Measurements and Analysis,” Proceedings of 4th International Workshop on Peer-to-Peer System, Ithaca, 24-25 February 2005, pp. 205-216. doi:10.1007/11558989_19
- G. Neglia, G. Reina and H. G. Zhang, “Availability in BitTorrent System,” Proceeding of 26th IEEE International Conference on Computer Communications, Anchorage, 2007, pp. 2216-2224.
- D. Erman, D. Ilie and A. Popescu, “BitTorrent Traffic Characteristics,” Proceedings of the International MultiConference on Computing in the Global Information Technology, Bucharest, 1-3 August 2006, pp. 42-48.
- P. Dhungel, X. Hei, D. Wu and K. W. Ross, “A Measurement Study of Attacks on BitTorrent Seeds,” Proceedings of IEEE International Conference on Communications, Kyoto, 2011.
- D. Y. Qiu and R Srikant, “Modeling and Performance Analysis of Bittorrent-Like Peer-to-Peer Networks,” Proceedings of SIGCOMM ‘04, Portland, 2004, pp. 367-378. doi:10.1145/1015467.1015508
- J. Pouwelse, P. Garbacki, D. Epema and H. Sips, “The Bittorrent P2P File-Sharing System: Measurements and Analysis,” Proceedings of IPTPS’05, Ithaca, 24-25 February 2005, pp. 205-216.
- L. Guo, S. Q. Chen, Z. Xiao, E. Tan, X. Ding and X. Zhang, “Measurements, Analysis, and Modeling of BitTorrent-Like Systems,” Proceedings of IMC’05, Berkely, 19-21 October 2005.
- K. Katsaros, V. P. Kemerlis, C. Stais and G. Xylomenos, “A BitTorrent Module for the OMNeT++ Simulator,” Proceedings of IEEE International Symposium on Modeling, Analysis & Simulation of Computer and Telecommunication Systems (MASCOTS ‘09), London, 2009.
- L. Ye, H. Zhang, F. Li and M. Su, “A Measurement Study on BitTorrent System,” International Journal of Communications, Network and System Sciences, Vol. 3 No. 12, 2010, pp. 916-924. doi:10.4236/ijcns.2010.312125
- D. Stutzbach, R. Rejaie and S. Sen, “Characterizing Unstructured Overlay Topologies in Modern P2P File-Sharing Systems,” IEEE/ACM Transactions on Networking, Vol. 16, No. 2, 2008, pp. 267-280.
- S. Saroiu, K. P. Gummadi and S. D. Gribble, “Measuring and Analyzing the Characteristics of Napster and Gnutella Hosts,” Multimedia Systems, Vol. 9, No. 2, 2003, pp. 170-184. doi:10.1007/s00530-003-0088-1
- L. Vu, I. Gupta, K. Nahrstedt and J. Liang, “Understanding Overlay Characteristics of a Large-scale Peer-to-Peer IPTV System,” ACM Transactions on Multimedia, Computing, Communication and Application, Vol. 6, No. 4, 2010, pp. 1-24. doi:10.1145/1865106.1865115
- Z. B. Guo and Z. D. Qiu, “Measurement and Modeling of the Peer-to-Peer Sharing Objects Popularity,” Journal on Communications, Vol. 30, No. 3, 2009, pp. 66-74.
- D. Erman and A. Popescu, “BitTorrent Request Message Models,” Proceedings of 3rd Swedish National Computer Networking Workshop, Halmstad, 23-24 November 2005.
- Y. Tian, D. Wu and K. W. Ng, “Modeling, Analysis and Improvement for BitTorrent-Like File Sharing Networks,” Proceedings of INFOCOM’06, Barcelona, 2006.
- http://www.suprnova.org
- S. Petrovic and P. Brown, “Fluid Model for eMule File Sharing System,” Proceedings of 4th European Conference on Universal Multiservice Networks (ECUMN ‘07), Washington DC, 14-16 February 2007, pp. 273-282. doi:10.1109/ECUMN.2007.21
- B. Fan, D. M. Chiu and J. C. S, Lui, “Stochastic Differential Equation Approach to Model BitTorrent-Like P2P Systems,” Proceedings of ICC ‘06, Istanbul, 2006, pp. 915-920.
- P. Li, J. C. S. Lui and Y. L. Xu, “A Stochastic Model for BitTorrent-Like Systems,” Proceedings of SIGMETRICS’08, New York, 2008, pp. 116-118. doi:10.1145/1375457
- M. Su, H. Zhang, B. Fang and N. Yan, “A Measurement Study on Swarm Evolution of BitTorrent,” Proceedings of IEEE International Conference on Cyber-Enabled Distributed Computing and Knowledge Discovery (CyberC 2012), Sanya, 2012, pp. 512-518.