Int'l J. of Communications, Network and System Sciences
Vol. 5 No. 7 (2012) , Article ID: 21324 , 11 pages DOI:10.4236/ijcns.2012.57050
Energy Efficient Content Based Image Retrieval in Sensor Networks
Electrical Engineering Department, UAE University, Al-Ain, UAE
Email: {qurban.memon, hend.alqamzi}@uaeu.ac.ae
Received April 25, 2012; revised June 12, 2012; accepted June 20, 2012
Keywords: Image Sensor Networks; Image Identification in Sensor Network; Camera Sensor Networks; Distributed Image Search
ABSTRACT
The presence of increased memory and computational power in imaging sensor networks attract researchers to exploit image processing algorithms on distributed memory and computational power. In this paper, a typical perimeter is investigated with a number of sensors placed to form an image sensor network for the purpose of content based distributed image search. Image search algorithm is used to enable distributed content based image search within each sensor node. The energy model is presented to calculate energy efficiency for various cases of image search and transmission. The simulations are carried out based on consideration of continuous monitoring or event driven activity on the perimeter. The simulation setups consider distributed image processing on sensor nodes and results show that energy saving is significant if search algorithms are embedded in image sensor nodes and image processing is distributed across sensor nodes. The tradeoff between sensor life time, distributed image search and network deployed cost is also investigated.
1. Introduction
Miniaturization in sensing and imaging technology has resulted in cost-effective solutions in industry, environmental monitoring and security applications. The current generation of low-power analog and digital electronics and radio transceivers (as tiny devices) has individually limited capabilities. But when they are deployed in a large number, they can wirelessly form ad hoc sensor networks. Such networks can be used effectively for various applications, such as object tracking, surveillance, environmental sensing and controlling, robotic applications, situational awareness in support of decision making, etc. The competitiveness in industrial market has caused a large deployment of sensor systems to achieve efficient production. Internet and newer smart technologies are adding a rising edge to change and growth to industries, cultures and businesses. According to a survey [1], the usage of sensor network applications is diverse: security applications 4%, industrial applications 3%, videoconferencing 5%, consumer and professional 37%, and office tools 51%. The revenue from this market has grown exponentially from 500 million dollars in 1996 to 4 billion dollars in 2008.
Monitoring applications usually involve deployment of hundreds or thousands of sensors over a region where some parameter such as pressure, sound, electromagnetic field, vibration, etc. is to be detected and monitored. For example, sensor networks can be used to track inventory assets, monitor and control home or office temperature, or other parameter in a perimeter. Each application has special requirements, which in turn determine the sensors’ size, type, method of deployment, and system configuration. Since the batteries of sensor nodes are difficult to be replenished during the course of a mission, it is essential for sensor networks to operate under energy-efficient architectures and protocols. Another problem is with volume of data traffic that increases if all sensor nodes respond to a gateway, which initiates queries about specific monitored regions.
There is always a need to group sensors or create zones of sensors in wide or close area systems to perform specific task like detecting intrusions or events, etc. The respective sensor deployment schemes are also dependent on the tasks assigned. Typically, image search algorithms within a zone of image sensors are based on centralized databases for image identification. As centralized storage grows, so does the complexity of image identification. The centralized storage has its inherent limitations related to the complexity of image search once images are received from image sensor nodes intermittently. In case images are to be backed up in a centralized storage intermittently, it creates privacy concerns as well, which makes this infrastructure less preferable.
Image search & identification algorithms exploiting smaller memories within image sensor nodes contain additional limitations like limited power supply, short communication range, high transmission failure rates, high communication delay rates, limited amount of memory and computational power. Thus, it may be said safely that issues emanating from deployment of diversified image sensors for different applications would be many. The first and foremost is the size of the storage of corresponding image sensor node. As sensor storage increases so is the local image identification complexity within that image sensor. The complexity of local image search is also affected by local battery power. In many cases, devices used for multimedia activities run out of battery power very quickly. Thus, there is a tradeoff in power consumption versus performance. Another issue is that the volume of traffic emanating from this local sensor node is expected to be high in absence of an efficient search algorithm. This increases cost per transmission of an image search result.
In this work, network traffic and processing cost caused by transmission of an image from a sensor network to the gateway is targeted. The concept of centralized storage (database) is set aside; instead smaller databases within sensors are exploited to cause reduction in network traffic. For this purpose, a sensor network based on distributed image search is investigated to optimize energy savings.
Sensor network applications can be classified into four classes based on the data delivery and communication pattern between the sensors and the gateway station [2]. In the “continuous” model, sensor nodes periodically report to the observer about a physical parameter. The second model is “event-driven”, where sensors send information only if an event of interest is detected. The third model is “observer-initiated” in which the observer sends an explicit request to specific sensors based upon the occurrence of an event. This can be viewed as a prescheduled observer-initiated model. The fourth model is called “hybrid” model where some or all of the above three models coexist in the same network. In this work, hybrid model (covering continuous, event-driven and observer-initiated models) would be used to detect, identify and send images to the gateway based upon an image query to image sensor network. Then energy efficiency is analyzed in storing, processing and transmission of images to the gateway.
The rest of the paper is organized as follows. Section 2 presents related work in literature. Section 3 discusses image retrieval parameters, especially image search algorithm used in sensor network. Section 4 presents simulation setup, energy models and results. Section 5 concludes the work.
2. Related Work
In literature, a lot of research work about sensor networks has been reported. For applications like airport security, the authors in [3] propose a perimeter intrusion detect systems (PIDS) using general packet radio service (GPRS) and code division multiple access (CDMA) dual-mode wireless sensor networks to deliver an optimal data transmission service with auto Shutdown mechanism. Intrusion detection and response in wireless mobile ad hoc networks is also investigated and surveyed in [4]. The authors in [4] argue that response schemes that are distributed and collaborative are likely to succeed in detecting the anomalies in the network. In another work [5], the authors realize the fact that the probability of detecting an intruder is a quality of service (QoS) parameter to use it as a trade-off between the amount of resources that a defender can muster and the QoS (in terms of probability of detection) that they get. The perimeter security of general large facilities such as airports, seaports and rail facilities has also been examined in [6], where the authors discuss a system architecture and design by using a multi-sensor approach including ground surveillance radars and cameras, to detect, assess and track perimeter incursions. The authors in [7] present the detection of an intruder moving through a polygonal space using a probabilistic sensor tasking algorithm on example layouts in which cameras sense the environment independently of one another.
In order to achieve energy efficiency, the authors [8] propose a two step distributed and energy efficient algorithm for collection of raw data in sensor networks by exploiting spatial correlation to reduce the communication energy in sensor networks with highly correlated data. In that, one sensor shares its raw data in the neighborhood and other sensors use this reference data to compress their observations by representing them in the form of mutual differences in order to minimize the number of reference transmissions, followed by minimizing the size of mutual differences. In another effort [9], the authors use an image transform and semi-reliable transmission to achieve energy conservation in order to provide a graceful tradeoff between the image quality and the sensor nodes’ lifetime. The authors in [10] propose a data collection method based on the analysis of surveillance data from sensors by dynamically partitioning sensors into clusters.
The sensor networks also inherit resource constraints like battery life, etc. To overcome such problems, a lightweight security model has been proposed in [11], where authors suggest that the model operates in the base station mode of sensor communication. A similar research effort has been reported in [5] to study the amount of money deployed for the security versus the quality of service trade-off for a family of structures. In another work [12], target localization in visual sensor networks is studied with respect to data rate and the directional sensing characteristics with limited field of view of cameras. In this work, the non-occupied areas in the cone are identified and studied followed by generation of the so-called certainty map of non-existence of targets. A full-view coverage model using camera sensor networks is proposed in [13]. Using this model, the authors propose an efficient method with a sufficient condition on the sensor density for full-view coverage in a random uniform deployment in any given camera sensor network.
Various models for intrusion detection can also be integrated to increase efficiency. The author in [14] discusses the integration of PIDS and different models of integration, and review prospects for increased use of standards in PIDS integration. In another research work, robotics has been integrated with security approaches to boost detection of intrusions. For example in [15], the authors argue that a system of robotic security platforms that respond in an adaptive fashion to disturbances represents a powerful new defensive tool to encounter various threats. Similarly, the authors in [16] have investigated detection of intrusions using a single robot that moves along the rectangular perimeter.
Using sensors, the authors in [17] present architecture of an intrusion detection application developed for border and perimeter security over off-the-shelf low cost sensors. Further, the authors claim developing algorithms for power-optimal self-organization, reliable message delivery, and energy efficient monitoring mechanisms. The real time analysis has been carried out in [18], where the authors present real-time intrusion prevention system that combines the merits of misbehavior-based and anomalybased detection.
For practical applications, the deployment of image sensors is increasing on daily basis to implement costeffective solutions. Along with deployment, it carries corresponding technological challenges. As an example, image search within an image sensor network with a centralized storage creates a serious network traffic problem. For example in [19], the authors investigate the impact of increasing number of query words on a number of image search engines like Google and Yahoo etc., and determine that the information retrieval effectiveness of image search engines decreases, when the number of query words increases. In another work [20], the authors combine novel statistical modeling techniques and the Word Net ontology to offer new approach to image search that uses automatic image tagging directly to perform image retrieval. For multimedia database search, the authors in [21] investigate image representations/ kernels derived from probabilistic models of images class and present a feature selection method to be used in reducing the dimensionality of the image representation.
In general, various strategies have been reported in literature to search images in distributed or centralized databases, but to the best of our knowledge approaches targeting energy-efficiency based image search and processing to reduce network traffic has not been reported in literature. In the following sections, such an environment is investigated.
3. Image Retrieval
In this section, the image retrieval at gateway node is investigated once sensors are placed within required perimeter for area monitoring. The important parameters in image retrieval include image storage, pre-processing of the image within a sensor, image search within a sensor network, image transmission to the gateway, etc. These are discussed as follows.
3.1. Image Storage and Processing
Image sensors typically have very low memories. Once deployed in an environment, their memories fill up very quickly based on sampling time set for image capture. In order to estimate available free memory, assume sampling time for the sensor is set at 1picture/sec, and sensor node contains maximum of 1150 pictures (each of size 176 × 144 resolution). This means that the time it takes to fill up a memory of a typical image is about T = 19 minutes and 10 seconds. In order to continue taking pictures and store them subsequently, either image is to be deleted or overwritten, or to be transmitted to the gateway, or be compressed to create more space, etc. In case, it is decided to create space in sensor memory, either of these options results in energy usage overhead. In this work, a trade off is investigated to optimize energy savings in sensor life time. This is investigated in section 4.
3.2. Image Search Algorithm
Image search requires matching of images or their representing features. In order to save energy of the sensor nodes, some image representing features that require few bytes of sensor storage, are to be used instead. The ScaleInvariant Feature Extraction Algorithm [22] is descriptive of the local region and may be used to generate continuous 128-dimensional feature vector by finding local orientation histograms of the image. These feature vectors of 128-dimensional vector are still computationally expensive to match. Instead, these features may be clustered hierarchically [23,24] for example, using K-means clustering technique. These clusters may be termed as QTerms, each occupying few bytes of the local sensor memory. Thus, during image search these QTerms are used to represent images for matching. These steps are summarized in Figure 1.
In the sensor network environment, the gateway sends query, for example in a habitat environment. The query contains these QTerms already calculated offline at the
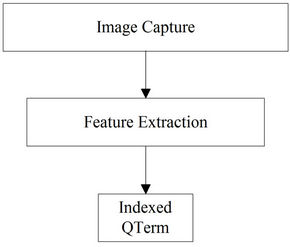
Figure 1. Energy-efficient image representation.
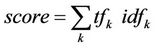
gateway, to be searched in local databases of the sensor nodes. At sensors, image matching is done between these QTerms and the ones representing the images, based on scores. The weight may be calculated using the following equation as [23,25,26]:
 where
where
 (1)
(1)
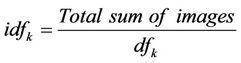
where tfk represents frequency of QTerm k in an image, and dfk represents number of images in which QTerm k occurs. The index k is over QTerms common to the query and local database image and dfk represents the document frequency of k. Thus, the image search proceeds in two stages:
1) In the first round, image search is done by matching only QTerms, and score calculated by each sensor node is transmitted to the gateway. This score counts few bytes.
2) In the second round, all of the scores received at the gateway are globally ranked. The second query consists of the top-m matches obtained through merging of these local scores and is sent to appropriate sensor nodes. The required “m” sensor nodes then transmit these images to the gateway.
This way, instead of each sensor responding to the query, only few sensors respond, reducing traffic on the link between sensors and their gateway. This in turn, increases energy savings of those sensor nodes which do not respond to the gateway in the second round.
3.3. Energy Savings Criteria
In this section, the objective to minimize energy consumed in retrieval of images from sensor nodes is highlighted. Since the life time of the wireless sensor node with battery is very low, therefore once deployed, their energy needs to be saved on various operational instances. These include minimization of energy usage on image search and transmission of images at every query from the gateway. The examples of the energy usage include active camera vs. standby; active processor vs. standby; active transmitter/receiver vs. standby, etc. Thus, total energy consumed in a sensor node is a function of energy consumed in camera, processor and communication with gateway, etc. Let us represent this consumed energy from image acquisition to image transmission as follows:
 (2)
(2)
where Ecam stands for energy consumed during image acquisition and is dependent upon active/standby mode of camera, image capture time, energy consumed in switching from standby to active mode, etc.; and may be written as:
 (3)
(3)
Eproc stands for energy consumed in the processor and is dependent upon active/standby mode of the processor, building Qterms, reading/writing the image, image search using or without Qterms, switching between standby and active mode, etc; and may be written as:
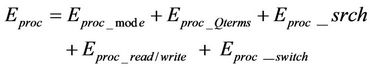 (4)
(4)
Ecom stands for energy consumed during communication between sensor node and gateway, and is dependent upon communication mode, switching between transmission and reception (Tx/Rx), reception of the query, transmission of image/Qterm reply, etc; and may be written as:
 (5)
(5)
The next logical step would be to explore minimizing either of the variables in Equations (3)-(5) to increase life time of the sensor. In other words, use of less number of terms in either of the Equations (3)-(5) for calculating total energy consumption in Equation (1) would help in increasing the life time of the sensor network. This is investigated further in simulations presented in the next section.
4. Simulation Setup
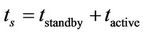
A C program simulator is used to analyze and examine the proposed approach that considers network traffic and the energy consumption of image sensor nodes. Based on coverage range of Imote2 image sensor nodes, a perimeter of size 8 m × 8 m is used with focus on monitoring the center at 5 m distance from image sensor. Using the geometry shown in Figure 2(a), a set of four image sensors is assumed, one at each corner of the perimeter. Thus, a one hop network is assumed and that there is no communication between sensors themselves. The image sensors have cameras with viewing angle of 62˚ in the direction of center of the perimeter, as shown in Figure 2(b). The radio transmission speed is set to 250 kb/s and the radio transmission range is set to 50 meters. These values are taken from typical commercial products available in the market, and used here for simulation purposes. The sensors are provided initially with energy amount of 200 Joules within a standard deviation of ±5% to allow for variation in startup energy typically found in sensors. The sensors’ memory has a capacity to store 1150 pictures within a standard deviation of ±10%. The standard deviation accounts for heterogeneity of image sensors and reflects variation in size of each image sensor memory. The simulation model considers pictures of the perimeter taken at regular intervals or driven by an event, such as motion.
4.1. Energy Model
In our simulations, the energy model is based on real sensor Imote2 hardware platform [27]. Sensors’ radio spends energy in transmitting and receiving packets. The simulation considers three kinds of packets; query packets received from the gateway requesting images with specified parameters called Request-Query, image packets transmitted by sensors that have the required images called Image-Packet, and transmitted image parameters from image sensors called QTerm_Reply. We assume that the packet length of the Request-Query received from the gateway and the transmitted picture parameters QTerm_Reply from the image sensor are of the same length, which is 48 bits (6 bytes), while the length of the transmitted image packet from the sensor is 202,752 bits. Considering the radio transmission speed of Imote2, which is 250 kb/s, the required time to send one QTerm_ Reply is (48 bits/250 kb/s) = 1.875 × 10⁻⁴ sec. The current consumption spent in sending this packet is 17.4 mA. The energy consumed in sending the QTerm_Reply is calculated as follows:
 (6)
(6)
where I is the consumed current, and V is the battery voltage, and t is the time needed to send a packet. Therefore, by substituting the calculated packet time, the current obtained from the data sheet of the image sensor, and assuming a new sensor battery with voltage of 3.6 V, the energy expended in transmitting the QTerm_Reply is 1.1745 × 10⁻⁵ Joules. Similarly, the energy expended in receiving Request-Query can be obtained using (6), but instead using the current withdrawn in the receiving mode as 19.7 mA. This calculates energy to be equal to 1.32975 × 10⁻⁵ Joules. Likewise, applying the same method, the energy spent in transmitting the requested image is 0.112752 Joules.
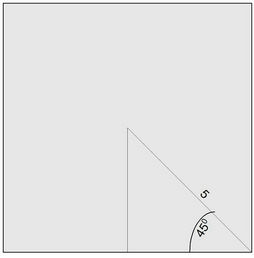 (a)
(a) (b)
(b)
Figure 2. (a) Part of perimeter; (b) Perimeter under investtigation.
On the other hand, the simulation also considers the energy expended by the camera. The camera has two modes; active and standby. Using the data sheet of the camera, the active camera withdraws 40 mW of power, while it spends 30 uW in the standby mode. The energy consumption is calculated using the following equation:
 (7)
(7)
where P is the consumed power and t is either the active time of the camera or the standby time. Note that the standby and active camera times are related to the sampling time as follows:
 (8)
(8)
Assuming the sampling time as 100 msec, the capture time (i.e., the active time) as 10 msec, then the standby time is 90 msec. Using equation (7), the energy consumed by an active camera is 4 × 10⁻⁴ Joules, whereas the energy spent by a standby camera is 2.7 × 10⁻⁶. As a summary, the parameters used in simulations based on Imote2 platforms are summarized in Table 1.
4.2. Simulation & Analysis
The energy expended in the process of taking a picture, processing, storing and sending it to the gateway may be depicted as a flow graph shown in Figure 3. The simulations consider slight variations in this flow graph. Each case is simulated, discussed and analyzed in this section.
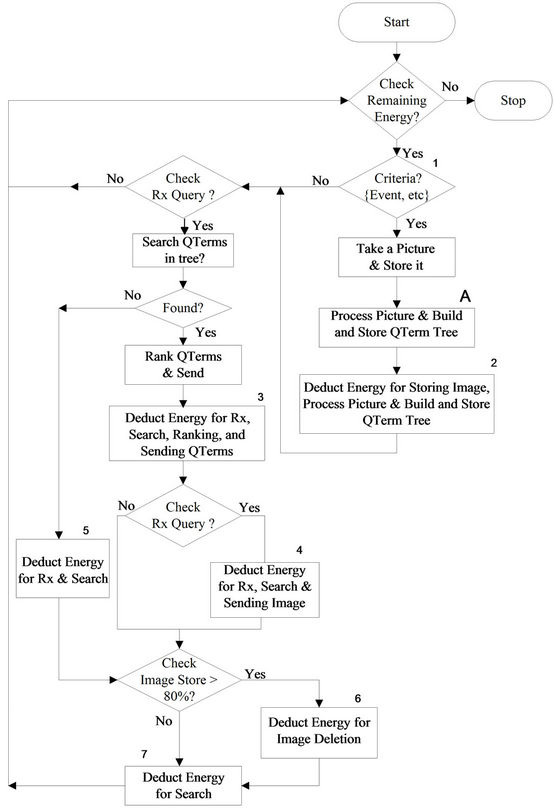
Figure 3. A flow graph for energy calculation in image retrieval from sensor network.
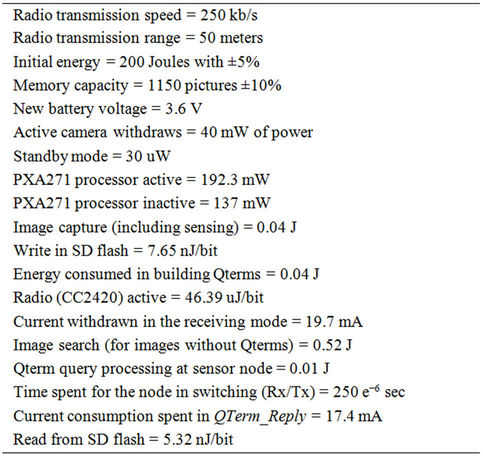
Table 1. Imote2 parameters used in simulations.
The Figure 3 includes a criterion to take a picture as an input; and an optional block marked as “A” to be used as a variation in simulations. The numbers marked in the figure represent energy points, where energy is to be deducted for the actions performed by the sensors. A typical value of 80% image store is used by sensor boards before deleting images to create space for storing a new image.
First simulation setup: In this setup, three cases are discussed each with slight variations in Figure 3. The objective behind these variations is to examine impact of image capture, storage, processing and transmission of the images versus sensor life time.
Case 1: In this case, there are three different scenarios each involves handling gateway query using Qterms stored in the memory of the sensor node. In the first scenario, each image sensor takes pictures typically every 100 msec (sampling time), stores the picture, and waits to receive a request-query from the gateway. Once the query is received as a broadcast, each sensor searches for the requested image within its memory. If it is found, then energy is deducted for receiving the gateway query, searching the stored image, and sending it wirelessly to the gateway. Our simulator uses a robust random number generator that uniquely generates queries randomly from the gateway and broadcast it to all the sensors.
The second scenario differs from the first scenario in the criterion to capture the image. Here, the image sensor takes pictures based on an event driven activity only. Similar to the gateway queries, the event is simulated by a random number generator, where the value of zero indicates no movement and the value of one indicates a moving object within range of the image sensor.
The last scenario simulates the case where the image sensor takes pictures typically every 100 msec and also during an event driven activity. However, the time between any two picture capture is 100 msec. The results are shown in Figure 4, where second case shows larger sensor life. This energy savings is mainly due to standby mode of camera as well as the processor when no event takes place.
Case 2: In this case, there are four scenarios each of which does not involve processing of the image for building QTerms (i.e., the block marked as “A” in Figure 3 is not used). This also means that searching of the image due to gateway query does not involve QTerms. In the first scenario, each image sensor takes a picture at fixed sampling time (say 100 msec), and then it sends directly to the gateway without storing it. Thus, energies for active and standby camera; and wireless transmission are deducted.
The second scenario considers the event driven activity, where the image sensor only takes picture if movement is detected and without storing the image, it sends the image directly to the gateway. The major energy cost is the direct transmission of the image to the gateway.
Note that in both setups, no query is generated by the gateway. In the third scenario, each image sensor takes pictures at fixed sampling time, stores the image, and sends it on query. Thus, the energy is deducted for active and standby camera, for memory storage, for receiving query, for searching the image, and for sending the image if found. The last scenario simulates image sensors that take pictures only on an event driven activity, store the image, and send it to the gateway on query. Similar to the third scenario, the image is not processed for building and storing QTerm tree. In this case, the energy is consumed only if an even driven activity takes place. Again, the expected major energy cost is the direct transmission of the image minus energy savings due to standby mode of the camera. This increases network lifetime as the active camera time is much less than the standby camera time. The results are shown in Figure 5, where the second case shows longer sensor life cycle. Compared to case 1, the scenarios in this case do not exploit energy savings (due to QTerms) as QTerm search requires less computational time and that the images are not sent when there is no need at the gateway.
Case 3: In the third case, similar scenarios as in the second case are considered but with a varying initial energy and memory capacity to account for heterogeneous image sensors. Thus, the initial energy ranges from 190 Joules to 210 Joules, while the storage capacity ranges from 1035 stored pictures to 1265 stored pictures. The results are shown in Figure 6, where the second scenario shows longer sensor life cycle. The results of case 2 and case 3 can be related statistically, as both consider the similar energy costs. The results from first simulation setup (Figures 4-6) suggest that building QTerm tree
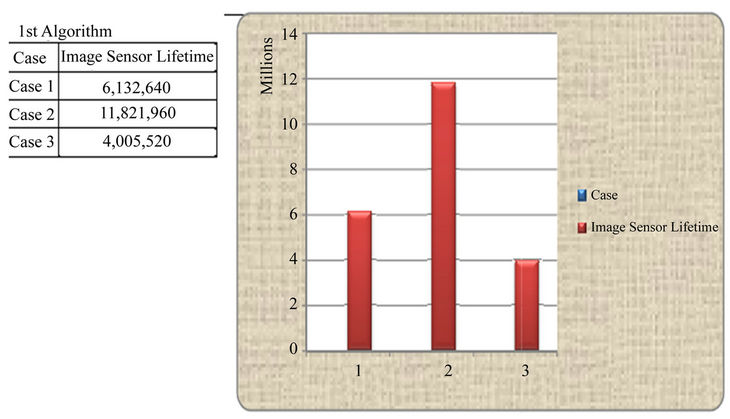
Figure 4. Life time of each sensor for the 1st case.
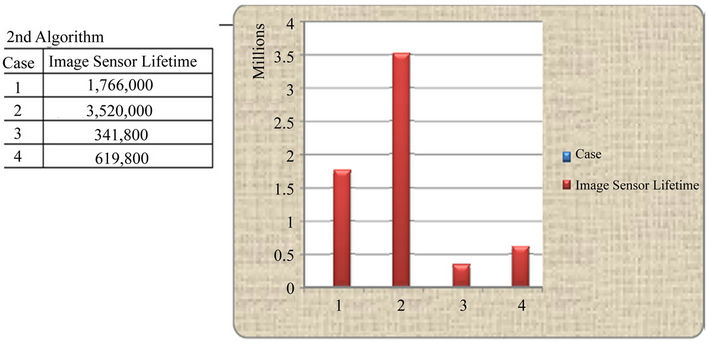
Figure 5. Life time of each sensor for the 2nd case.
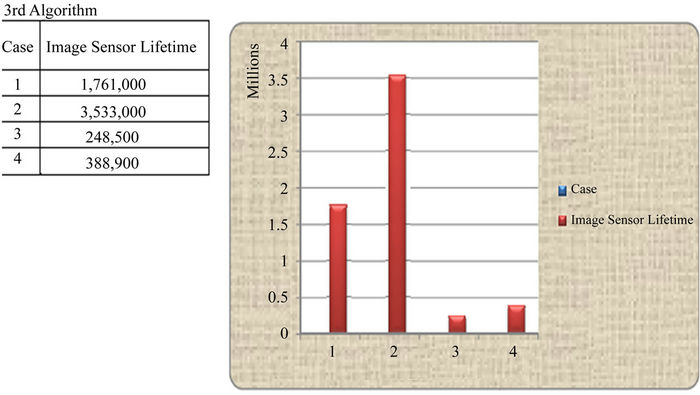
Figure 6. Life time of each sensor for the 3rd case.
has significant impact in increasing the life time of the sensor node in addition to increased standby mode of camera and the processor. In next simulation setup, QTerm based query is further investigated to yield additional energy savings.
Second simulation setup: In this setup, the objective is to further investigate the increase in life time of the sensor nodes by exploiting second term “Eproc” and third term “Ecom” in Equation (2). Specifically, the terms Eproc-mode, Eproc_read/write, Eproc-srch, Eproc-switch in Equation (4) and Ecom-switching, Ecom-query, Ecom-image/QTerm-tx in Equation (5) are exploited to contribute to the further reduction in energy consumption of the sensor node. It will be shown that this also results in increased memory space of the sensor memory with a tradeoff in deployment cost. Here, it is considered that sensors are grouped into sensor zones marked as clusters. For example, four sensors belong to the same overlapping sensing range, and may form a cluster, as shown in Figure 7. The variation in center of viewing angle of each sensor node per cluster is considered to be very small to ensure that all nodes within a cluster have nearly similar viewing angle. For simplicity, it is assumed that each corner of the perimeter has same deployment geometry of four sensors. Since all sensors within that cluster have similar viewing angle, therefore it is more likely that all sensor nodes within that cluster capture similar images. It seems, thus, wasteful for all four sensor nodes (for example) to store the same image with slight orientation variations. If a mechanism is chosen (to be commonly adopted by each sensor node in the cluster) where sensor nodes process the image independently and then store 1/4 of the total image size, then this may help each sensor node to increase available free storage capacity by four. Of course, this processing of the image (resulting in 1/4 of the image size) will consume further energy of the sensor, but this is offset by many advantages. The processing mechanism and resulting benefits are discussed below.
Image processing mechanism: The author in [28] proposed discrete wavelet transform (DWT) to decompose a
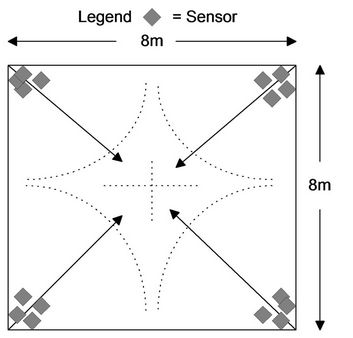
Figure 7. Sensors placed for second simulation setup.
signal (i.e., image in our case) by passing them through filters. Generally, the two-dimensional image is decomposed into n number of resolution levels, each with four sub-bands (LL, HL, LH, HH), where L and H stand for low-pass information and high-pass information. Mathematically, this decomposition may be described as follows [28]:
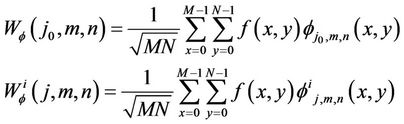 (9)
(9)
where f(x, y), φ(j0, m, n) and Wφ (j0, m, n) represent 2-D image, wavelet used and wavelet transformed image sub-band (LL) respectively. The 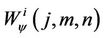 represent LH, HL, and HH sub-bands respectively, for different values of i. The 2-D image can be reconstructed using the following [28]:
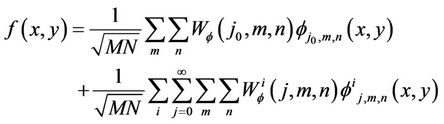 (10)
(10)
In second simulation setup, the reconstruction of the image from its sub bands is conceived to be done at the gateway. There exist numerous methods like waveletbased multi-view fusion [29,30] that combines the complementary directional information from all available views into a single volume. As gateway function analysis is outside the scope of this paper, therefore it is not discussed further here. The analysis is restricted to energy savings pertaining to sensor nodes only.
Typically, the LL sub-band contains low frequency features (like shape, etc.) and is assigned higher priority while HH contains high frequency features (like edges, details, etc.) and is assigned lower priority. Each of these is 1/4 of the original image. Thus, the sensor nodes within the same cluster capture the same picture and then process it in order to store one of these four sub-bands. Out of these four sensor nodes, one sensor will work as a main node within that cluster. The functionality within a cluster during capturing and storing a picture varies between main and other nodes, and is shown in Figure 8. In fact, the role of the main node differs in many ways from other sensor nodes, and is conceived to be based on energy level of the sensor:
1) It stores LL sub band, while others store HL, LH, and HH respectively.
2) During the first round of image search query from the gateway, only main node within each cluster responds to the gateway after it conducts image search using QTerm and ranks it. This also means that QTerm is developed using 1/4 of the total image size.
3) All sensors respond to the second round of query if response during first round of query is selected by the gateway.
There may be many ways to select the main node within the cluster, but the one considered in this approach is like the following:
1) During initialization, the main node and other nodes are selected randomly from the cluster (like LL = main; HL = node 2; LH = node 3; HH = node 4).
2) The sensors participating in second round of query recalculate remaining energy, and send it to the gateway as part of the image transmission.
3) The gateway selects the node with highest energy as main node and the one with lowest energy as node 4 and updates its broadcast table. The remaining nodes in the cluster are assigned randomly.
This way, the main node role is likely to change from one sensor to another during intervals and thus the energy level is balanced amongst all nodes within the cluster.
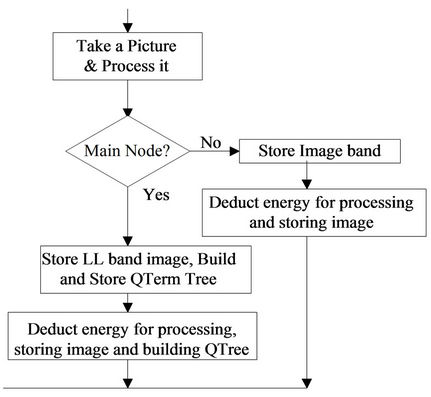
Figure 8. Flow graph for cluster of nodes—for storing images only.
Compared to the first simulation setup, this setup has the following main differences:
1) In the first simulation setup, broadcast is used during first query, where as multicast (to only main nodes) is used in the second simulation setup. Thus, only one sensor node responds to the first round of query.
2) Four times more sensors are required to be deployed per same perimeter coverage.
3) The gateway responsibilities increase: a) group subbands to reconstruct original image b) assigning responsibilities to nodes in each cluster.
The benefits of the second simulation setup can be accumulated as:
1) Less traffic on the network (during first round of query)
2) Main node assignment based on energy level of the sensor nodes results in more standby time for sensor nodes that are not main node.
3) Storing only 1/4 of the actual image in sensor nodes results in increase in storing capacity of the sensor node. In turn, this decreases the number of image deletions per sensor node at any given time, etc.
In order to stop the simulation, a criterion based on remaining energy in any of the sensor nodes was used as shown in Figure 3. The simulation results of this setup are shown in Table 2. The Table 2 shows total images taken and remaining energy in sensor nodes. It is evident from results that leftover energy within sensor nodes remains nearly balanced in each cluster.
In all of the simulations, it is clear that there is a
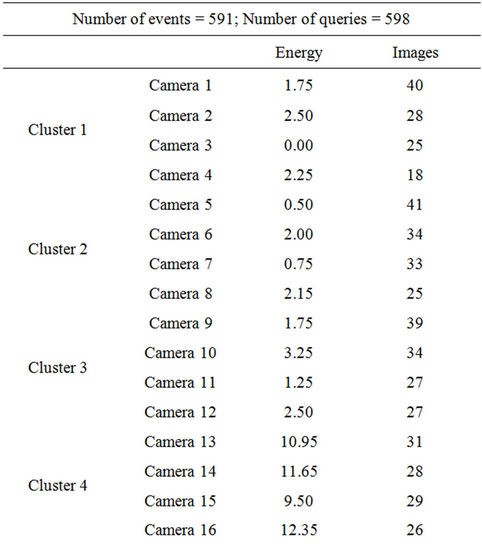
Table 2. Results of simulation setup.
tradeoff between transmission traffic on the network and energy efficiency of image sensors. Clearly, if image sensors have low memory and low computational power, it may be better to transmit image(s) to the gateway without processing them on the sensor node. But this generates a lot of traffic on the network even when the transmitted image is required by the gateway or not. Such a scenario will also require the gateway to search image in its entire centralized database. As discussed before in section 2, such an image search is usually of higher complexity resulting in higher search time. On the other hand, if sensor nodes have relatively higher memory and relatively more computational power, which is normal in current product line, then it is advisable that each sensor node performs local processing and transmits only when the gateway initiates image search query. This network setup leads to reduced network traffic and allows for higher network scalability. The results of both simulation setups show that distributed image processing and search gives increased sensor life time.
5. Conclusion
The network traffic and energy efficiency of image sensors have been analyzed with respect to a perimeter with a typical size of 8 m × 8 m with image sensor nodes placed on its corner for event based or continuous monitoring of the area. Three scenarios were considered to send images to the gateway. Three key factors were identified in such monitoring: network traffic, energy efficiency, and number of sensors placed on the perimeter. It was found out that tradeoff between sensor network traffic and energy efficiency is significant when the number of sensor nodes increases to enable distributed image processing and search.
REFERENCES
- D. M. Flournoy, “The Broadband Millennium: Communication Technologies and Markets,” International Engineering Consortium, Chicago, 2004.
- S. Tilak, N. Abu-Ghazaleh and W. Heinzelman, “A Taxonomy of Wireless Micro-Sensor Network Models,” ACM SIGMOBILE Mobile Computing and Communications Review, Vol. 6, No. 2, 2002, pp. 28-36.
- Y. h. Liu, C. Li, Y. He, J. Wu and Z. Xiong, “A Perimeter Intrusion Detection System Using Dual-Mode Wireless Sensor Networks,” Second International Conference on Communications and Networking, Shanghai, 22-24 August 2007, pp. 861-865. doi:10.1109/CHINACOM.2007.4469520
- A. Mishra, K. Nadkarni and A. Patcha, “Intrusion Detection in Wireless Ad Hoc Networks,” IEEE Wireless Communications Magazine, Vol. 11, No. 1, 2004, pp. 48- 60.
- S. Olariu and J. V. Nickerson, “Protecting with Sensor Networks: Perimeters and Axes,” IEEE Military Communications Conference, Vol. 3, 2005, pp. 1780-1786.
- S. Hennin, G. Germana and L. Garcia, “Integrated Perimeter Security System,” IEEE Conference on Technologies for Homeland Security, Woburn, 16-17 May 2007, pp. 70-75. doi:10.1109/THS.2007.370022
- P. Skraba and L. Guibas, “Energy Efficient Intrusion Detection in Camera Sensor Networks,” Proceedings of the IEEE International Conference on Distributed Computing in Sensor Systems, Springer-Verlag, 18-20 June 2007, pp. 309-323.
- S. Sharafkandi, D. Du and A. Razavi, “Distributed and Energy Efficient Collection of Raw Data in Sensor Networks,” Technical Report, University of Minnesota, 2010.
- V. Lecuire, C. Duran-Faundez and N. Krommenacker, “Energy-Efficient Image Transmission in Sensor Networks,” International Journal of Sensor Networks, Vol. 4 No. 1-2, 2008, pp. 37-47. doi:10.1504/IJSNET.2008.019250
- C. Liu, K. Wu and J. Pei, “An Energy-Efficient Data Collection Framework for Wireless Sensor Networks by Exploiting Spatiotemporal Correlation,” IEEE Transactions on Parallel and Distributed Systems, Vol. 18, No. 7, 2007, pp. 1010-1023. doi:10.1109/TPDS.2007.1046
- S. Avancha, et al., “Secure Sensor Networks for Perimeter Protection,” Computer Networks, Vol. 43, No. 4, 2003, pp. 421-435. doi:10.1016/S1389-1286(03)00352-9
- M. Karakaya and H. Qi, “Distributed Target Localization using a Progressive Certainty Map in Visual Sensor Networks,” Ad Hoc Networks, Vol. 9, 2011, pp. 576-590. doi:10.1016/j.adhoc.2010.08.006
- Y. Wang and G. Cao, “On Full-View Coverage in Camera Sensor Networks,” Proceedings of IEEE on INFOCOM, Shangahi, 10-15 April 2011, pp. 1781-1789.
- S. Dewar, “Opportunities for Increased Use of Standards in the Integration of Perimeter Intrusion Detection Systems,” 42nd Annual IEEE International Carnahan Conference on Security Technology, Prague, 13-16 October 2008, pp. 305-311. doi:10.1109/CCST.2008.4751319
- H. Everett, “Robotic Security Systems,” IEEE Instrumentation and Measurement Magazine, Vol. 6, No. 4, 2003, pp. 30-34. doi:10.1109/MIM.2003.1251480
- X. n. Liang and Y. Xiao, “Capturing Intrusions by Mobile Robot in Rectangular Perimeter,” IEEE International Conference on Information and Automation, Harbin, 20-23 June 2010, pp. 1404-1409. doi:10.1109/ICINFA.2010.5512096
- The Smart Detect WSN Team, “Smart Detect: An efficient WSN implementation for intrusion detection,” Second International Conference on Communication Systems and Networks, 18 March 2010, pp. 1-2.
- R. Koller, et al., “Anatomy of a Real-Time Intrusion Prevention System,” International Conference on Autonomic Computing, Chicago, 2-6 June 2008, pp. 151-160. doi:10.1109/ICAC.2008.24
- F. Uluc, E. Emirzade and Y. Bitirim, “The Impact of Number of Query Words on Image Search Engines,” International Conference on Internet and Web Applications and Services, Morne, 13-19 May 2007, p. 50. doi:10.1109/ICIW.2007.61
- R. Datta, et al., “Toward Bridging the Annotation-Retrieval Gap in Image Search,” IEEE Multimedia, Vol. 14 , No. 3, 2007, pp. 24-35. doi:10.1109/MMUL.2007.67
- T. Evgeniou, et al., “Image Representations and Feature Selection for Multimedia Database Search,” IEEE Transactions on Knowledge and Data Engineering, Vol. 15, No. 4, 2003, pp. 911-920. doi:10.1109/TKDE.2003.1209008
- D. Lowe, “Distinctive Features from Scale-Invariant Keypoints,” International Journal of Computer Vision, Vol. 60, No. 2, 2004, pp. 91-110. doi:10.1023/B:VISI.0000029664.99615.94
- D. Nister and H. Stewenius, “Scalable Recognition with a Vocabulary Tree,” IEEE Conference on Computer Vision and Pattern Recognition, Vol. 2, 2006, pp. 2161-2168.
- J. Sivic and A. Zissermann, “Video Google: A Text Retrieval Approach to Object Matching in Videos,” IEEE Conference on Computer Vision and Pattern Recognition, Nice, 13-16 October 2003, pp. 1470-1477.
- R. Baeza-Yates and B. Ribeiro-Neto, “Modern Information Retrieval,” ACM Press, New York, 1999.
- J. Philbin, et al., “Object Retrieval with Large Vocabularies and Fast Spatial Matching,” IEEE Conference on Computer Vision and Pattern Recognition, Minneapolis, 17-22 June 2007, pp. 1-8. doi:10.1109/CVPR.2007.383172
- http://www.memsic.com/products/wireless-sensor-networks/sensor-boards.html
- S. Mallat, “A Wavelet Tour of Signal Processing,” 2nd edition, Academic Publishers, Leiden, 1999.
- J. L. Rubio-Guivernau, et al., “Wavelet-Based Image Fusion in Multi-View Three-Dimensional Microscopy”, Bioinformatics, Vol. 28, No. 2, 2011, pp. 238-245.
- V. Castelli and L. Bergman, “Image Databases: Search and Retrieval of Digital Imagery,” John Wiley and Sons, New York, 2002.