Int'l J. of Communications, Network and System Sciences
Vol. 5 No. 6 (2012) , Article ID: 19655 , 11 pages DOI:10.4236/ijcns.2012.56042
QoE Assessment of Group Synchronization Control Scheme with Prediction in Work Using Haptic Media
Department of Scientific and Engineering Simulation, Nagoya Institute of Technology, Nagoya, Japan
Email: huang@mcl.nitech.ac.jp, {ishibasi, fukushima, shinji}@nitech.ac.jp
Received April 11, 2012; revised April 27, 2012; accepted May 11, 2012
Keywords: Group Synchronization Control; Prediction Control; Haptic Media; Remote Drawing Instruction; Play with Building Blocks; Collaborative Work; QoE; Assessment
ABSTRACT
This paper proposes a group synchronization control scheme with prediction in work using haptic media. The scheme adjusts the output timing among multiple terminals and keeps the interactivity high. It outputs position information by predicting the future position later than the position included in the last-received information by a fixed amount of time. It also advances the output time of position information at each local terminal by the same amount of time. We deal with two different types of work using haptic media so as to demonstrate the effectiveness of the scheme. We assess the output quality of haptic media for the two types of work subjectively and objectively by Quality of Experience (QoE) assessment. We further clarify the relationship between subjective and objective assessment results.
1. Introduction
In networked haptic environments, since users can touch and move objects by manipulating haptic interface devices, we can largely improve the efficiency of collaborative work and immerse ourselves in playing networked games [1]. Therefore, haptic media are used in various fields such as the medical, artistic, and education fields [2-6]. However, when a haptic media stream is transferred over the Internet, the output quality of the stream may be seriously degraded owing to network delay, delay jitter, and packet loss; thus, Quality of Experience (QoE) [7] may be seriously deteriorated [8]. For instance, the efficiency of the collaborative work and the fairness of the competitive work may be degraded if users watch different screens from each other owing to the network delay and delay jitter [9-13].
To solve this problem, it is necessary to carry out group (or inter-destination) synchronization control [14], which adjusts the output timing of haptic media among multiple terminals. In [15], the group synchronization control can achieve high efficiency of the work while keeping the fairness in good condition. In [16], the efficiency of the server terminal can be improved greatly at the expense of slight deterioration in that of the client terminal.
However, the group synchronization control degrades the interactivity slightly since the output time of each media unit (MU), which is the information unit for media synchronization, at each local terminal is delayed in order to adjust the output timing among terminals.
Prediction is one of methods which can improve the interactivity [17]. The prediction control in [17] predicts the future (later than the output time of the last-received MU) position of a free-flying robot. We here employ the prediction control to improve the interactivity.
However, if we simply combine the group synchronization control with the prediction control, the prediction control is exerted after carrying out the group synchronization control. In this case, each local terminal predicts its future position, and the prediction error is observed between the predicted position and the actual position which is buffered. Hence, the operability of the haptic interface device at each local terminal is not good. To solve this problem, we propose a group synchronization control scheme with prediction for work using haptic media. The scheme adjusts the output timing among multiple terminals and keeps the interactivity high. It outputs position information by predicting the future position later than the position included in the last-received MU by a fixed amount of time. It also advances the output time of position information at each local terminal by the same amount of time. Then, we implement the proposed scheme in two types of work (remote haptic drawing instruction [18] and collaborative haptic play with building blocks [19]) which have different configurations, force calculation methods, and transmission rates from each other. In the remote haptic drawing instruction, an instructor can teach a learner at a remote location how to draw figures while the sense of force is transmitted in two-way between the instructor and learner terminals. In the collaborative haptic play with building blocks, two users can pile up building blocks collaboratively to build a doll house by manipulating haptic interface devices. In this paper, we carry out QoE assessment subjectively and objectively [20] to investigate the effects of the scheme, and we also investigate the relationship between subjective and objective assessment results.
The remainder of this paper is organized as follows. Section 2 describes the two types of work using haptic media. Section 3 proposes the group synchronization control scheme with prediction. Section 4 explains the assessment methods, and assessment results are presented in Section 5. Section 6 concludes the paper.
2. Work Using Haptic Media
This section gives an outline of the two types of work (i.e., the remote haptic drawing instruction and the collaborative haptic play with building blocks).
2.1. Remote Haptic Drawing Instruction
The remote haptic drawing instruction enables navigation of brush stroke while an instructor and a learner feel the sense of force interactively through a network (see Figure 1). Each of the instructor and learner terminals has the PHANToM Omni (called PHANToM here) [21] as a haptic interface device. Each user draws figures with PHANToM, which is considered as a paintbrush, on a canvas composed by computer graphics (CG) in a 3-D virtual space. The two users’ paintbrushes are pulled toward each other by attractive force which is proportional to the distance between their paintbrush positions.
We employ a Peer-to-Peer (P2P) model which consists of the instructor terminal and the learner terminal. The position information of PHANToM is transmitted between the instructor and learner terminals. For the functions of each terminal, the reader is referred to [18]. The transmission rate of position information and the rendering rate are 30 Hz at each terminal. The frequency of the servo loop [22] for input and output of PHANToM position information is 1 kHz.
2.2. Collaborative Haptic Play with Building Blocks
By manipulating PHANToMs, two users pile up building blocks collaboratively to build a dollhouse in a 3-D virtual space which is surrounded by walls, a floor, and a ceiling [19] (see Figure 2). The dollhouse consists of 26 blocks (i.e., objects). We carry out collision detection among the building blocks, the cursors (each cursor is the position which a user tries to touch or is touching with
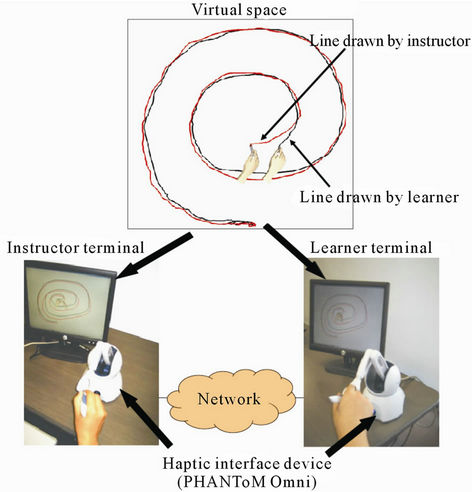
Figure 1. System configuration of remote haptic drawing instruction.
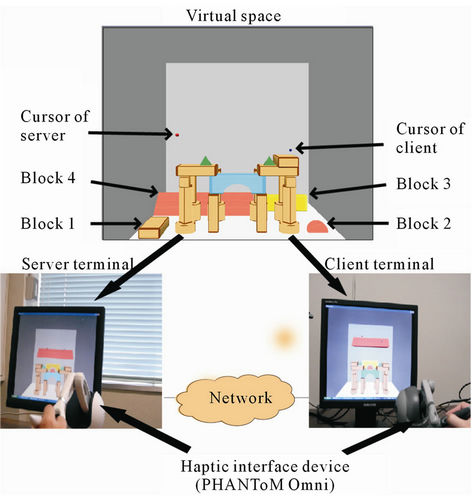
Figure 2. System configuration of collaborative haptic play with building blocks.
his/her haptic interface device), and the walls, floor and ceiling of the virtual space. Each user can touch a block by manipulating PHANToM. The user can lift and move a block by pressing the button of the PHANToM stylus while the cursor of PHANToM is touching the block.
In our previous study, we dealt with three cases of collaborative play [19]. In one case, the two users pile up blocks by holding the blocks together. In another case, the users pile up blocks alternately by holding the blocks separately. In the other case, one user lifts and moves each block from the floor to a place, and hands the block to the other user, who receives it and then piles it up to build the dollhouse. As a result, we found that the operability of PHANToM in the first case is the highest among the three cases. Therefore, in this paper, we deal with only the first case.
When the two users pile up a block together, the weight of the block is divided to the users. The resultant force F acting on the block is calculated as follows.
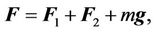
where F1 is the force that one of the two users exerts to the block, and F2 is the force that the other user exerts to the block. The weight m of each block is set to 5 g, and the gravitational acceleration g in the virtual space is assumed to be 9.8 m/s2. The block is moved in the direction of the force F. The reaction forces applied to the two PHANToMs are  and
and . F1 and F2 are calculated by using the spring-damper model [22].
We employ a client-server model which consists of the client terminal and the server terminal. Each terminal transmits MUs to the other terminal (the MUs are also stored locally for group synchronization). Each MU includes the information about the stylus button (ON or OFF), the position information of the cursor, and the position information of the i-th block (1 ≤ i ≤ 26). The client and server terminals save the position information of each block which is transmitted from the server and client terminals, respectively. When each terminal receives an MU which contains the position information of the i-th block, the terminal updates the position of the i-th block.
When the server terminal updates the position of the i-th block, the position of the block is set to the middle between the position of the server terminal’s i-th block and that of the client terminal’s i-th block. When the client terminal updates the position of the i-th block, it sets the position of the block to the position of the server terminal’s i-th block.
For the functions of the server and client terminals, the reader is referred to [23]. The transmission rate of position information and the rendering rate are about 60 Hz at each terminal. The frequency of the servo loop for input and output of PHANToM position information is 1 kHz.
3. Group Synchronization Control Scheme with Prediction
We adopt the distributed control scheme [24] for group synchronization control as in [25] for the remote haptic drawing instruction. This is because the remote haptic drawing instruction is realized based on a P2P model. Since the collaborative haptic play with building blocks is based on a client-server model, we adopt the synchronization maestro scheme [26], which is a centralized control scheme, to synchronize terminals to each other. The function of the synchronization maestro is implemented at the server terminal in this paper. We also employed the distributed control scheme in the collaborative haptic play with building blocks. As a result, we found that assessment results are almost the same as those in the case where the synchronization maestro scheme is used. Because the difference between the distributed control scheme and the synchronization maestro scheme is only in how to determine the output timing, we explain the distributed control and the difference between the two schemes below.
In the distributed control scheme, when each terminal receives the first MU, the terminal determines the output timing of the MU by using the Virtual-Time Rendering (VTR) algorithm [27], which dynamically changes the buffering time of MUs according to the network delay jitter. Then, it notifies the other terminal of the information about the output timing. After the beginning of the output, when the output timing at the terminal is modified by the VTR algorithm, the terminal notifies the other terminal of the information about the modified output timing. Also, when the terminal receives a constant number of consecutive MUs each of which has arrived earlier (or later) than its target output time [27], at which the MU should be output, it inquires the other terminal whether the output timing should be modified if it has not transmitted any information to the other terminal for those MUs at all.
Each terminal determines the reference output timing [14] from among the notifications, and gradually adjusts its output timing to the reference output timing. This paper handles a method which selects the later output timing from among two output timings as the reference output timing. Thus, we achieve the group synchronization by adjusting the output timing.
In the synchronization maestro scheme, each terminal notifies the synchronization maestro of the information about the modified output timing. When the synchronization maestro receives the information about output timing from each terminal, it determines the reference value of the output timing as the reference output timing, and multicasts the information about the reference output timing to all the terminals. Each terminal gradually adjusts its output timing to the reference output timing.
The proposed scheme (i.e., the group synchronization control scheme with prediction) outputs position information by predicting the future position later than the target output time of last-received MU by Tpredict (≥ 0) milliseconds (ms) to keep the interactivity high. For simplicity, we use the first-order prediction [28] in the scheme. The scheme also advances the output time of each MU at each local terminal by Tpredict ms.
In the first-order prediction, the predicted position P(t + Tpredict) is the position at the future time which is Tpredict ms later than the target output time t of the last-received MU.The predicted position P(t + Tpredict) is calculated as follows.
 where δ is the time interval between succeeding two MUs, and P(t) is the position included in the MU whose target output time is t.
  is the position included in the MU whose target output time is
 .
.
Since the tracks of PHANToM cursors in the collaborative haptic play with building blocks are almost the same as those in the remote haptic drawing instruction, we explain the proposed scheme only in the remote haptic drawing instruction. Displayed images in a scheme which carries out only the group synchronization control and the group synchronization control scheme with prediction are shown in Figures 3 and 4, respectively. We obtain the displayed images in Figure 4 by applying the prediction to those in Figure 3. Figures 3(a) and (b) indicate images displayed at the same time at the instructor and learner terminals, respectively. Figures 4(a) and (b) also show images displayed at the same time at the instructor and learner terminals, respectively. In Figures 3 and 4, the interval between consecutive two MUs is 33 (i.e., δ = 33 ms). This is because the rendering rate of the remote haptic drawing instruction is 30 Hz (note that the frequency for input and output of PHANToM position is 1 kHz).
In Figure 3(a), the instructor terminal has its own MUs, which include the position information of the instructor terminal’s PHANToM cursor, with the sequence numbers of 1 through 100; in Figure 3(b), the learner terminal also has its own MUs, which include the posi-
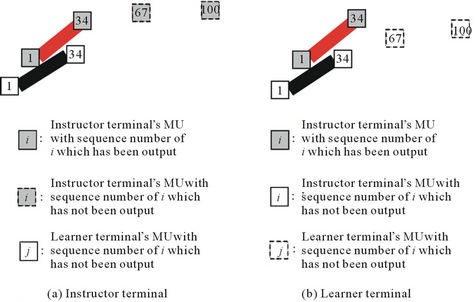
Figure 3. Displayed images in scheme which carries out only group synchronization control.
tion information of the learner terminal’s PHANToM cursor, with the sequence numbers of 1 through 100. However, in Figure 3(a), only the learner terminal’s MUs with the sequence numbers of 1 and 34 have been output since the arrivals of the learner terminal’s MUs with the sequence numbers of 67 and 100 are delayed owing to network delays; for the same reason, in Figure 3(b), only the instructor terminal’s MUs with the sequence numbers of 1 and 34 have been output. In Figure 3(a), although the instructor terminal can output its own MUs with the sequence numbers of 67 and 100, only MUs with the sequence numbers of 1 and 34 have been output for group synchronization. In Figure 3(b), although the learner terminal can also output its own MUs with the sequence numbers of 67 and 100, only MUs with the sequence numbers of 1 and 34 have been output for group synchronization as in Figure 3(a). Therefore, the drawing tracks at the instructor terminal are coincided with those at the learner terminal.
In Figure 4(a), the learner terminal’s MUs with the sequence numbers of 1 through 67 have been output. This is because the learner terminal’s MU with the sequence number of 67 in Figure 4(a) has been output by predicting the future position later than the learner terminal’s MU with the sequence number of 34 in Figure 3(a) by Tpredict ms (Tpredict = 33 ms in Figure 4). The instructor terminal also outputs its own MUs with the sequence numbers of 1 through 67 since the output time of MUs at the instructor terminal in Figure 4(a) is advanced by Tpredict ms to adjust the output timing of the instructor terminal’s MUs to that of the learner terminal’s MUs. In Figure 4(b), the learner and instructor terminals have also output MUs with the sequence numbers of 1 through 67. However, in Figure 4, we can see that there exists a difference between the actual position of the instructor terminal’s MU with the sequence number of 67 at the instructor terminal (Figure 4(a)) and the predicted position of the instructor terminal’s MU with the sequence
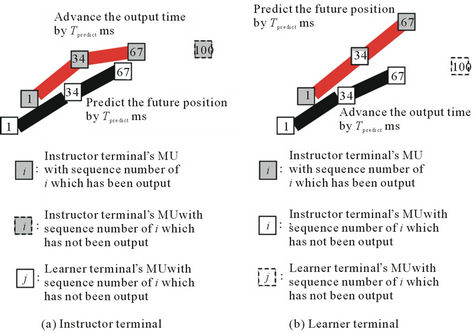
Figure 4. Displayed images in group synchronization control scheme with prediction.
number of 67 at the learner terminal (Figure 4(b)). The same problem also occurs to the position of the learner terminal’s MU with the sequence number of 67.
From the above observations, we can say that we can keep the interactivity higher as the value of Tpredict becomes longer; however, the prediction error becomes larger.
4. Assessment Methods
4.1. Assessment Systems
4.1.1. Remote Haptic Drawing Instruction
As shown in Figure 5, the assessment system of the remote haptic drawing instruction consists of the instructor terminal, the learner terminal, and a network emulator (NIST Net [29]). The learner and instructor terminals are connected to each other through NIST Net by using Ethernet cables (100 Mbps). NIST Net generates an additional delay according to the Pareto-normal distribution [29] for each MU transmitted between the two terminals. In addition, MUs are transmitted by the User Datagram Protocol (UDP) as a transport protocol. We assume that packet loss does not occur in this paper.
Two users draw a whorl (see Figure 1) in the assessment. We set the prediction time Tpredict to 0, 25, 50, 75, and 100 ms. Note that when Tpredict is 0 ms, the prediction is not used; that is, only the group synchronization control is carried out. We set the average additional delay to 100 ms and 200 ms. When the average additional delay is 100 ms, the standard deviation of additional delay is set to 0, 10, 20, and 30 ms; when the average additional delay is 200 ms, the standard deviation of additional delay is set to 0, 20, 40, and 60 ms.
4.1.2. Collaborative Haptic Play with Building Blocks
The assessment system of the collaborative haptic play with building blocks is almost the same as that of the remote haptic drawing instruction. As shown in Figure 5, the system consists of the client terminal and the server terminal, which are connected to each other through NIST Net. By using NIST Net, we generate an additional delay for each MU according to the Pareto normal distribution. In addition, MUs are transmitted by the UDP. We also assume that packet loss does not occur in this paper.
In the assessment, two users pile up four building blocks (blocks 1, 2, 3, and 4) which are shown in Figure 2. The other 22 blocks were built up before the assessment. Figure 6 shows a displayed image of the virtual space after the users have finished the collaborative play. We set the prediction time Tpredict to 0, 10, 20, 30, and 50 ms. We set the average additional delay to 50 ms and 100 ms. When the average additional delay is set to 50 ms, the standard deviation is changed from 0 ms to 20 ms at intervals of 5 ms; when the average additional delay is 100 ms, the standard deviation is changed from 0 ms to 40 ms at intervals of 10 ms.
4.2. Assessment Methods
For subjective assessment, we enhanced the single-stimulus method of ITU-R BT.500-11 [30], which is a recommendation for subjective assessment of television pictures. This is because there is no standard for subjective assessment of haptic media. In the single-stimulus method, each subject is asked to practice on the condition that there is no additional delay and the group synchronization control is not carried out. Then, the subject gives a score based on Table 1 to each test according to the degree of deterioration on the condition that there exist additional delays and the group synchronization control scheme with prediction is employed to obtain the mean opinion score (MOS) [30].
In the assessment of the remote haptic drawing instruction, each subject was asked to base his/her judgement about a synthesis of the operability of his/her PHANToM and the visual feeling (i.e., whether the two lines are smooth or not). In the assessment of the collaborative haptic play with building blocks, each subject was asked to base his/her judgment about the operability of his/her PHANToM. In this paper, the operability of
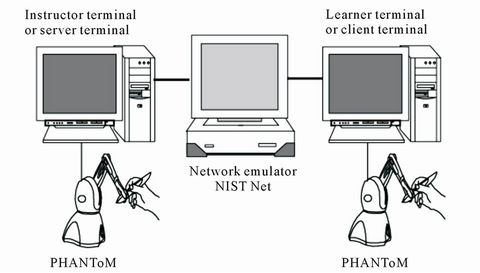
Figure 5. Assessment system.
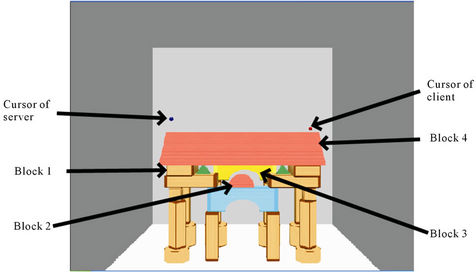
Figure 6. Displayed image of virtu al space after collaborative play.
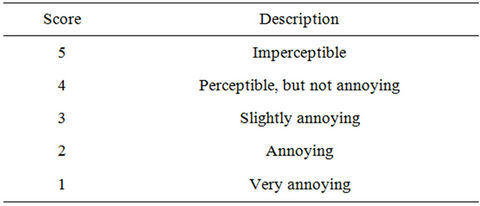
Table 1. Five-grade impairment scale.
PHANToM denotes a synthesis of the interactivity of PHANToM (the delay between the the movement of PHANToM and that in the video) and the smoothness of PHANToM operation. We explained the operability to each subject before the assessment.
Objective assessment was carried out at the same time as the subjective assessment. As performance measures, we employ the following rate for the remote haptic drawing instruction and the average operation time for the collaborative haptic play with building blocks. The following rate is defined as the ratio of the time during which the learner’s paintbrush is within a circle with radius of 1.5 cm to the total time; the center of the circle is the tip of the instructor’s paintbrush. This parameter denotes how accurately the paintbrush of the learner has followed that of the instructor. The reason why the radius is set to 1.5 cm is as follows. We carried out a preliminary experiment with the radius of 1.0, 1.5 and 2.0 cm. As a result, we found that the difference in the following rate among the prediction times appeared clearly when the radius was 1.5 cm. The average operation time is defined as the average time from the moment the play is started until the instant all the blocks are piled up. This parameter denotes the work efficiency of subjects.
We carried out the assessment of the remote haptic drawing instruction and that of the collaborative haptic play with building blocks on different days. The number of subjects (men and women) whose ages were between 21 and 28 was thirty in each assessment. In the former assessment, the total assessment time of each subject was about 1 hour. Each subject had about five minutes break every around 30 minutes. In the latter assessment, the total assessment time of each pair of subjects was about 2 hours which included ten minutes break every around 40 minutes. We selected the average additional delay, the standard deviation of additional delay, and the prediction time Tpredict randomly for each subject or each pair of subjects in each assessment.
5. Assessment Results
5.1. Remote Haptic Drawing Instruction
5.1.1. Subjective Assessment Results
We show the instructor’s and learner’s MOS values versus the standard deviation of additional delay when the average additional delay is 100 ms in Figures 7 and 8, respectively. The MOS values versus the standard deviation of additional delay when the average additional delay is 200 ms are shown in Figures 9 and 10. In the figures, we plot the 95% confidence intervals.
From Figures 7 and 8, we see that the MOS values of Tpredict = 25 ms and 50 ms are larger than those of the other prediction times. In Figures 9 and 10, the MOS value of Tpredict = 50 ms is the largest. Thus, we notice that there exists the optimum value of prediction time, and the optimum value depends on the standard deviation of additional delay and the average additional delay. However, in Figures 7-10, the MOS values of Tpredict = 75 ms and 100 ms tend to be less than that of Tpredict = 0 ms (only the group synchronization control is carried out). This is because the difference between the predicted position and actual position (i.e., the prediction error) becomes larger as the prediction time increases.
We carried out the two-way ANOVA (analysis of variance) [31] for the results shown in Figures 7-10 to confirm whether there are statistically significant differences among the results of prediction times. As a result, we noticed that when the average additional delay is 100 ms, there are statistically significant differences between the results of Tpredict = 25 ms (the optimum value) and 0 ms (only the group synchronization control is carried out), and between the results of Tpredict = 25 ms and 100 ms (the lowest MOS in the assessment); when the average additional delay is 200 ms, there are statistically significant differences between the results of Tpredict = 50 ms (the optimum value) and 0 ms, and between the results of Tpredict = 50 ms and 100 ms (the lowest MOS in the assessment).Therefore, we can say that there exists the statistically-significant optimum value of Tpredict.
We also implemented the second-order prediction [28] in the proposed scheme, and investigated the effects of
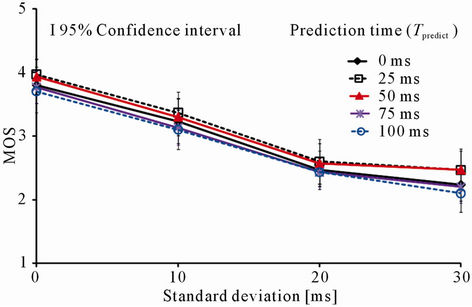
Figure 7. MOS at instructor terminal versus standard deviation of additional delay (average additional delay: 100 ms).
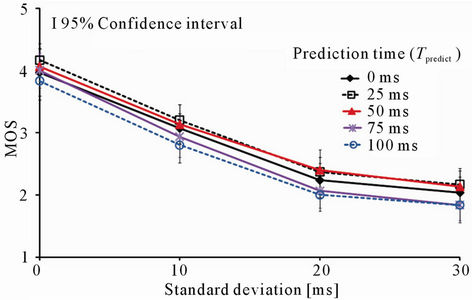
Figure 8. MOS at learner terminal versus standard deviation of additional delay (average additional delay: 100 ms).
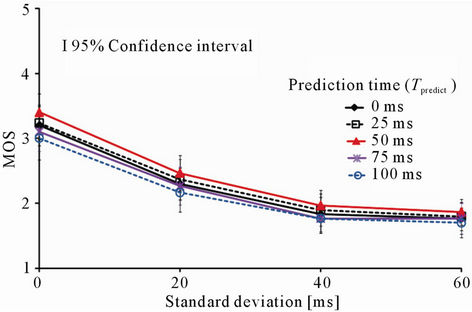
Figure 9. MOS at instructor terminal versus standard deviation of additional delay (average additional delay: 200 ms).
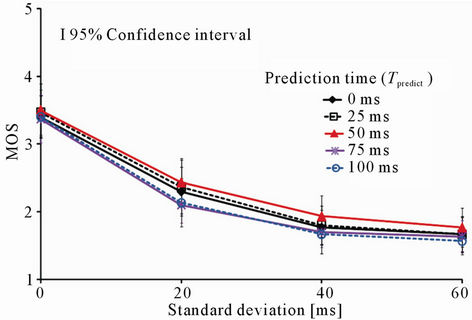
Figure 10. MOS at learner terminal versus standard deviation of additional delay (average additional delay: 200 ms).
the scheme by the QoE assessment. Then, we found that the prediction time whose MOS value is the largest is almost the same as that in the first-order prediction. However, the MOS value of the second-order prediction is slightly larger than that of the first-order prediction. This is because when each subject draws whorl, the prediction error of the second-order prediction is smaller.
Furthermore, we carried out the assessment in which each subject was asked to draw sawtooth [32]. As a result, we obtained almost the same results as those of whorl. On the other hand, the MOS value of sawtooth is slightly larger than that of whorl. This is because sawtooth consists of several lines, and the prediction error of sawtooth is smaller than that of whorl.
From the above results, we can say that the proposed scheme is the most effective when Tpredict is 25 ms and 50 ms in the remote haptic drawing instruction.
5.1.2. Objective Assessment Results
We show the following rates at the instructor terminal as a function of the standard deviation of the additional delay when the average additional delay is 100 ms and 200 ms in Figures 11 and 12, respectively. Since the following rate at the learner terminal was almost the same as that at the instructor terminal, we do not show the following rate at the learner terminal in this paper.
From Figures 11 and 12, we see that the following rates of Tpredict = 25 ms and 50 ms are larger than those of the other prediction times. The tendency of objective assessment results is almost the same as that in Figures 7-10.
We carried out the two-way ANOVA for the results shown in Figures 11 and 12. As a result, we obtained almost the same results as the subjective assessment results in Subsection 5.1.1. That is, there exists the statisticallysignificant optimum value of Tpredict.
As a result of the assessment in which the secondorder prediction was employed, we found that the prediction time whose following rate is the largest is almost the same as that of the first-order prediction. However, the following rate of the second-order prediction is slightly larger than that of the first-order prediction. The reason is the same as that described in Subsection 5.1.1.
From the objective assessment results, we can also say that the proposed scheme is effective.
5.1.3. Relationship between Subjective and Objective Assessment Results
In order to investigate the relation between the following rate and the MOS value, we carried out the regression analysis [33]. As a result, we obtained the following equation:
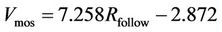 where Vmos is the estimated value of MOS, and Rfollow is the following rate. The contribution rate adjusted for degrees of freedom [33], which shows goodness of fit with the estimated equation, was 0.861. Therefore, we can estimate the MOS value from the following rate with a high degree of accuracy.
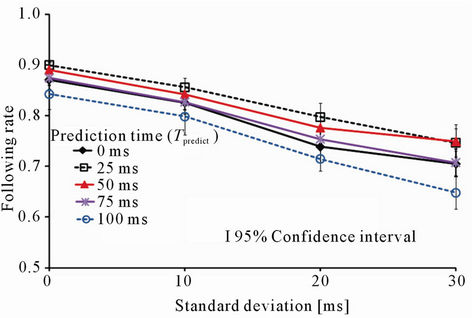
Figure 11. Following rate at instructor terminal versus standard deviation of additional delay (average additional delay: 100 ms).
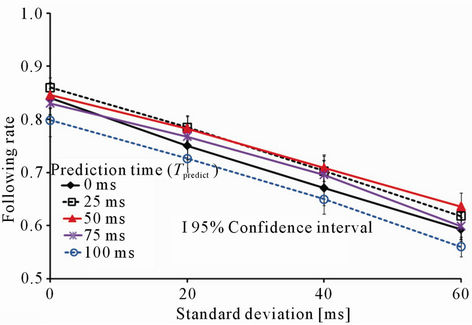
Figure 12. Following rate at instructor terminal versus standard deviation of additional delay (average additional delay: 200 ms).
5.2. Collaborative Haptic Play with Building Blocks
5.2.1. Subjective Assessment Results
We show the MOS values at the server terminal versus the standard deviation of additional delay when the average additional delay is 50 ms and 100 ms in Figures 13 and 14, respectively. Because the MOS value at the client terminal was almost the same as that at the server terminal, we do not show the MOS value at the client terminal in this paper.
In Figure 13, we see that the MOS value of Tpredict = 20 ms is larger than those of the other prediction times. In Figure 14, we observe that the MOS values of Tpredict = 20 ms or 30 ms are the largest. Therefore, there exists the optimum value of prediction time, and the optimum value depends on the standard deviation of additional delay and the average additional delay. From Figures 13 and 14, we notice that the MOS values of Tpredict = 10 ms, 20 ms, and 30 ms are larger than that of Tpredict = 0 ms (only the group synchronization control is carried out). How
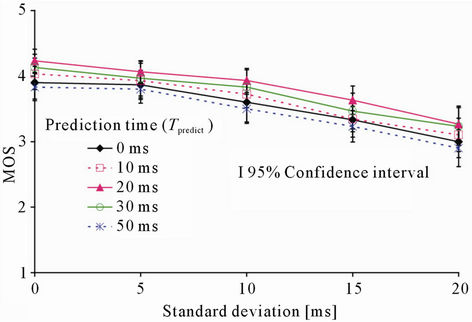
Figure 13. MOS at server terminal versus standard deviation of additional delay (average additional delay: 50 ms).
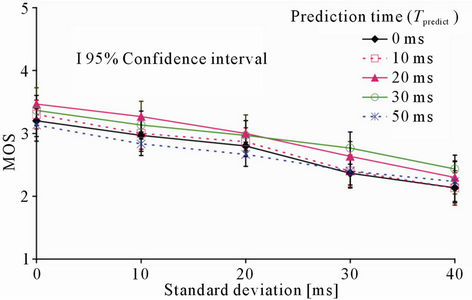
Figure 14. MOS at server terminal versus standard deviation of additional delay (average additional delay: 100 ms).
ever, the MOS value of Tpredict = 50 ms tends to be less than that of Tpredict = 0 ms. This is because the prediction error becomes larger as the prediction time increases.
We carried out the two-way ANOVA for the results shown in Figures 13 and 14. As a result, we found that when the average additional delay is 50 ms, there are statistically significant differences between the results of Tpredict = 20 ms (the optimum value) and 0 ms (only the group synchronization control is carried out), and between the results of Tpredict = 20 ms and 50 ms (the lowest MOS in the assessment); when the average additional delay is 100 ms, there are statistically significant differences between the results of Tpredict = 20 ms (the optimum value) and 0 ms, between the results of Tpredict = 30 ms (the optimum value) and 0 ms, between the results of Tpredict = 20 ms and 50 ms (the lowest MOS in the assessment), and between the results of Tpredict = 30 ms and 50 ms. Therefore, we can say that there exists the statistically-significant optimum value of Tpredict.
We also employed the second-order prediction as in Subsection 5.1.1. As a result, we found that the predicttion time whose MOS value is the largest is almost the same as that of the first-order prediction. This is because that in the collaborative haptic play with building blocks, the PHANToM cursor tends to move linearly, and the prediction errors of the second-order prediction and the first-order prediction are in the same range.
From the above results, the proposed scheme is the most effective when Tpredict is 20 ms or 30 ms in the collaborative haptic play with building blocks. We notice that the optimum values of Tpredict is different from that in Subsection 5.1.1. This is because that the two types of work have different configurations, force calculation methods, and transmission rates from each other.
5.2.2. Objective Assessment Results
Figures 15 and 16 show the average operation times as a function of the standard deviation of additional delay when the average additional delay is 50 ms and 100 ms, respectively.
In Figure 15, we see that the average operation time of Tpredict = 20 ms is the shortest. From Figure 16, the average operation times of Tpredict = 20 ms and 30 ms are shorter than those of the other prediction times. In Figures 15 and 16, we can see similar tendencies to those in Figures 13 and 14, respectively; note that the magnitude relation of the average operation time is opposite to that of the MOS value.
We carried out the two-way ANOVA for the results shown in Figures 15 and 16. As a result, we obtained almost the same results as the subjective assessment results in Subsection 5.2.1. That is, there exists the statistically-significant optimum value of Tpredict.
When the second-order prediction was employed, we found that the prediction time whose average operation time is the largest is almost the same as that in the case where the first-order prediction is used. The reason is the same as that described in Subsection 5.2.1.
From the objective assessment results, we can also say that the proposed scheme is effective.
5.2.3. Relationship between Subjective and Objective Assessment Results
In order to investigate the relation between the average operation time and the MOS value, we carried out regression analysis. As a result, we obtained the following equation:
Vmos = 7.554 – 0.101 Topewhere Tope is the average operation time. The contribution rate adjusted for degrees of freedom was 0.921. Therefore, we can estimate the MOS value from the average operation time with a high degree of accuracy.
6. Conclusions
This paper proposed a group synchronization control scheme with prediction for haptic work in which group
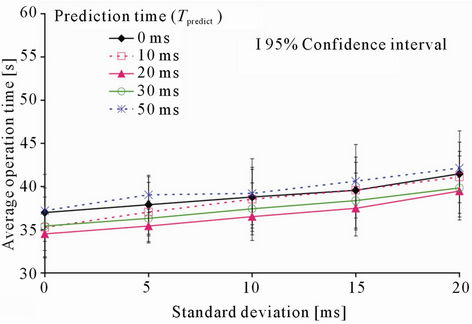
Figure 15. Average operation time versus standard deviation of additional delay (average additional delay: 50 ms).
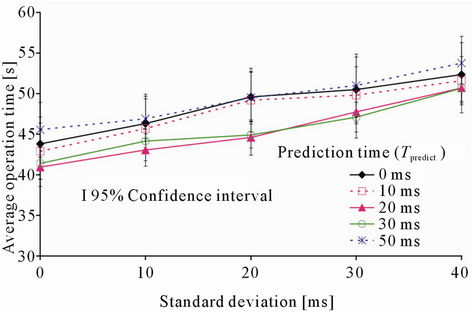
Figure 16. Average operation time versus standard deviation of additional delay (average additional delay: 100 ms).
synchronization control is needed to keep the interactiveity high. Then, we implemented the proposed scheme in two types of work (remote haptic drawing instruction and collaborative haptic play with building blocks)* which have different configurations, force calculation methods, and transmission rates from each other, and we investigated the effects of the scheme by QoE assessment. As a result, we found that there is the optimum value of prediction time, and the optimum value depends on the standard deviation of network delay, the average network delay, and the type of work. The proposed scheme is the most effective when the prediction time Tpredict is 25 ms or 50 ms in the remote haptic drawing instruction, and when Tpredict is 20 ms or 30 ms in the collaborative haptic play with building blocks. Furthermore, we noticed that we can estimate the MOS value from the following rate or the average operation time with a high degree of accuracy.
As the next step of our research, we need to carry out the assessment with other types of work and investigate the effects of the proposed scheme. It is also important to clarify the relationship between the optimum value of the prediction time and the type of work. Furthermore, we plan to employ other prediction methods (fox example, Kalman filter [35]) which have higher accuracy than the first-order and second-order prediction in the proposed scheme.
7. Acknowledgements
The authors would like to thank Mr. Youichi Kurokawa who was a student of Nagoya Institute of Technology for implementing the proposed scheme in the remote haptic drawing instruction. This work was supported in part by the Grant-In-Aid for Scientific Research (C) of Japan Society for the Promotion of Science under Grant 22560368.
REFERENCES
- M. A. Srinivasan and C. Basdogan, “Haptics in Virtual Environments: Taxonomy, Research Status, and Challenges,” Computers and Graphics, Vol. 21, No. 4, 1997, pp. 393- 404. doi:10.1016/S0097-8493(97)00030-7
- I. Lee and S. Choi, “Discrimination of Visual and Haptic Rendering Delays in networked Environments,” International Journal of Control, Automation and Systems, Vol. 7, No. 1, 2009, pp. 25-31. doi:10.1007/s12555-009-0104-0
- Y. You, M. Sung, N. Kim and K. Jun, “An Experimental Study on the Performance of Haptic Data Transmission in Networked Haptic Collaboration,” Proceedings of the 9th International Conference on Advanced Communication Technology, Phoenix Park, 12-14 February 2007, pp. 657- 662.
- J. Kim, H. Kim, B. K. Tay, M. Muniyandi, M. A. Srinivasan, J. Jordan, J. Mortensen, M. Oliveira and M. Slater, “Transatlantic Touch: A Study of Haptic Collaboration over Long Distance,” Presence, Vol. 13, No. 3, 2004, pp. 328-337. doi:10.1162/1054746041422370
- C. Gunn, M. Hutchins and M. Adcok, “Combating Latency in Haptic Collaborative Virtual Environments,” Presence, Vol. 14, No. 3, 2005, pp. 313-328. doi:10.1162/105474605323384663
- M. Y. Sung, Y. Yoo, K. Jun, N. Kim and J. Chae, “Experiments for a Collaborative Haptic Virtual Reality,” Proceedings of the 16th International Conference on Artificial Reality and Telexistence, Hangzhou, 29 November-1 December 2006, pp. 174-179.
- ITU-T Rec. P. 10/G. 100 Amendment 1, “New Appendix I—Definition of Quality of Experience (QoE),” International Telecommunication Union, 2007.
- S. Lee, S. Moon and J. Kim, “Performance Evaluation of Transport Protocols for Networked Haptic Collaboration,” Proceedings of SPIE Optics East Multimedia Systems and Applications IX, Boston, 1-4 October 2006.
- M. Glencross, C. Jay, J. Feasel, L. Kohli and M. Whitton, “Effective Cooperative Haptic Interaction over the Internet,” Proceedings of IEEE Virtual Reality, Charlotte, 10-14 March 2007, pp. 115-122.
- I. Arimoto, K. Hikichi, K. Sezaki and Y. Yasuda, “Influence of Network Delay on Ensemble Application,” Proceedings of IEEE International Workshop on Haptic Audio Visual Environments and Their Applications, Ottawa, 1-2 October 2005, pp. 19-22.
- Y. Ishibashi and H. Kaneoka, “Fairness among Game Player in Networked Haptic Environments: Influence of Network Latency,” Proceedings of the IEEE International Conference on Multimedia and Expo, Amsterdam, 6-9 July 2005.
- K. Hikichi, H. Morino, I. Arimoto, I. Fukuda, S. Matsumoto, M. Iijima, K. Sezaki and Y. Yasuda, “Architecture of Haptics Communication System for Adaptation to Network Environments,” Proceedings of the IEEE International Conference on Multimedia and Expo, Tokyo, 22-25 August 2001.
- H. Kaneoka and Y. Ishibashi, “Effects of Group Synchronization Control over Haptic Media in Collaborative Work,” Proceedings of the 14th International Conference on Artificial Reality and Telexistence, Seoul, 30 November-2 December 2004, pp. 138-145.
- Y. Ishibashi, T. Hasegawa and S. Tasaka, “Group Synchronization Control for Haptic Media in Networked Virtual Environments,” Proceedings of the 12th Symposium on Haptic Interfaces for Virtual Environment and Teleoperator Systems, Chicago, 27-28 March 2004, pp. 106-113.
- T. Hashimoto and Y. Ishibashi, “Group Synchronization Control over Haptic Media in a Networked Real-Time Game with Collaborative Work,” Proceedings of ACM NetGames, Singapore, 30-31 October 2006.
- Y. Kurokawa, Y. Ishibashi and T. Asano, “Group Synchronization Control in a Remote Haptic Drawing System,” Proceedings of the IEEE International Conference on Multimedia and Expo, Beinjing, 2-5 July 2007, pp. 572-575.
- Y. Tsumaki and M. Yokohama, “Predictive Motion Display for Acceleration Based Teleoperation,” Proceedings of the IEEE International Conference on Robotics and Automation, Orlando, 15-19 May 2006, pp. 2927-2932.
- T. Asano, Y. Ishibashi and S. Kameyama, “Interactive Haptic Transmission for Remote Control Systems,” Proceedings of the IEEE International Conference on Multimedia and Expo, Toronto, 9-12 July 2006, pp. 2113-2116.
- P. Huang, Y. Ishibashi, N. Fukushima and S. Sugawara, “Collaborative Haptic Play with Building Blocks,” Proceedings of the International Conference on Advances in Computer Enterntainment Technology, Athens, 29-31 October 2009.
- P. Briiks and B. Hestnes, “User Measures of Quality of Experience: Why Being Objective and Quantitative Is Important,” IEEE Network, Vol. 24, No. 2, 2010, pp. 8- 13. doi:10.1109/MNET.2010.5430138
- J. K. Salisbury and M. A. Srinivasan, “Phantom-Based Haptic Interaction with Virtual Objects,” IEEE Computer Graphics and Applications, Vol. 17, No. 5, 1997, pp. 6- 10. doi:10.1109/MCG.1997.1626171
- SensAble Technologies, Inc., “3D Touch SDK OpenHaptics Toolkit Programmer’s Guide,” Version 1.0, 2004.
- P. Huang, Y. Ishibashi, N. Fukushima and S. Sugawara, “Interactivity Improvement of Group Synchronization Control in Collaborative Haptic Play with Building Blocks,” Proceedings of ACM NetGames, Taipei, 16-17 November 2010.
- Y. Ishibashi and S. Tasaka, “A Distributed Control Scheme for Group Synchronization in Multicast Communications,” Proceedings of ISCOM, Kaohsiung, November 1999, pp. 317-323.
- Y. Kurokawa, Y. Ishibashi and T. Asano, “An Experiment on Inter-Destination Synchronization Control in a Remote Drawing Instruction System Using Haptic Media: Subjective Assessment and Objective Assessment,” IEICE Technical Report, CQ2006-79, 2007.
- Y. Ishibashi and S. Tasak, “A Group Synchronization Mechanism for Live Media in Multicast Communications,” IEEE Global Telecommunications Conference, Phoenix, 3-8 November 1997, pp. 746-752.
- Y. Ishibashi, S. Tasaka and T. Hasegawa, “The VirtualTime Rendering Algorithm for Haptic Media Synchronization in Networked Virtual Environments,” Proceedings of IEEE International Workshop on Communications Quality and Reliability (CQR), Okinawa, 14-16 May 2002, pp. 213-317.
- S. K. Singhal and D. R. Cheritton, “Using a Position History-Based Protocol for Distributed Object Visualization,” Technical Report, Stanford University, Department of Computer Science, 1994.
- M. Carson and D. Santay, “NIST Net—A Linux-Based Network Emulation Tool,” ACM SIGCOMM Computer Communication Review, Vol. 33, No. 3, 2003, pp. 111- 126. doi:10.1145/956993.957007
- ITU-R BT. 500-11, “Methodology for the Subjective Assessment of the Quality of Television Pictures,” International Telecommunication Union, 2002.
- G. W. Snedecor and W. G. Cochran, “Statistical Methods,” 7th Edition, The Iowa State University Press, Ames, 1980.
- T. Asano, S. Kameyama and Y. Ishibashi, “Subjective Assessment of Output Quality of Haptic Media in a Remote Control System Using Haptic Interface Devices,” IEICE Technical Report, CQ2005-66, 2005.
- S. Chatterjee, A. S. Hadi and B. Price, “Regression Analysis by Example,” John Wiley & Sons, Hoboken, 1999.
- H. Mizuno, Y. Ishibashi and S. Sugawara, “A Comparison between Transmission Methods of Sense of Force in a Remote Haptic Instruction System,” Proceedings of IEEE International Conference on Multimedia and Expo, New York, 28 June-2 July 2009, pp. 1202-1205.
- G. Welch and G. Bishop, “An Introduction to the Kalman Filter,” Notes of ACM SIGGRAPH Tutorial on the Kalman Filter, The University of North Carolina at Chapel Hill, Chapel Hill, 2001.
NOTES
*We also implemented the proposed scheme in the remote instruction system [34], in which a teacher can teach a student at a remote place how to write characters or how to draw figures in the real space, and investigated the effect of the scheme. As a result, we also found that the proposed scheme is effective.