Wireless Sensor Network
Vol.06 No.12(2014), Article ID:52250,9 pages
10.4236/wsn.2014.612027
Wireless Sensor Networks for Water Quality Monitoring and Control within Lake Victoria Basin: Prototype Development
Anthony Faustine1, Aloys N. Mvuma1, Hector J. Mongi1, Maria C. Gabriel1, Albino J. Tenge1, Samuel B. Kucel2
1The University of Dodoma, Dodoma, Tanzania
2Busitema University, Tororo, Uganda
Email: sambaiga@gmail.com, anmvuma@gmail.com, hjmongi@yahoo.com, magc5185@yahoo.co.uk, ajtenge@gmail.com, sbkucel@gmail.com
Copyright © 2014 by authors and Scientific Research Publishing Inc.
This work is licensed under the Creative Commons Attribution International License (CC BY).
http://creativecommons.org/licenses/by/4.0/


Received 3 October 2014; revised 9 November 2014; accepted 9 December 2014
ABSTRACT
The need for effective and efficient monitoring, evaluation and control of water quality in Lake Victoria Basin (LVB) has become more demanding in this era of urbanization, population growth and climate change and variability. Traditional methods that rely on collecting water samples, testing and analyses in water laboratories are not only costly but also lack capability for real-time data capture, analyses and fast dissemination of information to relevant stakeholders for making timely and informed decisions. In this paper, a Water Sensor Network (WSN) system prototype developed for water quality monitoring in LVB is presented. The development was preceded by evaluation of prevailing environment including availability of cellular network coverage at the site of operation. The system consists of an Arduino microcontroller, water quality sensors, and a wireless network connection module. It detects water temperature, dissolved oxygen, pH, and electrical conductivity in real-time and disseminates the information in graphical and tabular formats to relevant stakeholders through a web-based portal and mobile phone platforms. The experimental results show that the system has great prospect and can be used to operate in real world environment for optimum control and protection of water resources by providing key actors with relevant and timely information to facilitate quick action taking.
Keywords:
Wireless Sensor Networks, Lake Victoria Basin, Gateway, Sensor Nodes

1. Introduction
Lake Victoria Basin (LVB) is an important ecosystem in the Eastern African Region. It is shared among five East Africa countries which are Burundi, Kenya, Rwanda, Tanzania and Uganda. The Basin is also rich in natural resources which include fresh water, fishery, minerals, forests and fertile land for agriculture. These resources have recently contributed to rapid urbanization and increasing human population. The negative impacts of climate change and variability are compounding the existing challenges. Consequently, increasing number of human activities has gradually speed-up contamination and damage to fresh water resources in the LVB [1] . Water quality monitoring and evaluation is therefore very critical for sustainable water resources management and utilization programs and has increasingly attracted a great deal of research and development attention. However, in most developing countries like Tanzania, water quality monitoring and evaluation is entirely a manual process. This traditional approach of water quality monitoring based on sampling and subsequent analyses in water laboratories is expensive, time-consuming and has a low resolution both in time and space.
Over recent years, wireless sensor networks (WSNs) have received considerable attention in environmental and industrial monitoring and control applications. Being one of the main building blocks in ambient intelligence, WSNs provide significant advantages both in cost as well as in distributed intelligence [2] . On the other hand, installation and maintenance expenses are reduced because of the use of cheap devices which do not require wiring. It is for this reason that WSN technology has been attracting rapidly growing attention both from academia and in industry. This technology can definitely be applied in the water quality monitoring and evaluation process by providing best approach to real time data acquisition, transmission and processing.
Chaamwe [3] stressed the fact that WSNs are suitable for water quality monitoring. In [4] , Zennaro et al. proposed the design of WSN for water quality monitoring system. They used Sun SPOT motes and 90-FLT series E sensors by TPS to measure water pH, conductivity, total dissolved salt (TDS), dissolved oxygen (DO), turbidity and temperature. The authors reported that the proposed system cost around US $3400. However their solution is not suitable for long-term outdoor environments. Using ARM controller, Kumar et al. [5] presented WSN solar-based water quality monitoring system for measuring water pH, Oxygen level and turbidity. Furthermore, Aravinda et al. [6] presented a low-cost wireless water physic-chemistry sensing system using Arduino Mega 2560. They measured pH, DO, conductibility, oxidation reduction potential, light and temperature of water. The authors reported that the system cost around US $1040. However their approach used a computer as the gateway which is costly.
In this paper, a proposed WSN water quality monitoring system prototype is presented. The system consists of an Arduino microcontroller, a set of water quality sensors, and a network connection module. It measures water quality parameters including temperature, DO, pH and electrical conductivity (EC) values in real-time. The experimental results showed that the system has great prospect and can be used to operate in real world environment for optimum control of aquaculture environment. Considering the previously proposed systems, the proposed prototype provides software module that allow users to visualize the data from the WSN without installing specific software. Moreover, the prototype is suitable for long-term outdoor environments and implement low-cost gateway module.
The rest of the paper is organized as follows. Section 2 describes a development of the proposed WSN system prototype and outlines its key features together with details on how the proposed system was implemented and tested. Section 3 provides the preliminary results and discussion. Finally, Section 4 presents the concluding remarks of this work and introduces relevant open issues which have been identified.
2. Proposed WSN System Prototype
The proposed WSN system prototype was developed as a component of the Water Resource Governance System (WaGoSy); an innovative and integrated ICT solution which was designed to address challenges of water resources governance facing the LVB. The ultimate purpose of the proposed WSN system prototype is to automate the monitoring of water quality for supporting sustainable utilization and management of water resources in the basin. The proposed WSN system consists of three main building blocks namely, WSN sensor nodes, WSN gateway node and application software.
2.1. WSN Sensor Node
The WSN sensor node is the main building block of the developed WSN system prototype. It is equipped with sensor and microcontroller units, Global Positioning System (GPS) receiver, power supply and Radio Frequency (RF) transceiver. The sensor unit essentially consists of several sensors used for detection of water quality parameters. In this prototype, four sensors for measuring pH, EC, DO and temperature are employed to provide general characterization of water quality. However, the sensor node is scalable to allow more sensors depending on needs. Table 1 summarizes the specifications for sensors used in the prototype.
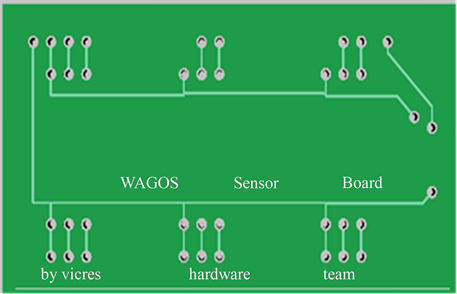
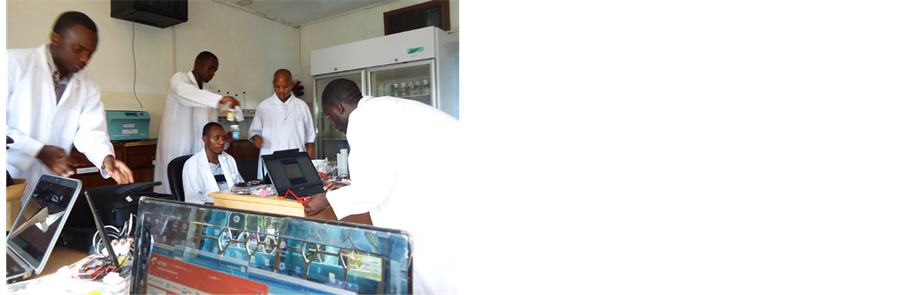
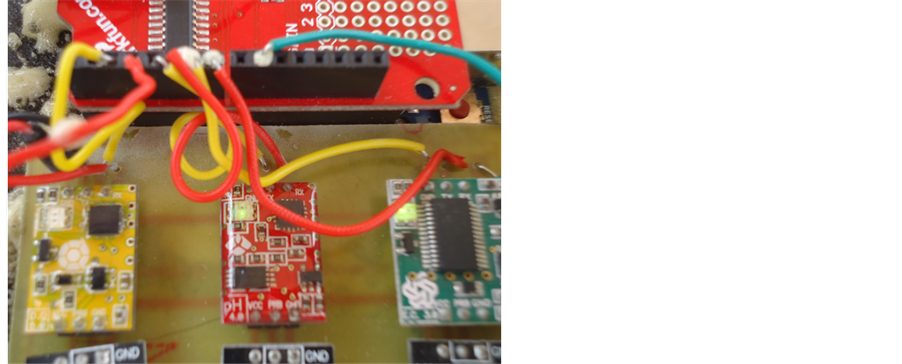
The pH, EC and DO sensors are interfaced to the microcontroller using their respective circuits from Atlas Scientific with the exception of the temperature sensor which is directly connected to the microcontroller. All the sensors are powered by the power supply for their operation. The RF transceiver transmits sensed parameter values and GPS information to a gateway node. Figure 1 shows the schematic diagram of sensor unit configuration used in the proposed system. To connect all the sensors to the microcontroller unit, a WaGoSy sensors carrier board as shown in Figure 2(a) was designed. The sensors were calibrated to ensure correct operation and accuracy in the resulting water quality parameter values. The calibration was done at the Lake Victoria water quality laboratory in Mwanza with the assistance from water quality laboratory technician as shown in Figure 2(b).
The microcontroller unit consists of a microcontroller and a software programme that determines the behavior of the WSN sensor node. Arduino Mega 2560 microcontroller, an open-source electronics prototyping platform

Table 1. Summary of specifications for the sensors.
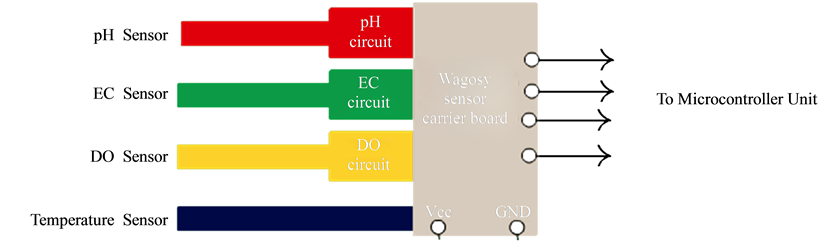
Figure 1. Schematic diagram of WSN sensor unit configuration.
 (a) (b)
Figure 2. (a) WaGoSy sensor carrier board; (b) Calibration of sensors.
based on flexible, easy-to-use hardware and software was used to acquire and process sensor data. Each sensor node is further equipped with EM-506 GPS receiver from USGlobalSat to provide location and time for the measured data. This is a complete GPS smart antenna receiver that includes an embedded antenna and GPS receiver circuits. The GPS module is also used to ensure that the sensor nodes are not tampered with for security reasons. However the GPS data is captured and sent to the gateway in preset time interval and not continuously to reduce power consumption. The architecture of the sensor node is shown in Figure 3.
2.2. WSN Gateway Node
The WSN system gateway is one of the most important and unique block in the proposed system. It collects all the information received from multiple sensor nodes. The developed gateway is equipped with microcontroller unit, General Packet Radio Service (GPRS) module, RF transceiver, memory card and power supply. Arduino Uno microcontroller is used to acquire and process received sensor data from WSN sensor nodes through the RF transceiver. The same XBee module as used in WSN sensor nodes is used to implement WSN gateway RF transceiver module. The GPRS module residing on top of the gateway node is used to communicate with the cellular network to forward the Short Message Services (SMS) data to a WaGoSy system. To implement the GPRS module, Arduino GPRS shield from Seed Studio was selected. This is quad-band low power consumption Global System for Mobile Communications (GSM)/GPRS module SIM900 with a compact PCB antenna and consumes 1.5 mA in sleep mode. A 1 GB compact memory card is used to store measurements data from WSN sensor nodes when the GSM connectivity is not available. Figure 4 shows the architecture of the proposed gateway node.
2.3. WSN RF Transceiver
The WSN based on ZigBee was adopted because of lower cost and power consumption. It provides a data rate of 250 kbps at 2.4 GHz [7] . It thus allows small, low-cost devices to transmit quickly the small amount of data
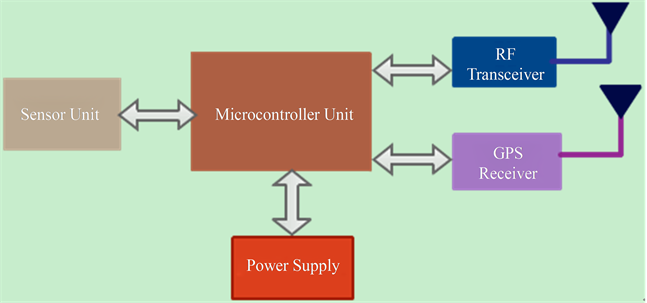
Figure 3. Sensor node architecture.
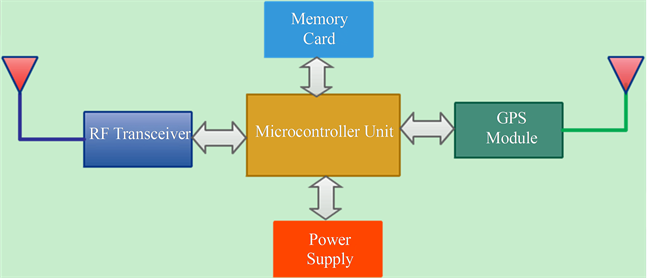
Figure 4. Proposed WSN gateway node architecture.
such as sensor readings. To provide wireless link between WSN sensor nodes and WSN gateway node, XBee Pro Series 2 module from Digi was used. The XBee product family is a series of modular products that make deploying wireless technology easy and cost-effective based on the IEEE 802.15.4/ZigBee. The module was configured to operate in a point to multipoint topology in sleeping-mode function because of its low latency communication between the remote WSN sensor nodes and the WSN gateway node. The XBee on sensor nodes was programmed to be an END DEVICE in AT mode while the XBee on the gateway node was set to be a COORDINATOR in AP mode. The configuration was done using X-CTU software developed by Digi for configuring and testing RF products modems [8] .
2.4. WSN RF Power Supply
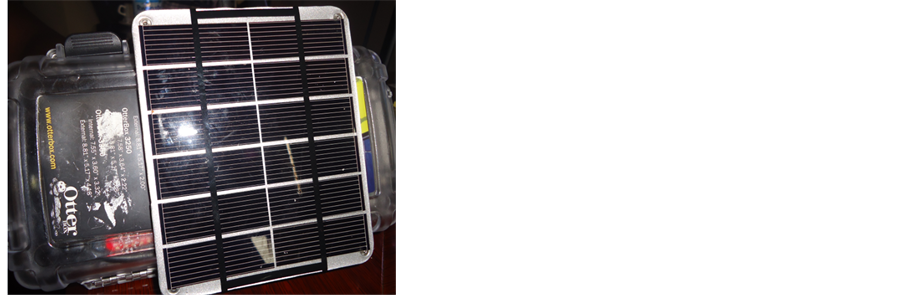
In a practical WSN system for water quality monitoring, where sensor nodes are distributed in remote sites, power supply is an extremely important issue to consider. The only viable method to power the sensor nodes in WSN application is to use battery. The advantages are evident, but batteries have limited lifespan and cannot stand for a long time. Replacing depleted batteries regularly is difficult. To avoid unnecessary work and make the system more flexible to deploy, different energy harvesting schemes like solar panel can also be used to recharge the battery. In the proposed prototype, a 3.7 V 6 AH rechargeable polymer lithium ion battery was used to power the WSN nodes. This battery has longer life and excellent long-term and self-discharge rates. However it provide less than 5 V required by most components on the WSN sensor nodes and gateway node. Therefore, a d.c power booster was used to boost the output from a battery voltage to 5V as depicted in Figure 5. This d.c booster solar charging control also provides the switching button for switching ON and OFF the WSN nodes. It further allows charging the lithium battery through USB or Solar Panel. A 10 W solar panel was used to provide continues battery charging in day time.
2.5. WSN Application Software
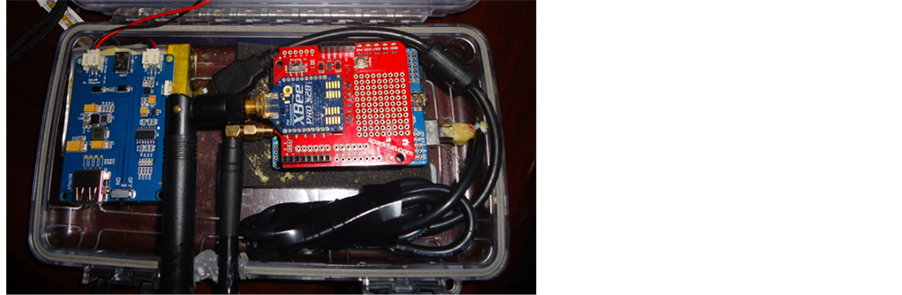
The WSN system software includes the WaGoSy system database used to store the received data and provides for visualization of information. The visualization module allows users to visualize the data from the WSN sensor nodes without installing specific software. It enables stakeholders to visualize, map and compare water quality parameters and locations in graphical representation. This software module was developed using MySQL, PHP, HTML and Java Scripts. Figure 6 and Figure 7 show the complete WSN node and WSN gateway modules of the system.
3. Results and Discussion
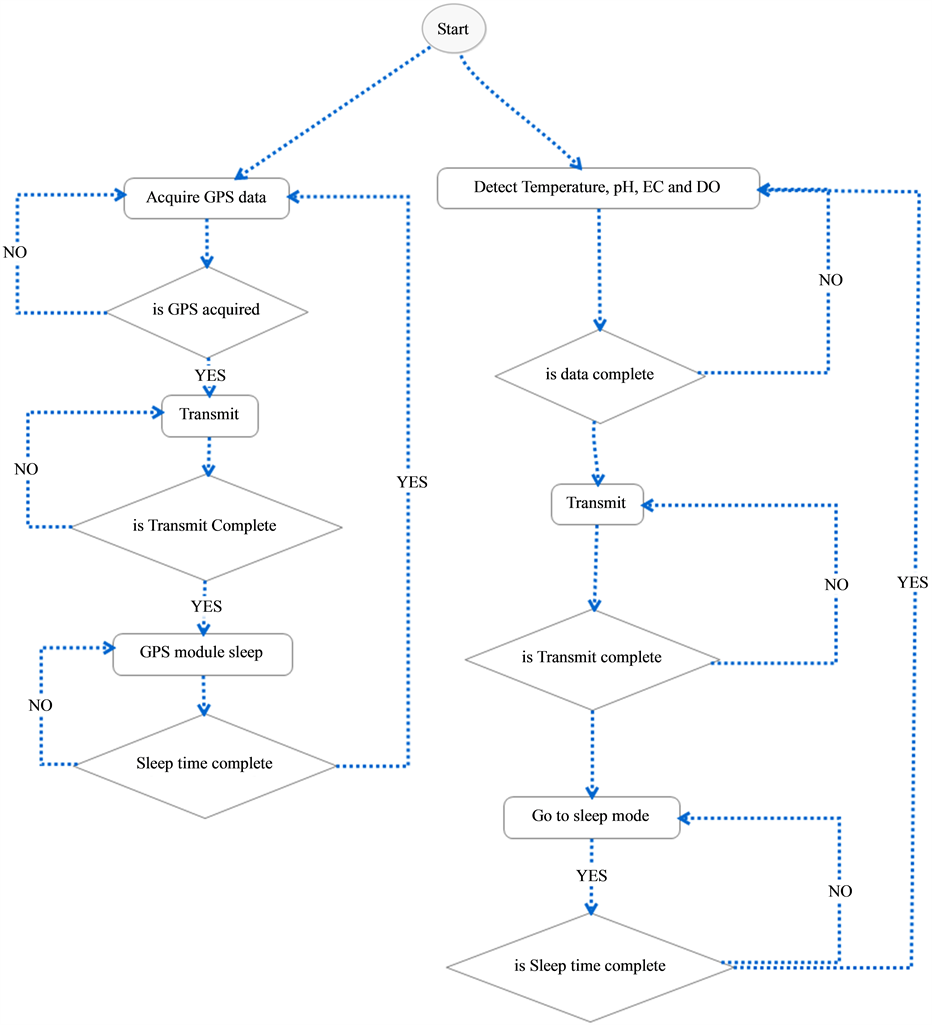
The main actor in the proposed WSN system prototype is the wireless sensor node. During measurement, the WSN sensor node wakes up from the sleep mode, waits for GPS receiver to fetch the latest geospatial information and latest data from sensors. It then passes the data to the WSN gateway node before going back into sleep mode. The process of acquiring data from sensors is shown in the flow chart in Figure 8(a). A software programme was developed and uploaded into the microcontroller to allow the WSN sensor nodes to measure water quality parameters and GPS data at time intervals of 20 minutes. The rest of the time, the sensor nodes are in sleep mode to conserve battery power. The time interval can be changed depending on need, especially when
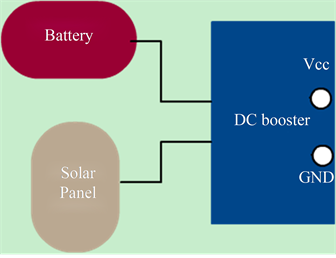
Figure 5. Power supply module.

 (a) (b)
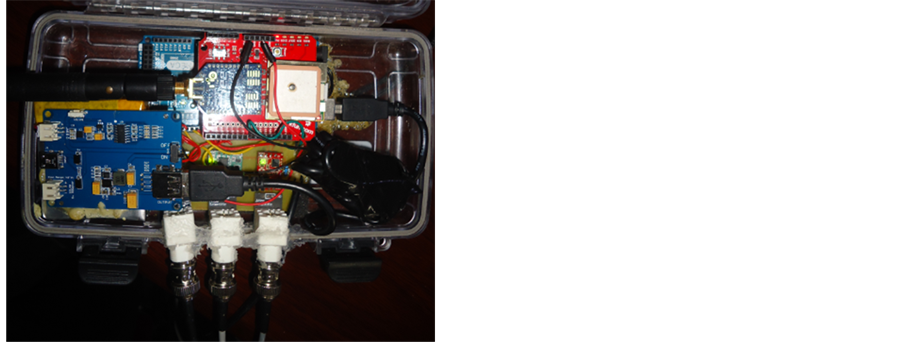
 (c) (d)
Figure 6. (a) WSN sensor nodes in lab testing; (b) WSN sensor nodes on WaGoSy sensor carrier board; (c) A complete WSN sensor node in an open cover; (d) A WSN sensor node in a closed cover.
 (a) (b)
Figure 7. (a) A gateway node in an open cover; (b) A gateway node in a closed cover.
power needs to be conserved for longer battery life. Once the measurements are done, the WSN sensor nodes relay the captured data through the XBee transceivers to the WSN gateway node. The gateway then aggregates these data and sends to the WaGoSy System as SMS for data analysis. Figure 8(b) shows the process of receiving data from sensors and sending to the database.
The system was tested in the field and it worked perfectly. Field testing of the system verified the functionalities of the proposed system and its practical application in actual environment as shown in Figure 9. The proposed solution gives water resources stakeholders’ ability to test water quality parameters at selected sensitive sites continuously. Examples of such sites include domestic water sources, domestic water intake points and industrial water discharge points. The captured dataset is sent to the central database and can be accessed through the web-based portal or via mobile phone through SMS in graphical or tabular forms as shown in Figure 10. It also promotes more accountability and transparency as data collected are available to all stakeholders. The system cost, including sensors nodes and gateway stands at US $1250. This is in stark contrast to commercial water quality monitoring systems US $3400 [4] , which is a threefold reduction in cost. From the results shown above, with the use of low-cost and open-source hardware, we can achieve acceptable sensor readings.
 (a)
(a)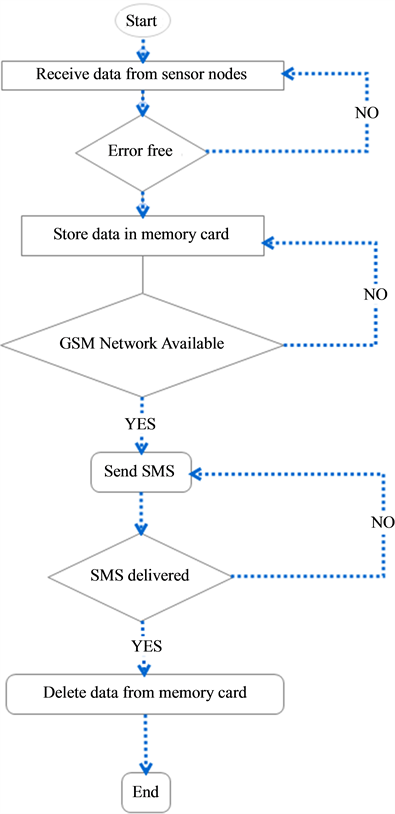 (b)
(b)
Figure 8. (a) Flowchart of acquiring data from sensors; (b) Flowchart of data processing at the gateway.
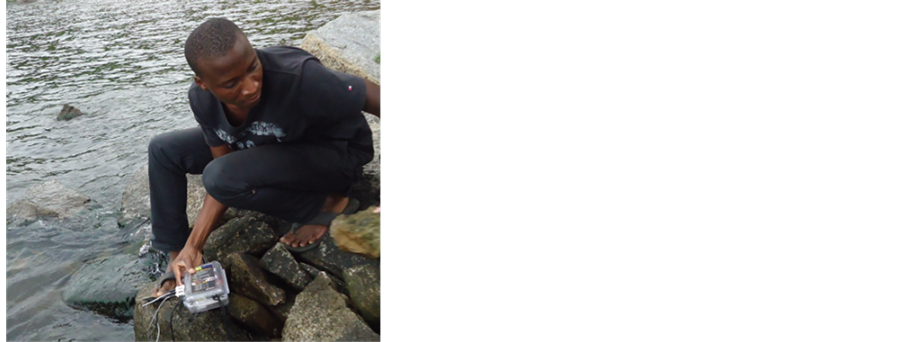
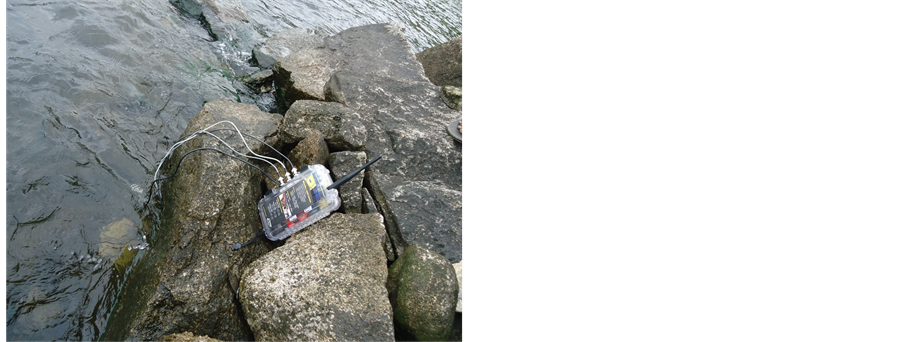 (a) (b)
Figure 9. Field testing of the WSN system (a) Field assistant installing the sensor nodes; (b) Sensor nodes taking measurement.
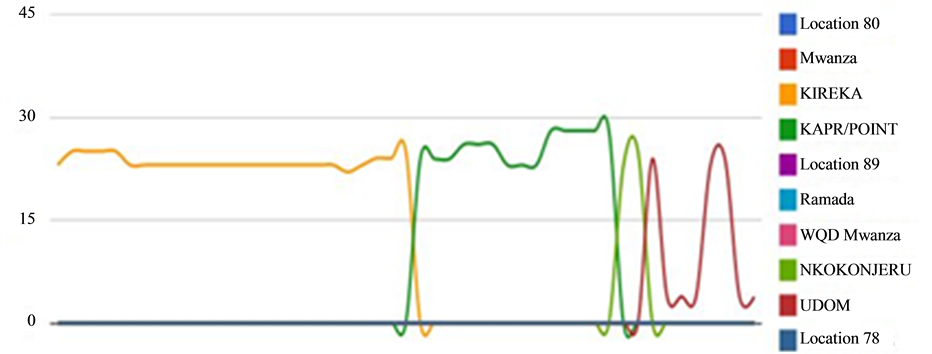 (a)
(a)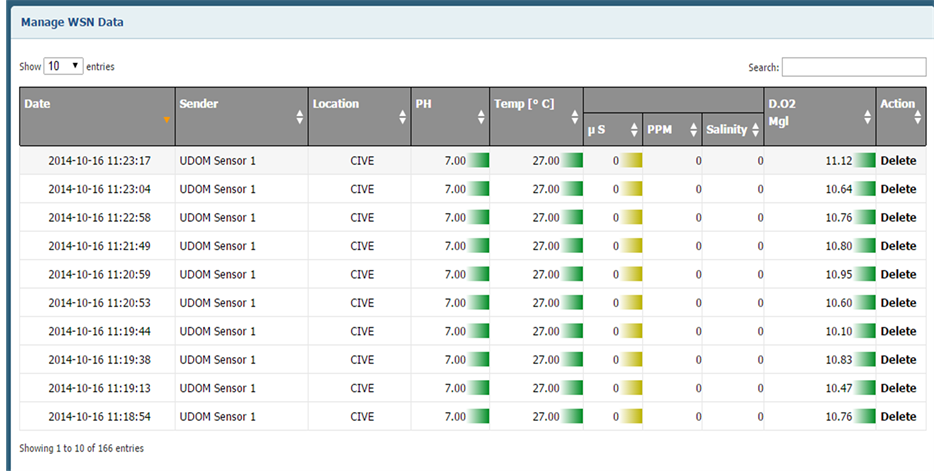 (b)
(b)
Figure 10. Data Visualizations: (a) Variations patterns representation of WSN; (b) Tabular and graphical form representation of WSN dataset.
4. Conclusion
In this work, the development and demonstration of a low cost, continuous water quality monitoring WSN system prototype is described. The system uses low cost sensors and open source hardware aiming at providing continuous water quality measurements at substantially reduced cost. Preliminary field test results demonstrated that with appropriate calibration, the system has capability to continuously measure water quality parameters and transmit them to a database in real-time. With the use of web-based portal and mobile phones platforms, the values of measured parameters are displayed in easy-to-comprehend graphical and tabular formats anytime and anywhere. This capability has potential to enhance accountability, transparency, and participation which are attributes for good governance of water resources. More testing of the prototype is needed to identify areas that will require fixing.
Acknowledgements
Research team acknowledges Lake Victoria Research Initiative (VicRes), Inter-University Council for East Africa (IUCEA) and Swedish International Development Agency (SIDA) for supporting the research of which this paper is one of the outputs. The team also acknowledges the kind and material support received from stakeholders at different levels in the Lake Victoria Basin during the entire period of the research. The team wishes to thank the management and staff of Busitema University, Kigali Institute of Science and Technology and the University of Dodoma for their administrative support.
References
- Sridharan, S. (2014) Water Quality Monitoring System Using Wireless Sensor Network. International Journal of Electronic Communications Engineering Advanced Research, 3, 399-402.
- Losilla, F., Garcia-Sanchez, A.-J., Garcia-Sanchez, F., Garcia-Haro, J. and Haas, Z.J. (2011) A Comprehensive Approach to WSN-Based ITS Applications. Sensors, 11, 10220-10265. http://dx.doi.org/10.3390/s111110220
- Chaamwe, N., Liu, W. and Jiang, H. (2010) Wireless Sensor Networks in the Context of Zambia: A Developing Country. 2010 Second International Conference on Information Technology and Computer Science (ITCS), Kiev, 24-25 July 2010, 474-478. http://dx.doi.org/10.1109/ITCS.2010.122
- Zennaro, M., Floros, A., Dogan, G., Sun, T., Cao, Z., Huang, C., Bahader, M., Ntareme, H. and Bagula, A. (2009) On the Design of a Water Quality Wireless Sensor Network (WQWSN): An Application to Water Quality Monitoring in Malawi. 2009 International Conference on Parallel Processing Workshops, Vienna, 22-25 September 2009, 330-336. http://dx.doi.org/10.1109/ICPPW.2009.57
- Kumar, R.K., Mohan, M.C., Vengateshapandiyan, S., Kumar, M.M. and Eswaran, R. (2014) Solar Based Advanced Water Quality Monitoring System Using Wireless Sensor Network. International Journal of Science, Engineering and Technology Research (IJSETR), 3, 385-389.
- Rao, A.S., Marshall, S., Gubbi, J., Palaniswami, M., Sinnott, R. and Pettigrove, V. (2013) Design of Low-Cost Autonomous Water Quality Monitoring System. 2013 International Conference on Advances in Computing, Communications and Informatics (ICACCI), Mysore, 22-25 August 2013, 14-19.
- Boonsong, W. and Ismail, W. (2014) Wireless Monitoring of Household Electrical Power Meter Using Embedded RFID with Wireless Sensor Network Platform. International Journal of Distributed Sensor Networks, 2014, Article ID: 876914.
- XCTU Software. http://www.digi.com/products/wireless-wired-embedded-solutions/zigbee-rf-modules/xctu