Wireless Sensor Network
Vol.4 No.6(2012), Article ID:19702,6 pages DOI:10.4236/wsn.2012.46024
Effect of Impulse Noise on Wireless Relay Channel
Department of Electrical and Computer Engineering, The University of Western Ontario, London, Canada
Email: {sghadim, hjamil2, slprimak}@uwo.ca, sidhu@eng.uwo.ca
Received March 1, 2012; revised May 10, 2012; accepted May 29, 2012
Keywords: Impulse Noise; Smart Grid; Grid Line Communication; Co-Operative Communication
ABSTRACT
Relay Network is most suited wireless communication technique for future Smart Grid, because it has a lot of advantages such as reliability against failures and offers redundancy, self-configuring and self-healing. For example if one nod or path is blocked, it can find a neighbour node, by different algorithms schemes. The purpose of this paper is to simulate wireless relay channel model in presence of impulse noise and computing the BER performance of channel data. It makes to be useful for a designer to predicting error and behaviour of a channel for optimum design, to be able choose a robust channel.
1. Introduction
Impulse noise is a noise which often generates in power line and can be a source of error in transmission of data in a channel and it is a major contributor to the increasing of the error rate. In some cases e.g. in Smart Grid [1,2], errors are not tolerated and it may cost big damages to infrastructure of a Grid or jeopardize live. The data error may also degrade capacity. Source of some type impulse noises are natural such as lightning, but some are manmade such as mechanical switches, breakers, even light switches or breakers, power lines, car ignitions, fluorescent light, which calls industrial impulse noise increasing day by day [3].
In case of impulse noises caused by lightning discharges occur randomly in time and geographical location. Nature of these discharges yield random pulses of electromagnetic field at a given receiving antenna [4]. In case of man-made impulse noises, when wireless relays connect via sensors to infrastructure of e.g. Grids to send/ receive control data and usually located near breakers or transformers or generation etc. In this circumstance sensors or relays are spurious emissions, EMI or radiated antennas for impulse noise from various types of equipments in Grids [5,6]. In case of transmission of impulse noise wire, generally wireless relay connected by sensors via wire, and in this case pre-filters are an effective method to reduce impulse noise, but even tails of the filtered impulse noise will carry most of the noise energy to channel [7].
Figure 1 plotted by taking data from the ITU-R recommendation P.372-7, which describe the levels of various types of electromagnetic noise in frequency range 108 to 1011 Hz i.e., 100 MHz to 100 GHz. The minimum noise is given by solid curves, while some other noises of interest are given by dashed curves [8].
Future of Smart Grid will be based on intelligence, which is directly related to ability of bidirectional communication through whole Grid for different kinds of traffic during different situations, from Grid failures, natural catastrophes to attacks. There are several ways to handle two way data communication, which cover the Smart Grid requirements.
One of most suitable communication ways for smart grid is co-operative networks. The advantages of cooperative networks are: reliability, mobility, easy installation, cost effective, high capacity and dynamical architecture.
Realization of co-operative relay networks depends on efficiency and reliability of channel capabilities. The measurements [9] have shows that in real-world also in power delivery and substations, background noise e.g. Impulse noise has direct impact on channel quality and capacity.
Co-operative communication has recently drawn tremendous attraction to the research community. It is a new communication paradigm which generates independent paths between the user and the base station by introducing a relay channel [10]. In co-operative relay network two sources exchange their information with help of at least one node, namely relay [11], which processes and intensifies the signal strength of the transmitted signal to be less prone to the fading and interference.
There are several schemes used in co-operative relay network namely Amplify and Forward (AF) [12], Denoise-and-Forward (DF) [13] which is also known as
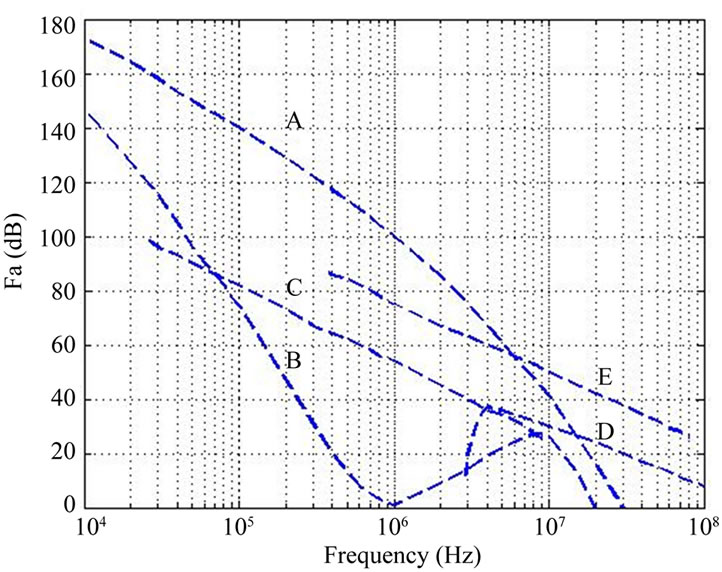
Figure 1. Fa versus frequency (104 to 108 Hz) A: Atmospheric noise, value exceeded 0.5% of time; B: Atmospheric noise, value exceeded 99.5% of time; C: Man-made noise, quiet receiving site; D: Galactic noise; E: Median business area man-made noise; The Fa is external noise factor.
Physical Network Coding (PNC) [14], Analogue Network Coding (ANC) [15] etc. Depending upon the requirements of the network system, different scheme can be used.
2. Characteristic of Impulse Noise
Impulse noise is sporadic, non-contiguous, consisting of irregular pulses or noise spikes of short duration and of relatively high amplitude as high as several hundred micro-volts and may occur in bursts or discrete impulses, as shown in Figure 2. It is measured by the number of “hits” or “spikes” per interval of time above a certain threshold [16,17]. In other words, it’s a measurement of the recurrence rate of noise peaks over a specified level. Each spike has a broad spectral content.
In order to desire impulse noise characteristic, a mathematical model needs. We have applied BernoulliGaussian impulse noise model of Poisson arriving delta Rayleigh probability density function [18].
Bernoulli distribution is a discrete probability distribution, which takes value 1 with success probability p and value 0 with failure probability , and mean p.
The characteristic function of the Bernoulli distribution is:
 (1)
(1)
Signal S, transmitted over a channel with impulsive  and White Gaussian noise N and signal R received, as described by the following equation. See Figure 3 too.
 (2)
(2)
N is AWGN with mean zero and variance  and
and  is the impulse noise.
  is product of AWGN and
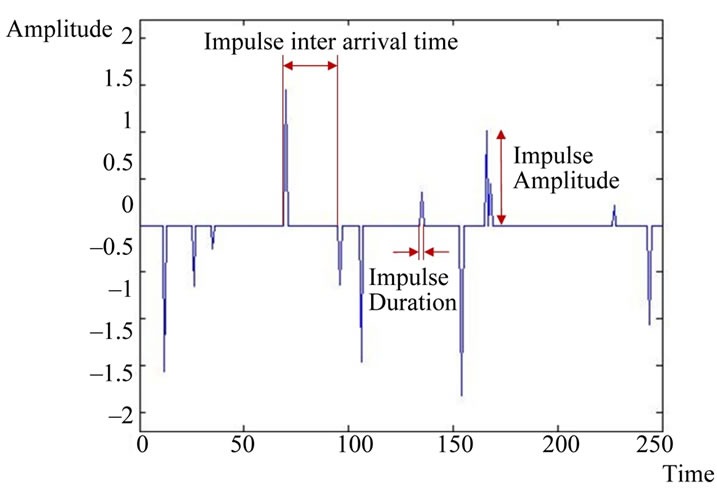
Figure 2. Character of impulse noise.
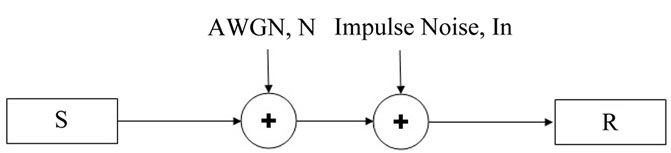
Figure 3. Gaussian and impulse noise channel.
Bernoulli process, also: . All these parameters assumed to be complex and independent of each others. This means that each data symbol independently can be hit with probability of p and with random amplitude N. The characteristic function
  of total noise of
  From (1) is:
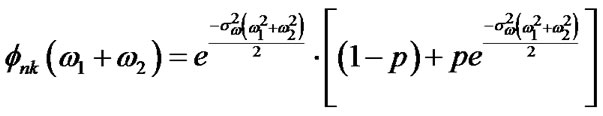 (3)
(3)
This equation has been to a great degree used by others [19,20] and gives a realistic characterization of real impulse noise outlook.
System
Wireless communication is a well known and is very popular technique, because of advantages like; mobility (wireless devices easily move within the wireless range), easy installation (no cable needs), cost effective (cost of cabling, running and maintaining is minimal), high capacity (cable has less capacity), dynamical architecture (Easley can redesign). Most popular wireless technique for smart gird is cooperative networks or Wireless Relay Network (WRN) [21].
Let us consider a bidirectional relay network consisting of two sources and a relay. Each node has a single antenna and it operates in half duplex mode. S1, S2 and R are used to denote source-I, source-II and the relay respectively as shown in the Figure 4 [22,23].
Let  denotes binary information from the source
 . The BPSK modulated signal of
  will then be
  where
where  and
and  for i =
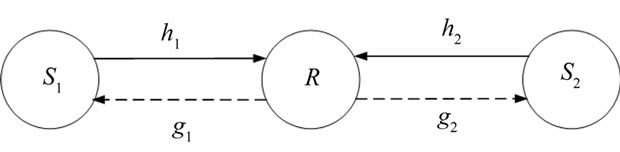
Figure 4. System model for co-operative communication system.
[1,2]. Let us denote the complex channel coefficient between  and R by hi during first time slot and
  during the second time slot. Channels can be modelled as
 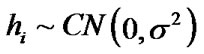 for i = 1, 2 where
 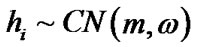 indicates h is circularly symmetric complex valued Gaussian random variable with mean m and variance
 . For simplicity it can be assumed that channel coefficients are constant in two consecutive time slots. It means that
 . It is assumed that the phase of the transmitted signals from S1 and S2 are synchronized at the relay node.
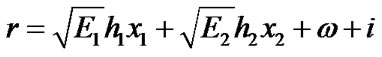
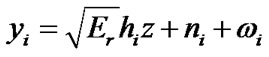
During first time slot, both S1 and S2 transmit their information  and
and  respectively to the relay node R. The signal received by the relay node can be shown by
 (4)
(4)
where  is the transmission power at
 ,
,  is the additive white Gaussian Noise (AWGN) and i is impulse noise which can be defined as Bernoulli-Gaussian Model [24]. In this system, it is assumed
  so that the received signal r at relay becomes the same as the Figure 5 [25].
From Figure 5,  defines the decision boundary to map z which is the information the relay transmits to both S1 and S2 during second time slot. When [x1, x2] is equal to [–1,1] or [1,1], it will fall into the decision region
  and hence the relay would transmit –1 towards both sources. Again when [x1, x2] is equal to [1, 1] or [–1, –1], it will fall into the decision region outside of
  and the relay would transmit 1 towards both sources.
Once the mapping is done at the relay node, the relay forwards the XORed symbol z towards the sources over the broadcast channel. The signal received by  is given by
 (5)
(5)
where  means transmission power at relay,
  means AWGN at
  and
and  means impulse noise at
 . After receiving XORed signal from the relay node, source nodes S1 and S2 decode the received signal and detect the signal sent from peer node by executing XOR operation with the detected signal from relay node and its own signal.
3. Simulation and Result
In this section performance evaluation will be shown for
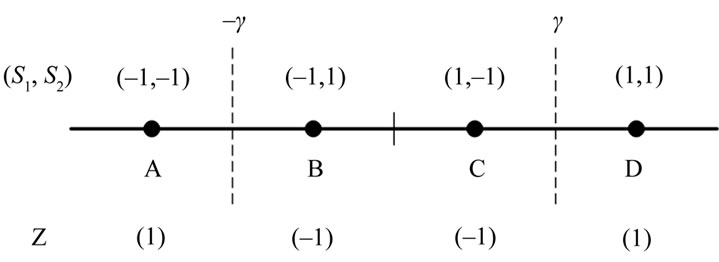
Figure 5. Constellation of received signal at the relay node.
cooperative relay communication system under Rayleigh fading condition with AWGN as well as IN environment. It will be shown in two steps. At first Signal to Noise Ratio (SNR) will be varied and corresponding Error Rate will be observed to analyze the system performance. In that case a fixed amount of Impulse Noise will be in effect for each value of SNR.
Secondly Signal to Impulse noise Ratio (SIR) will be varied and similarly corresponding Error Rate will be observed to study the overall performance. In this case SNR will be fixed to a certain value.
3.1. Varying SNR
In this step error rate is measured while varying the value of SNR. The value of SIR is kept constant. Later the value of SIR is changed to another value to visualize how the performance changes. For a single value of SIR, different curves are considered by changing the value of p.
Figures 6-8 represent the performance graphs of cooperative relay system in impulsive noise environment considering the value of SIR as 5 dB, 10 dB and 15 dB respectively. For each case, when the value of p is increasing, the performance deteriorates. Basically p is the probability of adding impulse noise with the system. In other words p implies how frequently impulse noise is adding to the received signal.
For example, when the value of p is equal to 1, it means that Impulse Noise is considered for each bit of the information stream.
When p is equal to zero, it indicates that there is no impulse noise is added with the received signal. As expected when the value of p is increasing from 0 to 1, the performance gradually deteriorates. Similarly when the value of SIR is increased, the performance improves since the since strength is increasing or, in other words, impulse noise power is decreasing. It is also observed that while p has a value greater than 0 the graph saturates after a certain value. It is happening due to the fact that although the value of SNR is increasing which indicates less effect of noise, there is still a certain amount of impulse noise adding to the received signal. Since the increment of SNR does not have any hold on that, the performance curves saturate after a certain SNR value.
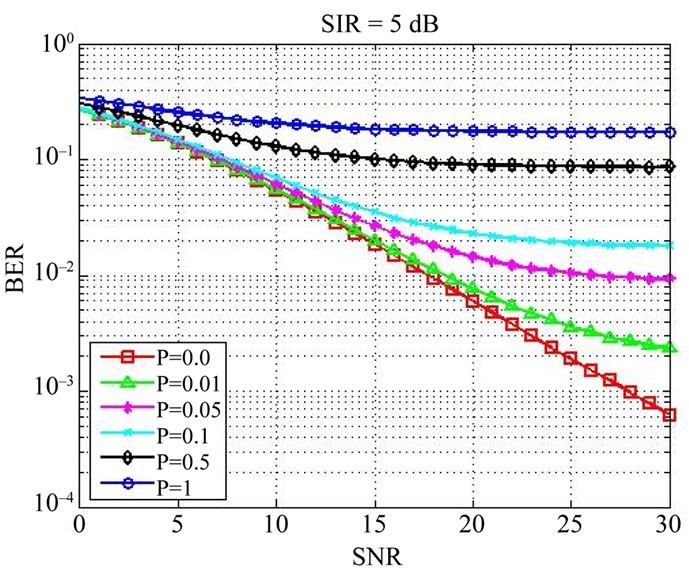
Figure 6. Effect of varying SNR in a co-operative communication system while SIR = 5 dB.
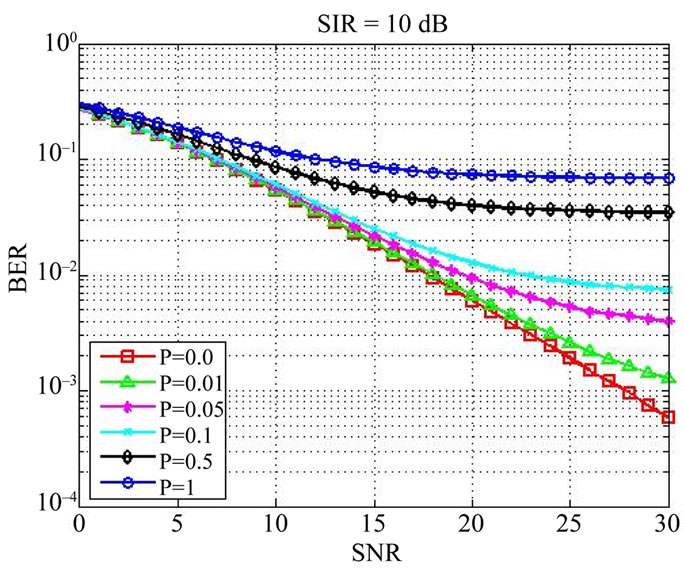
Figure 7. Effect of varying SNR in a co-operative communication system while SIR = 10 dB.
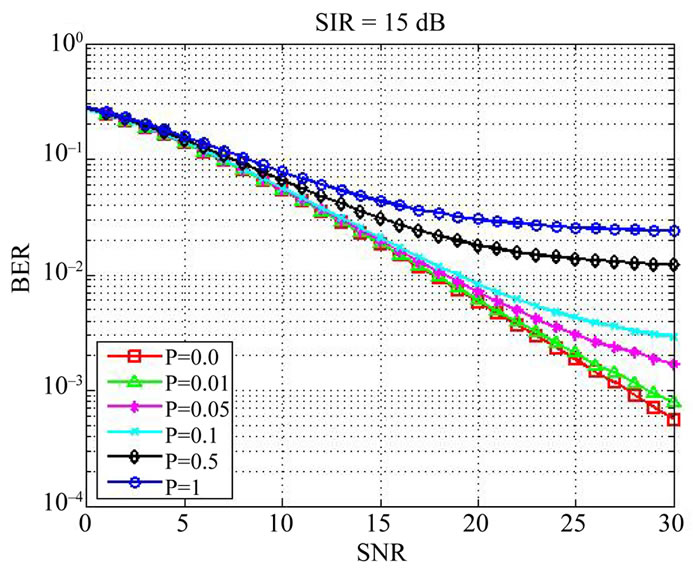
Figure 8. Effect of varying SNR in a co-operative communication system while SIR = 15 dB.
3.2. Varying SIR
Performance of the co-operative communication system is studied in this section while varying the value of SIR and putting the SNR into a fixed value. The value of SNR is then changed to another value to compare the system performance.
For each scenario, the value of p is changed from 0 to 1 to analyze the impact of impulse noise to the system. Three different scenarios are considered to investigate the overall system performance while varying SIR. Scenarios are selected for different values of SNR which are for 5 dB, 10 dB and 15 dB shown in Figures 9-11 respectively. For each case the value of p is varied from 0 to 1 which, in fact, describes the effect of impulse noise to the system. From the figures, it is clear that as the value of p is increasing, the performance of the system is getting worse. One interesting fact can be observed from here that whenever the value of p is equal to zero, the
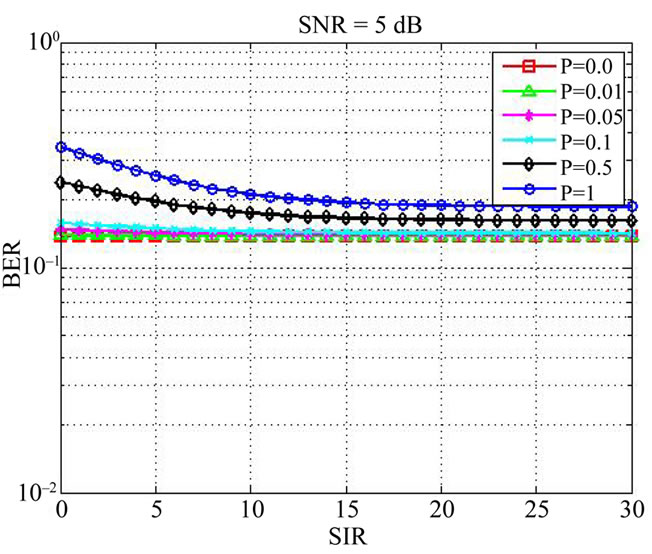
Figure 9. Effect of varying SIR in a co-operative communication system while SNR = 5dB.
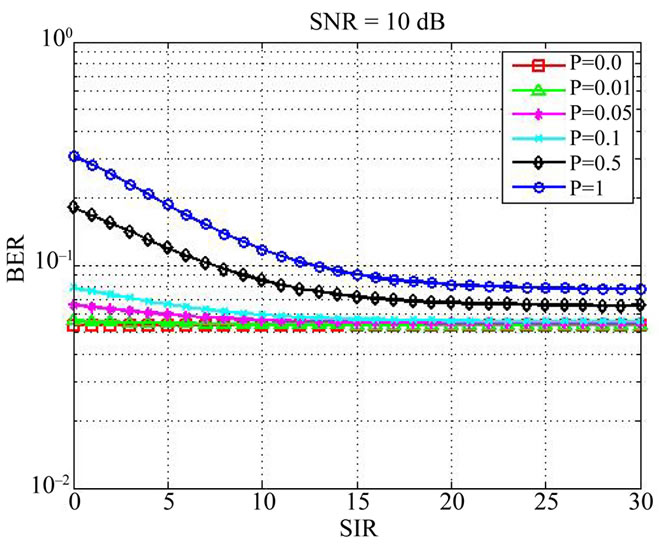
Figure 10. Effect of varying SIR in a co-operative communication system while SNR = 10 dB.
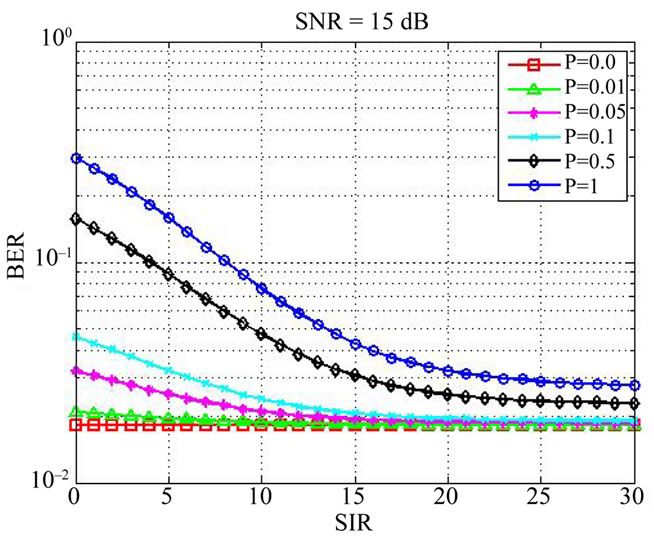
Figure 11. Effect of varying SIR in a co-operative communication system while SNR = 15 dB.
performance curve is just parallel to X-axis. When the value of p is zero, it implies that there is no impulse noise adding to the system. So in such case, there is no impact of increasing the value of SIR and the system will only experience a fixed value of AWGN which makes the curve parallel to the X-axis. Saturation effect is similar to the effect described for varying SNR.
3.3. Conclusion
In this paper it is tried to investigate how the system performs when it is required to exchange the information among different nodes through co-operative communication in a smart grid system. It is known that impulse noise can deteriorate the overall system performance drastically in communication in a smart grid system [9]. System performance was evaluated in such environment varying SNR keeping SINR fixed and vice versa. While one parameter remained fixed, simulation was also done for different values of other parameter and then result was analyzed. From the simulation result it is proved that impulse noise can change the overall performance severely depending upon the intensity of impulse noise. New researches can be initiated to mitigate the effect of impulse noise in such environment.
REFERENCES
- C. Cecati, G. Mokryani, A. Piccolo and P. Siano, “An Overview on the Smart Grid Concept,” The 36th Annual Conference on IEEE Industrial Electronics Society, Glendale, 7-10 November 2010, pp. 3322-3327.
- T. Overman and R. Sackman, “High Assurance Smart Grid: Smart Grid Control Systems Communications Architecture,” The 1st IEEE International Conference on Smart Grid Communications (SmartGridComm), Gaithersburg, 4-6 October 2010, pp. 19-24.
- International Radio Consultative Committee, “World Distribution and Characteristics of Atmospheric Radio Noise,” International Telecommunication Union, Geneva, 1964.
- P. Bello, “Error Probabilities Due to Atmospheric Noise and Flat Fading in HF Ionospheric Communication Systems,” IEEE Transactions on Communication Technology, Vol. 13, No. 3, 1965, pp. 266-279. doi:10.1109/TCOM.1965.1089131
- E. Bolton, “Man-Made Noise Study at 76 and 200 khz,” IEEE Transactions on Electromagnetic Compatibility, Vol. 18, No. 3, 1976, pp. 93-96. doi:10.1109/TEMC.1976.303462
- A. D. Spaulding and R. T. Disney, “Man-Made Radio Noise, Part 1: Estimates for Business, Residential, and Rural Areas,” Office of Telecommunications Report OT 74-38, International Telecommunication Union, Geneva, 1974.
- P. Bello and R. Esposito, “A New Method for Calculating Probabilities of Errors Due to Impulsive Noise,” IEEE Transactions on Communication Technology, Vol. 17, No. 3, 1969, pp. 368-379. doi:10.1109/TCOM.1969.1090105
- International Telecommunication Union, “Radio Noise, Recommendation ITU-R P.372-7l,” International Telecommunication Union, Geneva, 2001.
- V. Gungor, B. Lu and G. Hancke, “Opportunities and Challenges of Wireless Sensor Networks in Smart Grid,” IEEE Transactions on Industrial Electronics, Vol. 57, No. 10, 2010, pp. 3557-3564. doi:10.1109/TIE.2009.2039455
- K. J. R. Liu, A. K. Sadek, W. Su and A. Kwasinski, “Cooperative Communications and Networking,” Cambridge University Press, Cambridge, 2009.
- M. Ju and I.-M. Kim, “Error Performance Analysis of BPSK Modulation in Physical-Layer Network-Coded Bidirectional Relay Networks,” IEEE Transactions on Communications, Vol. 58, No. 10, 2010, pp. 2770-2775. doi:10.1109/TCOMM.2010.082010.090256
- P. Popovski and H. Yomo, “Wireless Network Coding by Amplify-and-Forward for Bi-Directional Traffic Flows,” IEEE Communications Letters, Vol. 11, No. 1, 2007, pp. 16-18. doi:10.1109/LCOMM.2007.061436
- P. Popovski and H. Yomo, “The Anti-Packets Can Increase the Achievable Throughput of a Wireless MultiHop Network,” IEEE International Conference on Communications, Istanbul, 11-15 June 2006, pp. 3885-3890.
- S. L. Zhang, S.-C. Liew and P. P. Lam, “Physical-Layer Network Coding,” ACM MobiCom, Los Angeles, 24-29 September 2006, pp. 358-365.
- S. Katti, S. Gollakota and D. Katabi, “Embracing Wireless Interference: Analog Network Coding,” ACM SIGCOMM Computer Communication Review, Vol. 37, No. 4, 2007, pp. 397-408. doi:10.1145/1282427.1282425
- S. Kuramoto, F. Takemoto and M. Hattori, “A Study of Impulse Noise Caused by Connecting or Disconnecting Coaxial Cable between Equipment,” IEEE International Symposium on Electromagnetic Compatibility, Atlanta, 14- 18 August 1995, pp. 501-506.
- Y. Chew, T. Tjhung, T. He and C. Ko, “Estimation of BER Performance over an Impulse Noise Channel,” Electronics Letters, Vol. 35, No. 4, 1999, pp. 273-274. doi:10.1049/el:19990185
- A. Papoulis and S. Pillai, “Probability, Random Variables, and Stochastic Processes,” McGraw Hill, Boston, 2002.
- M. Ghosh, “Analysis of the Effect of Impulse Noise on Multicarrier and Single Carrier QAM Systems,” IEEE Transactions on Communications, Vol. 44, No. 2, 1996, pp. 145-147. doi:10.1109/26.486604
- P. Enge and D. Sarwate, “Spread-Spectrum Multiple-Access Performance of Orthogonal Codes: Impulsive Noise,” IEEE Transactions on Communications, Vol. 36, No. 1, 1988, pp. 98-106. doi:10.1109/26.2733
- K. J. Ray Liu, A. K. Sadek and W. Su “Cooperative Communications and Networking,” Cambridge University, Cambridge, 2008.
- Y. Wu, P. A. Chou and S.-Y. Kung, “Information Exchange in Wireless Networks with Network Coding and Physical-Layer Broadcast,” Microsoft Research Technical Report MSR-TR-2004-78, 2004.
- R. Ahlswede, N. Cai, S.-Y. Li and R. Yeung, “Network Information Flow,” IEEE Transactions on Information Theory, Vol. 46, No. 4, 2000, pp. 1204-1216. doi:10.1109/18.850663
- M. Ghosh, “Analysis of the Effect of Impulse Noise on Multicarrier and Single Carrier QAM Systems,” IEEE Transactions on Communications, Vol. 44, No. 2, 1996, pp. 145- 147. doi:10.1109/26.486604
- E. Peh, Y.-C. Liang and Y. L. Guan, “Power Control for Physical-Layer Network Coding in Fading Environments,” IEEE 19th International Symposium on Personal, Indoor and Mobile Radio Communications, Cannes, 15-18 September 2008, pp. 1-5.