Journal of Water Resource and Protection
Vol.5 No.12(2013), Article ID:40546,5 pages DOI:10.4236/jwarp.2013.512120
Water Turbidity as One of the Trophic State Indices in Butrinti Lake
1Department of Physics, University of Vlora, Vlora, Albania
2Department of Physics, University of Gjirokastra, Gjirokastra, Albania
Email: v.cako69@hotmail.com
Copyright © 2013 Veledin Çako et al. This is an open access article distributed under the Creative Commons Attribution License, which permits unrestricted use, distribution, and reproduction in any medium, provided the original work is properly cited.
Received September 3, 2013; revised October 2, 2013; accepted November 1, 2013
Keywords: Ecosystem; Water Transparency; Trophic Status; Turbidity; Turbidmeter; Secchi Disc
ABSTRACT
In this paper we are presenting observations, data and some conclusions regarding the water turbidity and transparency of the aquatic ecosystem of Butrinti Lake in southern Albania. Located amidst a major tourist attraction area, Butrinti Lake is fed by fresh waters from surrounding areas and discharges into Ionian Sea. Although development is preset in the area, it is still minor as part of the area is a National Park. Turbidity, as an optical property which describes the cloudiness of the water, is a measure of the degree to which the water becomes less transparent due to the presence of suspended particulates, including sediments and phytoplankton. The water turbidity parameters were measured every two weeks over a year, monitoring three selected stations in this water ecosystem. Turbidity of water in such ecosystems is measured in FTU (Formazin Turbidity Units) using a portable turbid meter (in our case type HANNA HI 93703-11), which measures the intensity of light scattered at 90 degrees, as a beam of light passes through a water sample. In addition, turbidity is evaluated using a Secchi disk. The depth (Secchi depth) until the disk can be no longer seen by the observer is recorded as a measure of the transparency of the water (inversely related to turbidity). The Secchi disk has the advantages of integrating turbidity over depth (where variable turbidity layers are present). The relationship between the depth of the viewing disk and the turbidity can be characterized by an inverse curvilinear one. The defined trend line can be expressed by the same curve related to the data of Butrinti Lake. An R2 Value of 0.85 was calculated for the above equation. Variations were observed on turbidity level of the selected stations in this ecosystem. These differences on the turbidity values of selected stations of water body can be explained by the communications sea-lagoon, fresh water supply as well as by the pollution due to human activity near a certain station. The monitored water ecosystem can be characterized by certain level of turbidity, based on the trophic state classification by Hakanson and Carlson. Furthermore, relationship between turbidity and trophic state evaluated by other bio-indicators of the monitored ecosystems is analyzed.
1. Introduction
Transparency as a measure of water clarity can be used to compile an analytical trend for a body of water, the localization of transparency differences within a body of water, and to compare different water bodies. If one is including the measurement of other parameters such as the presence of chlorophyll and of total phosphorus, it will provide important information for assessing the relationship between these parameters and trophic state of water body. Turbidity, as an optical characteristic that describes the cloudiness of the water, measures the degree of transparency loss due to the presence of suspended material including sediments and phytoplankton. Turbidity is defined by the amount of scattering of sunlight in water; higher degree of light scattering means higher turbidity that causes such scattering [1,2]. Turbidity has an impact on flora and fauna of the water body. Suspended particles absorb sunlight and then become warm, so the turbid water becomes warm. As water gets warmer the concentration of oxygen dissolved in water is reduced. Scattering of light by particulates impairs the photosynthetic activity of plants and algae, thus contributing to further reduction of dissolved oxygen in water and worsening conditions for aerobic life like fish and shell fish. Turbidity and transparency of water are related to the types and concentration of particulate suspended in the body of water. Such particulate can be clay, particles found in organic and inorganic matter, dissolved organic ingredients, plankton and microscopic organisms (of diameter 10 nm up to 0.1 mm) [3,4]. Turbidity is associated with diffusion or scattering of light by micro particles, while water transparency is related to degree of visibility in the water. Both together can change seasonally given the biological activity of the water body. Turbidity should be measured in the respective areas of target ecosystems. This parameter is measured using a turbid meter. Transparency, which indicates the level of biological activity, can be measured simply by using a Secchi disk [5,6]. Secchi disk has the advantage of integrating along the dispersion and absorption of sunlight in the water column, where stratigraphic change of turbidity is present. Secchi depth, which measures the transparency of the water, is subject to the concentration of particles dissolved in water, which in the end determines the amount of biomass. Transparency increases as the development of algae and amount of materials suspended in water decreases. Transparency may also be influenced by the amounts of nutrients, for instance phosphorus, which enters into the body of water from sources such as plantations, septic systems etc. Suspended sedimentations often come from sources such as construction near ecosystems, untreated farm runoffs and urban waste [7]. Aquatic ecosystems can be characterized by their level of eutrophication, in which process the water bodies are enriched with nutrients. These nutrients supported overgrowth of aquatic plants and algae, thus resulting in a lesser aerobic life, whereas peak of such algae overgrowth results in a fish kill. Bodies of water can be classified according to their specific “trophic level”, into four categories. From the lowest to the highest biologic activity: Oligotrophic (water clear and translucent, with low levels of nutrients and algae), Mesotrophic (green waters with easy, yet clear, the average amount of nutrients and algae), Eutrophic (water with a dark green color, high concentration of nutrients and algae), Hypertrophic (enriched in phosphorus and nitrogen, low phytoplankton development, polluted waters). Body of water with low value of trophic index may also be considered Hipertrophic [8,9]. Trophic state index (TSI) [10] is a different classification system. It provides a quantitative index for categorizing the water body, in a range of values from 1 to 100. It is based on the properties of biological productivity in the body of water by using three variables and their relationships: chlorophyll, actual Secchi depth, and total phosphorus, it does not depend on the calculation of the algal biomass. The purpose of this paper is to characterize turbidity of water of Lake Butrinit so we can assess the trophic level of this water body.
2. Material and Methods
2.1. Study Locations
Water body of Lake Butrint was monitored during 2011 on various bio indicators. Sampling sites in this water ecosystem are chosen by reference to criteria such as degree of pollution, freshwater supply of lagoon ecosystems etc.
Lake Butrint—3 stations with respective GPS Coordinates:
Station 1-N-39˚44ʹ41.6ʺ E-020˚01ʹ25.2ʺ;
Station 2-N-39˚45ʹ00.2ʺ E-020˚01ʹ20.7ʺ;
Station 3-N-39˚45ʹ11.7ʺ E-020˚01ʹ15.4ʺ.
2.1.1. Station 1
This station is located in Butrint channel at the entrance of the lagoon. On the bank located in the southern area of the canal, near the station, is a significant amount of waste. At this station the water is relatively calm and clear in July. Transparency of water at this station increased more in August and their color is almost blue. In the next months transparency of the water goes down, with the minimum value of transparency that was observed in the second half of September. In this period water is very unclear and its color tends to be light green. In October, the water is considerably greener, compared to other months.
2.1.2. Station 2
This station is located behind the monastery hill of Butrint. Lagoon coast that is nearest to the station is rocky and contains lower plants (bushes). Contamination of this part of the coast is very low, there is very little waste located at the end of the monastery hill, opposite the station. The water around this station in July is cleaner, compared to the first station. The color of the water at this station is approximately blue. In August, during the monitoring period, the water clarity at this station is highest, and water color is blue. The waters are very unclear in September, whereas in October the water color is green and surface water is foamy, otherwise the water is calm.
2.1.3. Station 3
This station is located inside the lagoon, away from its coast, near one of the areas where oyster is farmed. The waters of the station in all the measurements have been clearer in comparison with water near two other stations. But in two of the expeditions carried out we have observed some oyster processing being conducted which might cause some level of pollution. In September when the clarity of water is lower, water color was light blue. By MidOctober water color was green and considerably greener than it was in the other two stations.
2.2. Methodology Applied
2.2.1. Secchi Disc
Measuring water clarity using Secchi Disk is known as the Secchi Disk Transparency SDT. This is a direct measurement; we measure as how deep the radiation penetrates into the water column. At the same time it constitutes an indirect measurement, as it gives an estimate of amounts of the suspend materials (algae, microscopic organisms and sediments) in the water column. Standard Secchi disk is a weighted steel disc or a hard disk of plastic, with a diameter of 20 cm. The disc is painted all white or checkered black and white alternately. Turbidity water parameters (turbidity and Secchi depth) were measured every two weeks by monitoring all selected stations in each aquatic ecosystem. All measurements were made during the monitoring period from August to November (2011). The measurement procedures were repeated three times at each station during each measurement.
2.2.2. Water Turbidity
Turbidity of water in these ecosystems is measured in FTU which is a unit for measuring widely accessible turbidity (Formazin Turbidity Units), by using a turbid meter. Turbidmeter HANNA HI 93703-11 is a device that has a microprocessor built in for determination of the water turbidity [11,12]. It can perform measurements in a range of 0 - 1000 FTU in two steps: 0.00 to 50.00 FTU and 50 - 1000 FTU, HI 93703-11 is built to perform measurements based on international standards ISO 7027. The device works by passing a beam of infrared light given by the source, which emits at 890 nm wavelength, in a sample column of water, turbidity of which will be measured. Detector is positioned at the angle of about 90˚ against downward direction (direction of incident light), and detects the intensity of light diffused by the particles contained in the sample. The microprocessor converts readings in values of FTU. HANNA turbid meter calibration solutions are manufactured based on standards AMCOAEPA-1, HI 93703-0, HI 93703-10, HI 93703-500, the values 0, 10, and 500 FTU (HI 93703-11 Instruction Manual). Standard calibration solutions, 0 and 10 FTU were taken as the primary point of calibration, because they best fix turbidity values of different water uses, from drinking water to waste water.
2.2.3. Evaluate of Trophic Condition
The rating of trophic condition is based on Carlson and Håkansson trophic status classification criteria based on Secchi depth measurements and calculation of the Carlson index on Secchi distance [8-11]. Carlson trophic state index is used for comparison of different water bodies within an area as well as to compare trophic level changes over time [13-16].
3. Results and Discussion
3.1. The Physical Characteristics of Water
In Lake Butrint measured pH values of water are lower. Variation of pH values in all stations of this ecosystem is almost the same. During the monitoring period, the pH values of the water of Lake Butrint vary in a range of values from 7.8 up to 8.08 (Figure 1). The highest value was measured at the Station 2 in early November, while the lowest value was measured at Station 1 in August. The pH values of the water of Lake Butrint, in the three stations show an increasing trend from August to November.
3.2. Water Transparency
Dynamics of water transparency (Secchi depth) all selected stations in Lake Butrint pose the same changes from August to October. Measured values of transparency of water during the monitoring of Lake Butrint vary in a range from 1.85 m to 4.32 m (Figure 2). The lowest value was measured at Station 1 in the second half of September, while the highest value was measured at Station 3 in August. At Stations 1 and 2 water transparency has smaller values in September and the first half of October (Figure 2). This is explained by the fact that in these two stations pollution level is high, especially in Station 1. The highest values of transparency of water in these two stations during the monitoring period were taken in August and in the second half of October. Transparency of water at Station 3 in Lake Butrint is the highest during the months of August to September, compared with the other
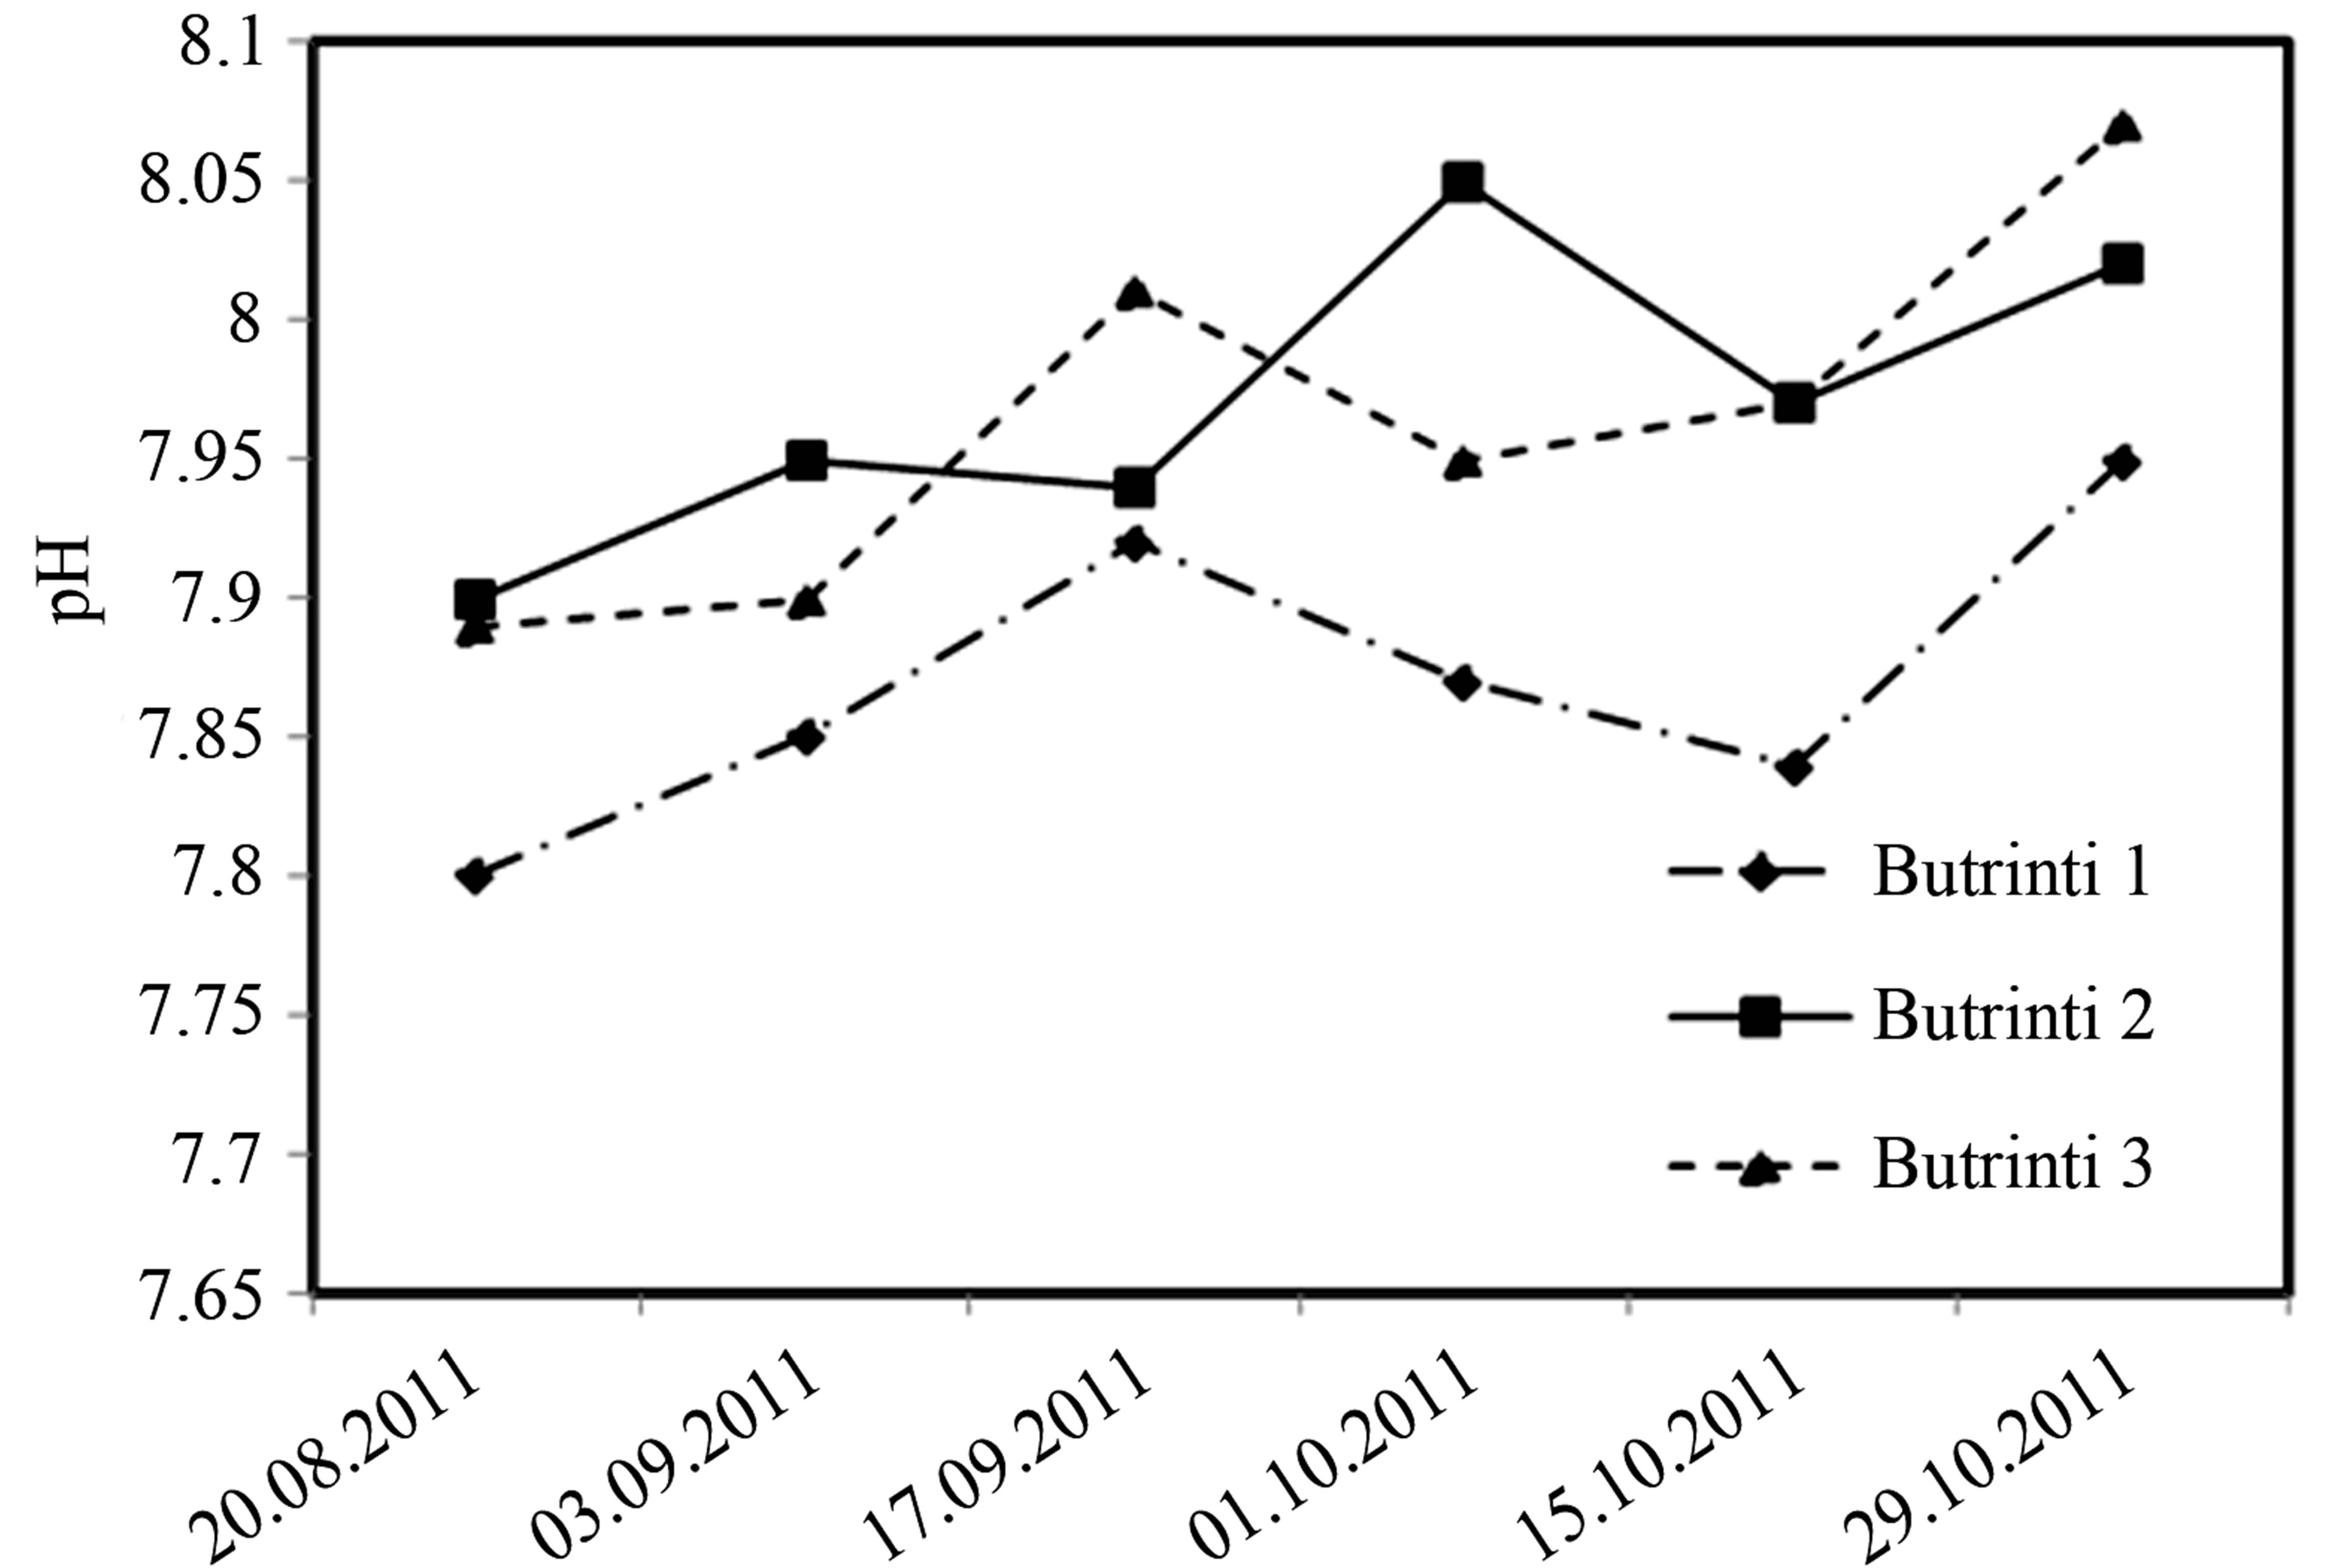
Figure 1. Variation of pH in analyzed stations.
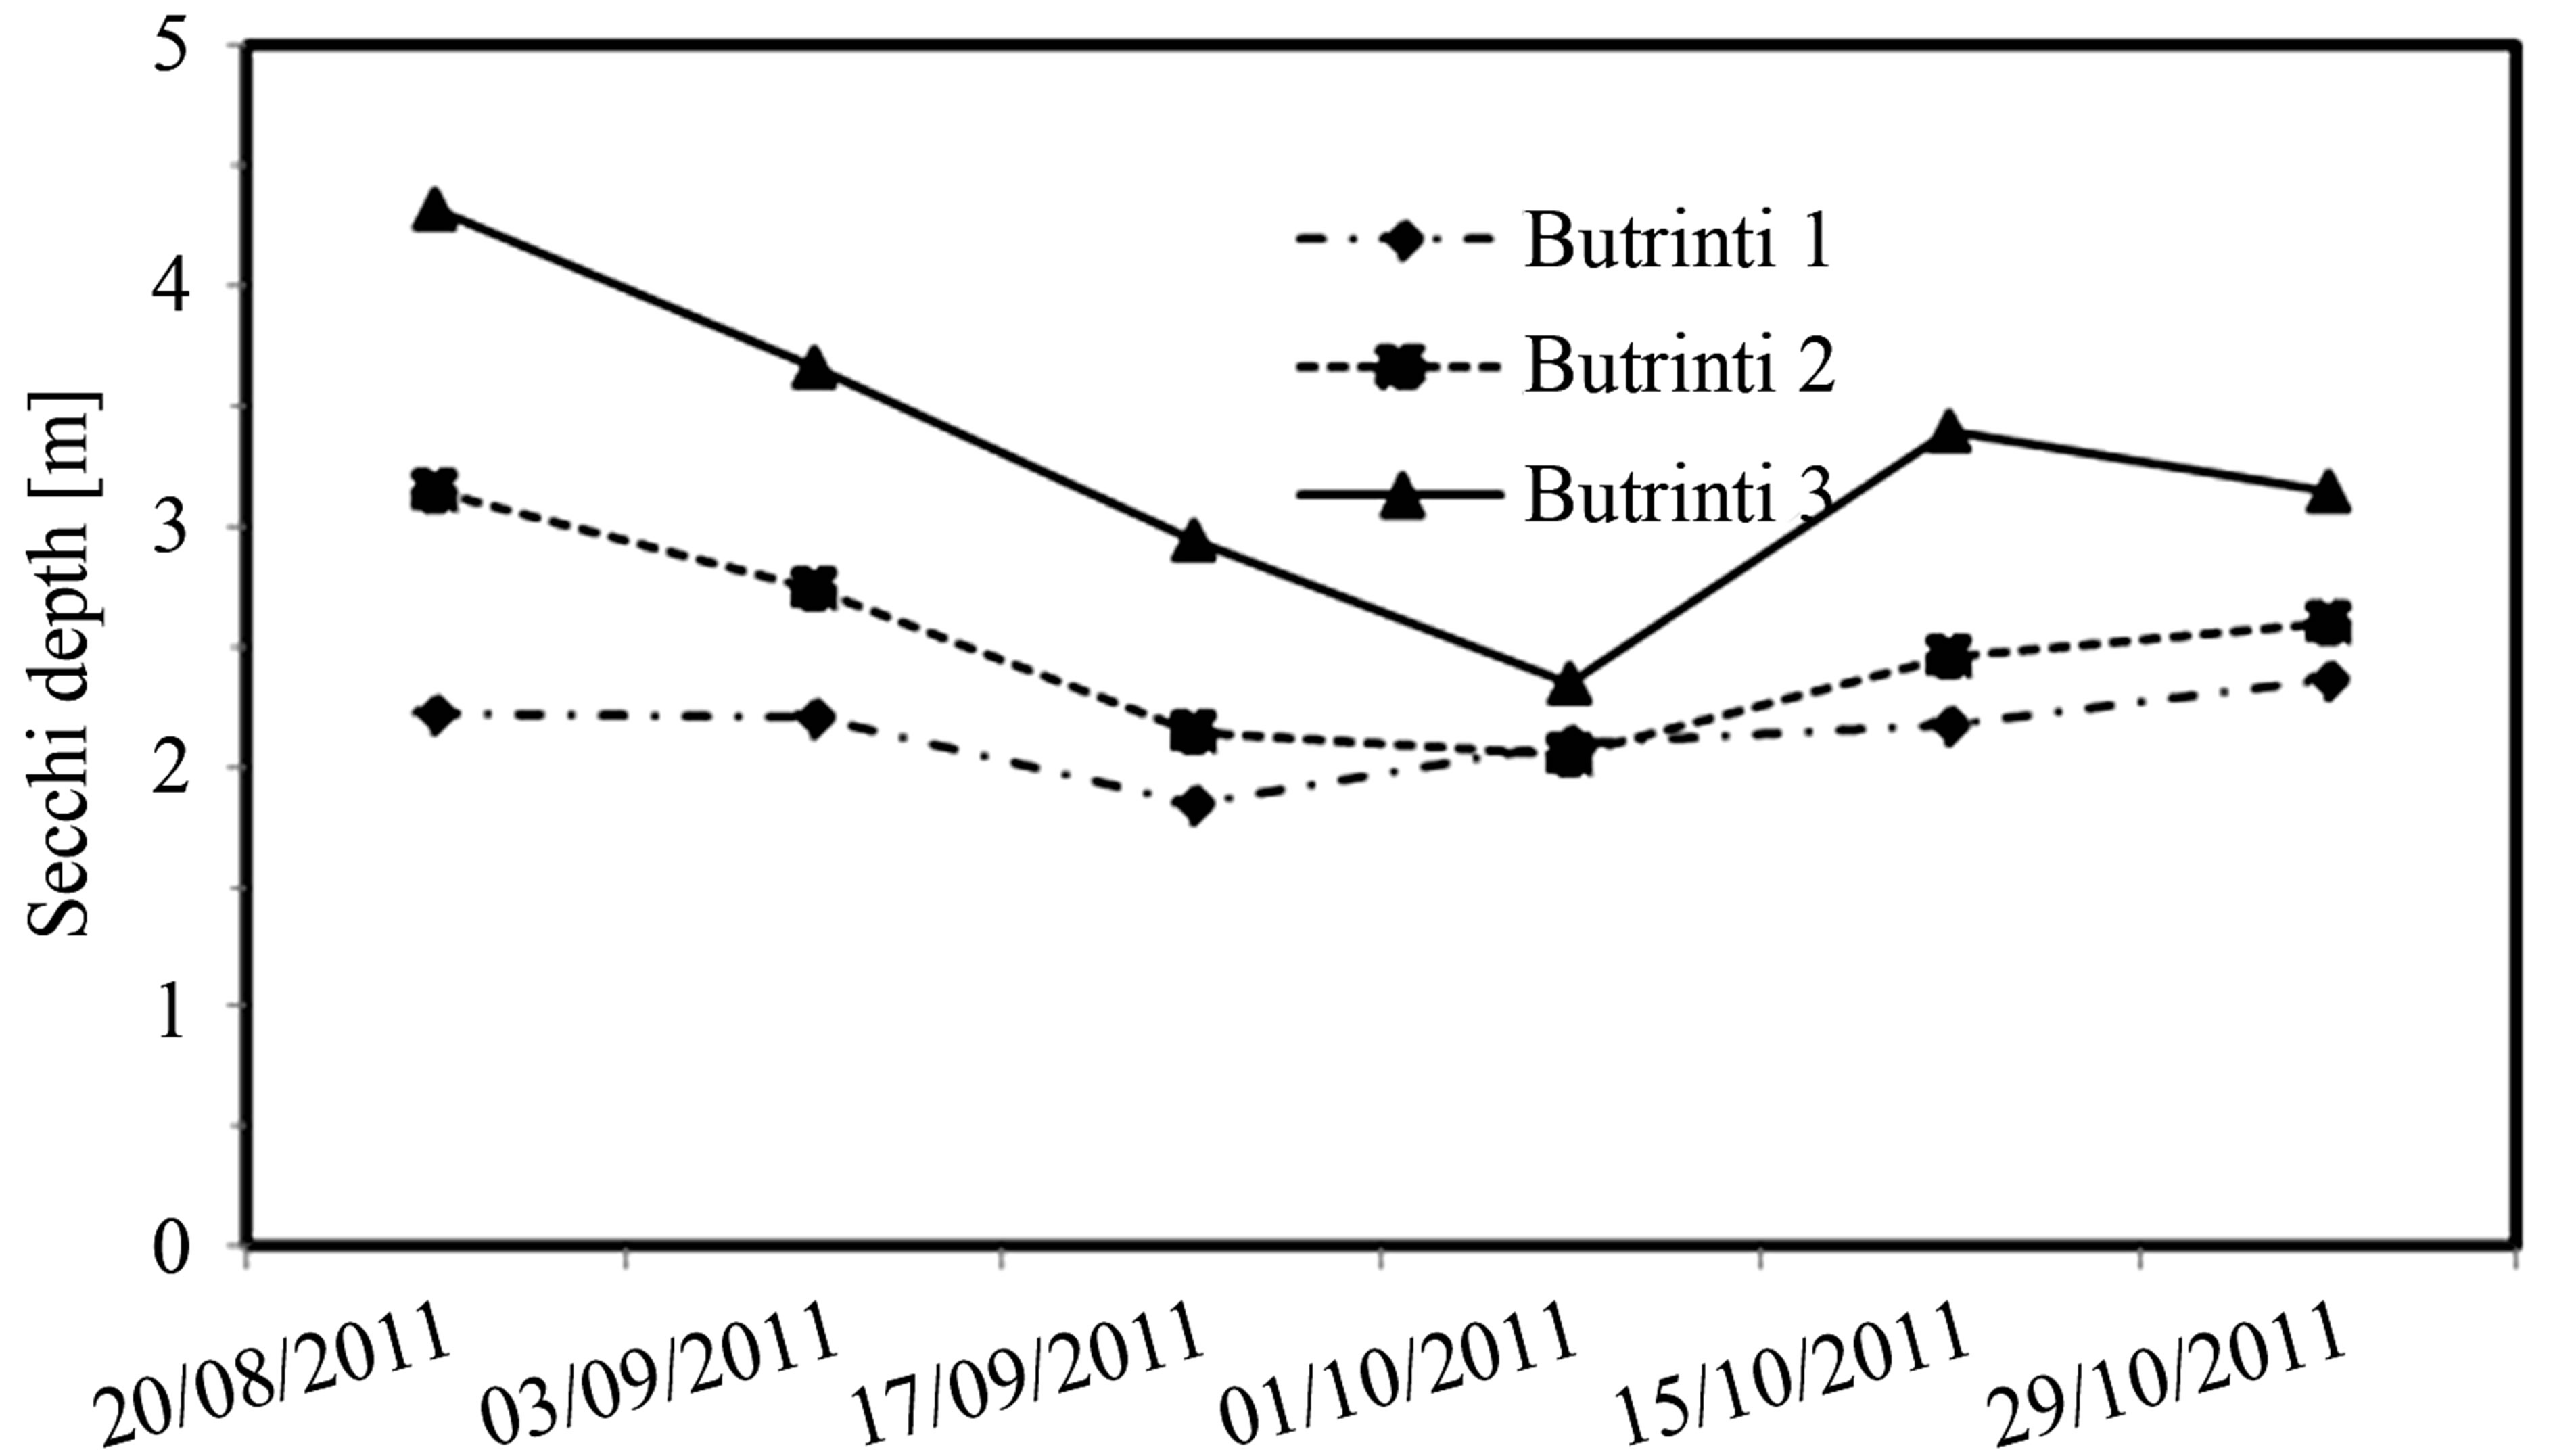
Figure 2. Variation of Secchi depth in Butrinti Lake during monitoring period.
values measured during the monitoring period. Going forward it decreases from August to early October. Water transparency values of the station are much higher than in the other two stations. These differentiations in values arise due to the low level of contamination at this particular station.
In Lake Butrint average values of water transparency expressed as Secchi depth varies between values from 2.15 m to 3.31 m. The highest value is measured at Station 3 while the lower one was measured Station 1. Transparency of water changes throughout the monitoring period at each station as well as it changes between the stations (Figure 3). Looking at the average values of transparency, calculated from all the measured values at each monitoring station, it is concluded that there are differences between these values from one station to another. This fact is expressed in an analytical way and using statistical analysis, specifically analysis of variance (oneway ANOVA). Through this method are evaluated differences between stations, relative to water transparency readings. Differences between the three stations in Lake Butrint are found based on values of this parameter. Station 3 has resulted with significant discrepancies compared to two other stations, whereas Stations 1 and 2 have no significant difference among each other (P < 0.05).
Evaluate of Trophic Status Based on Secchi Depth
In Lake Butrint average values of transparency were lower in Station 1 (2.15 m) and Station 2 (2.52 m), being lowest in Station 1 (Table 1, Figure 3). So in these two spots trophic state of water is evaluated to be mesotrophic state. While on Station 3 transparency displayed a maximum value (3.31 m). However, even in this situation tropic state would be classified again as mesotrophic but in lower level compared with the other two stations.
3.3. Water Turbidity
Turbidity values of water in the lagoon of Butrint vary from 0.41 to 7.15 FTU; lower values were measured at station 3 in August, while the highest value was measured at station 1 in the second half of September (Figure 4). Turbidity dynamics of water in selected stations in Butrint lagoon, demonstrates almost the same change from August to October, especially at Stations 1 and 2, which has high turbidity in September. Turbidity values at these two stations are lower in August. This fact can be explained by the high level of pollution in these two stations, compared to Station 3, especially in summer. Turbidity water Station 3 in Butrint lagoon differs slightly during August to October, compared with other stations. Higher turbidity values at Station 3 are observed in early October. Turbidity values measured at this station are lower than in the two other stations. These differences in water turbidity can be explained by a low level of pollution in the Station as well
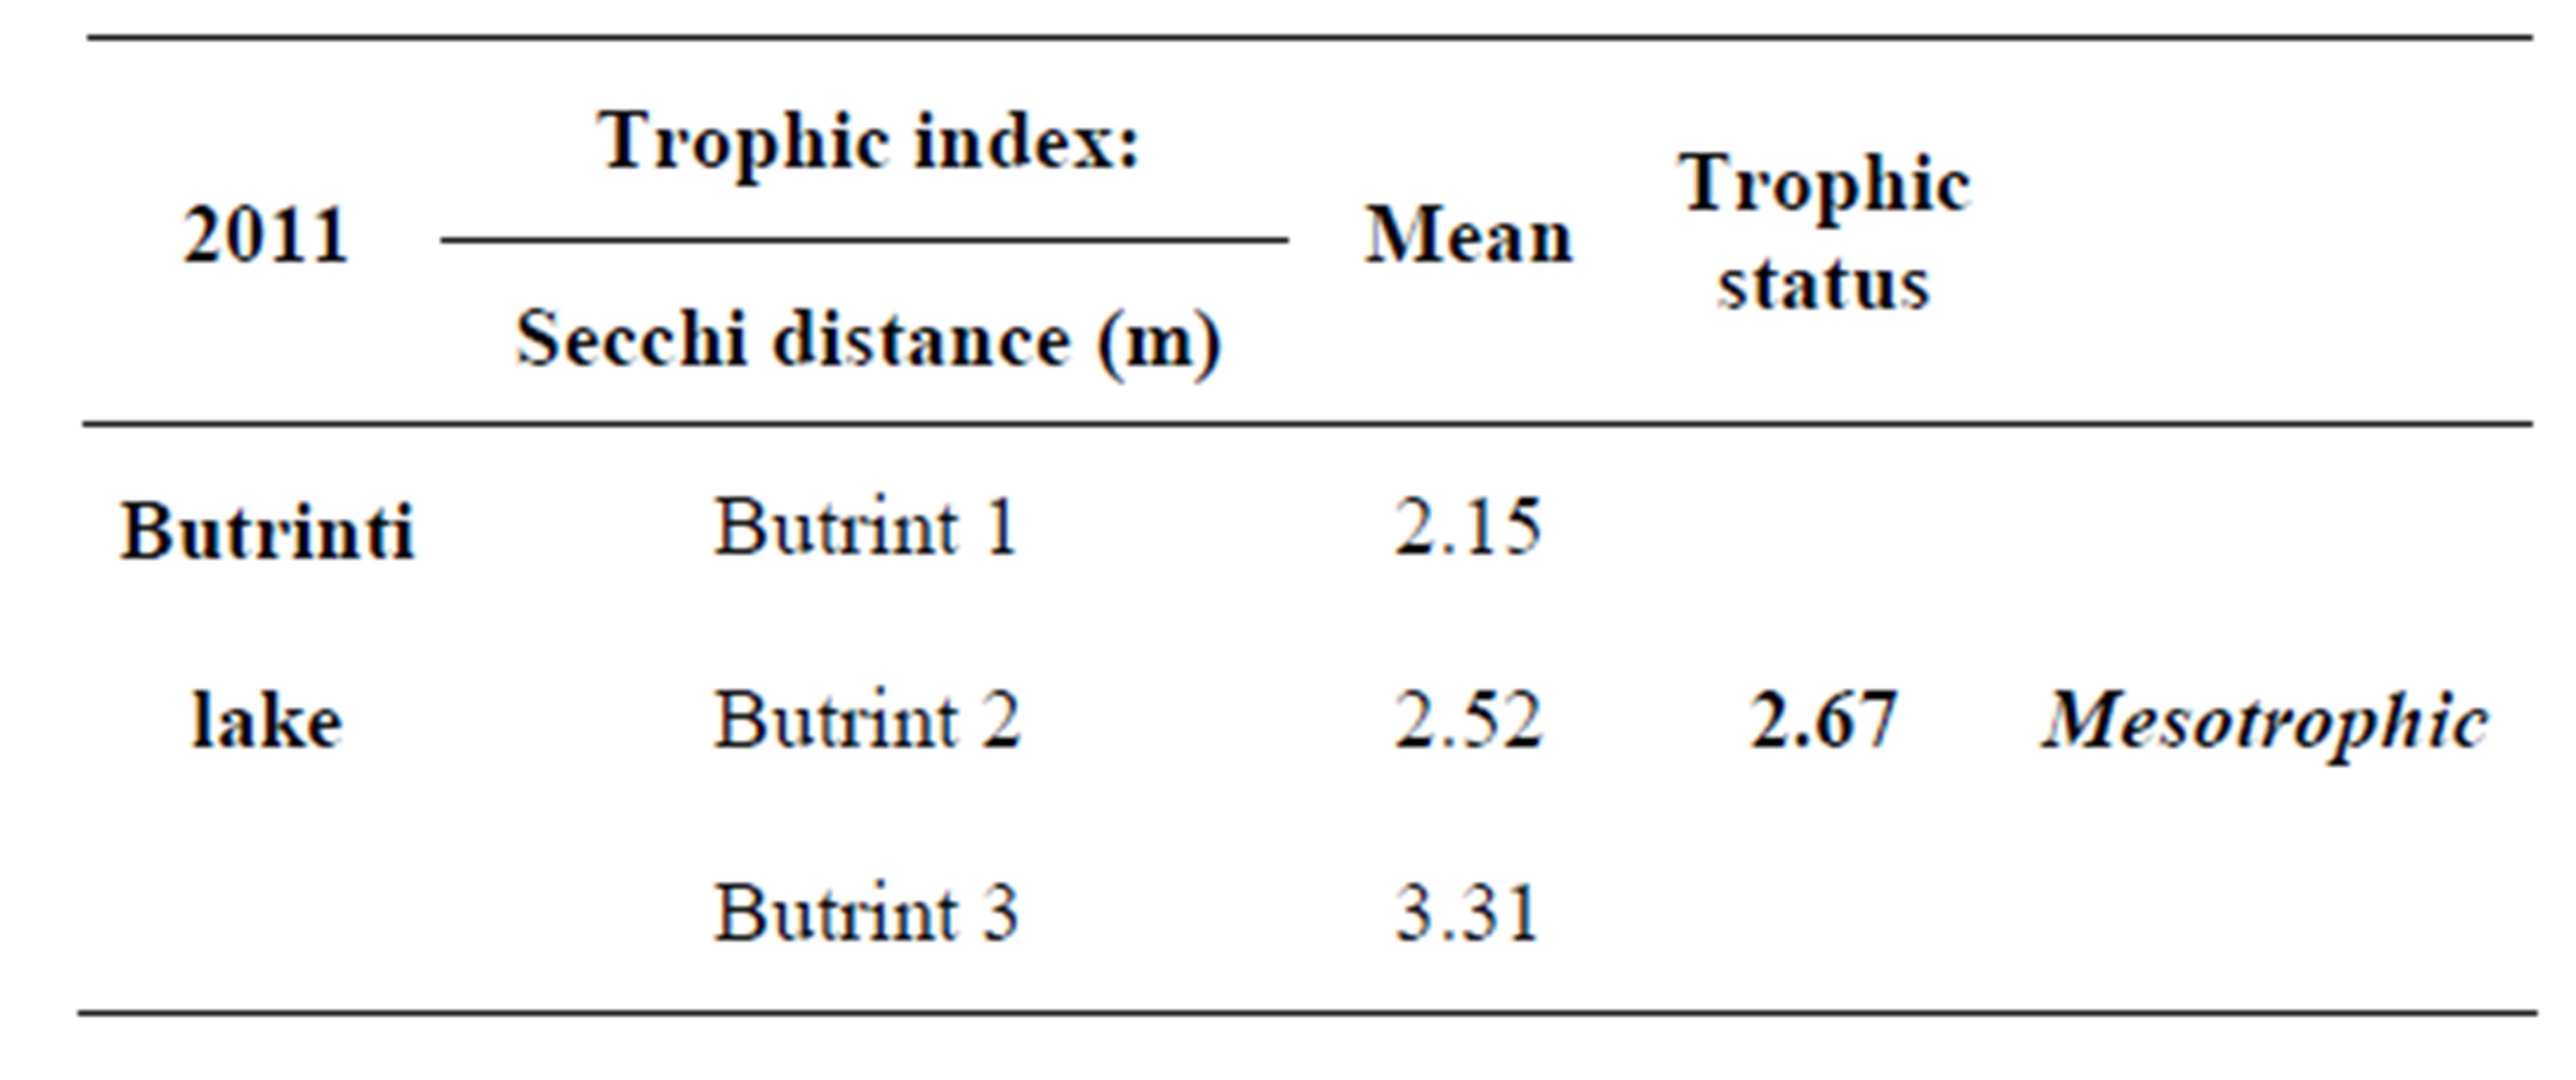
Table 1. Trophic status via Secchi depth of Butrinti Lake.
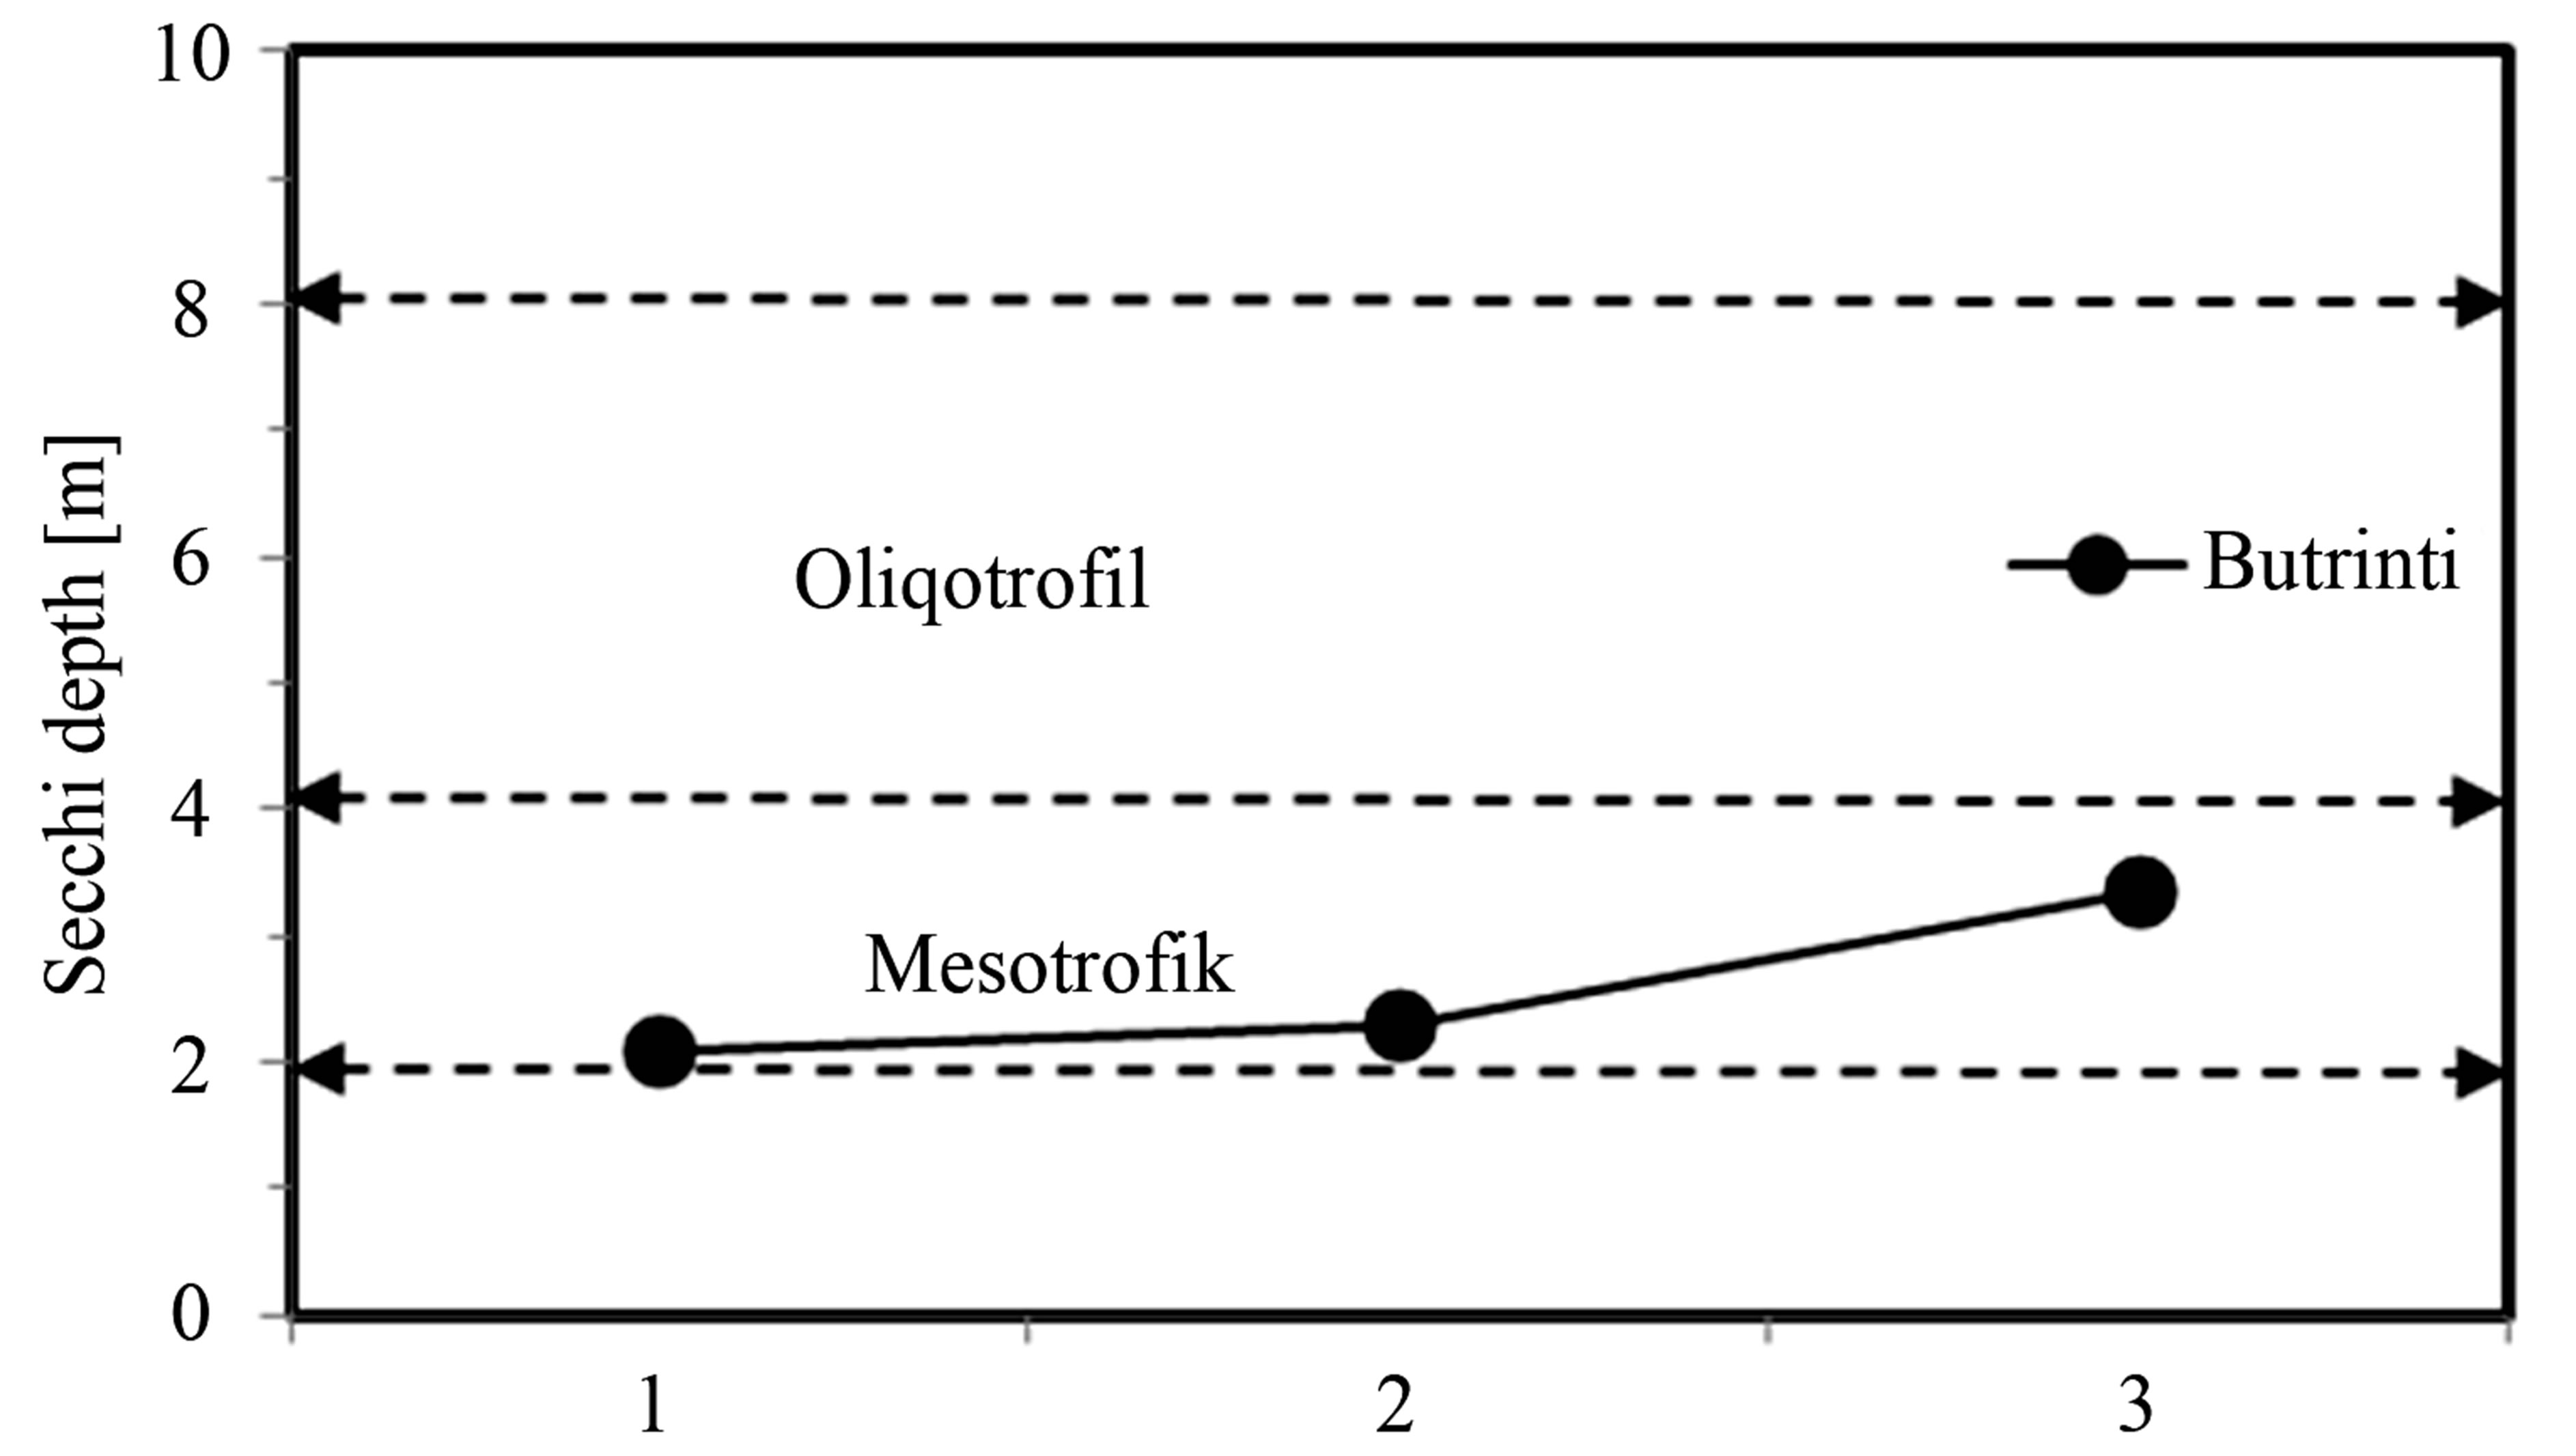
Figure 3. Mean values of Secchi depth during monitoring period and for each station.
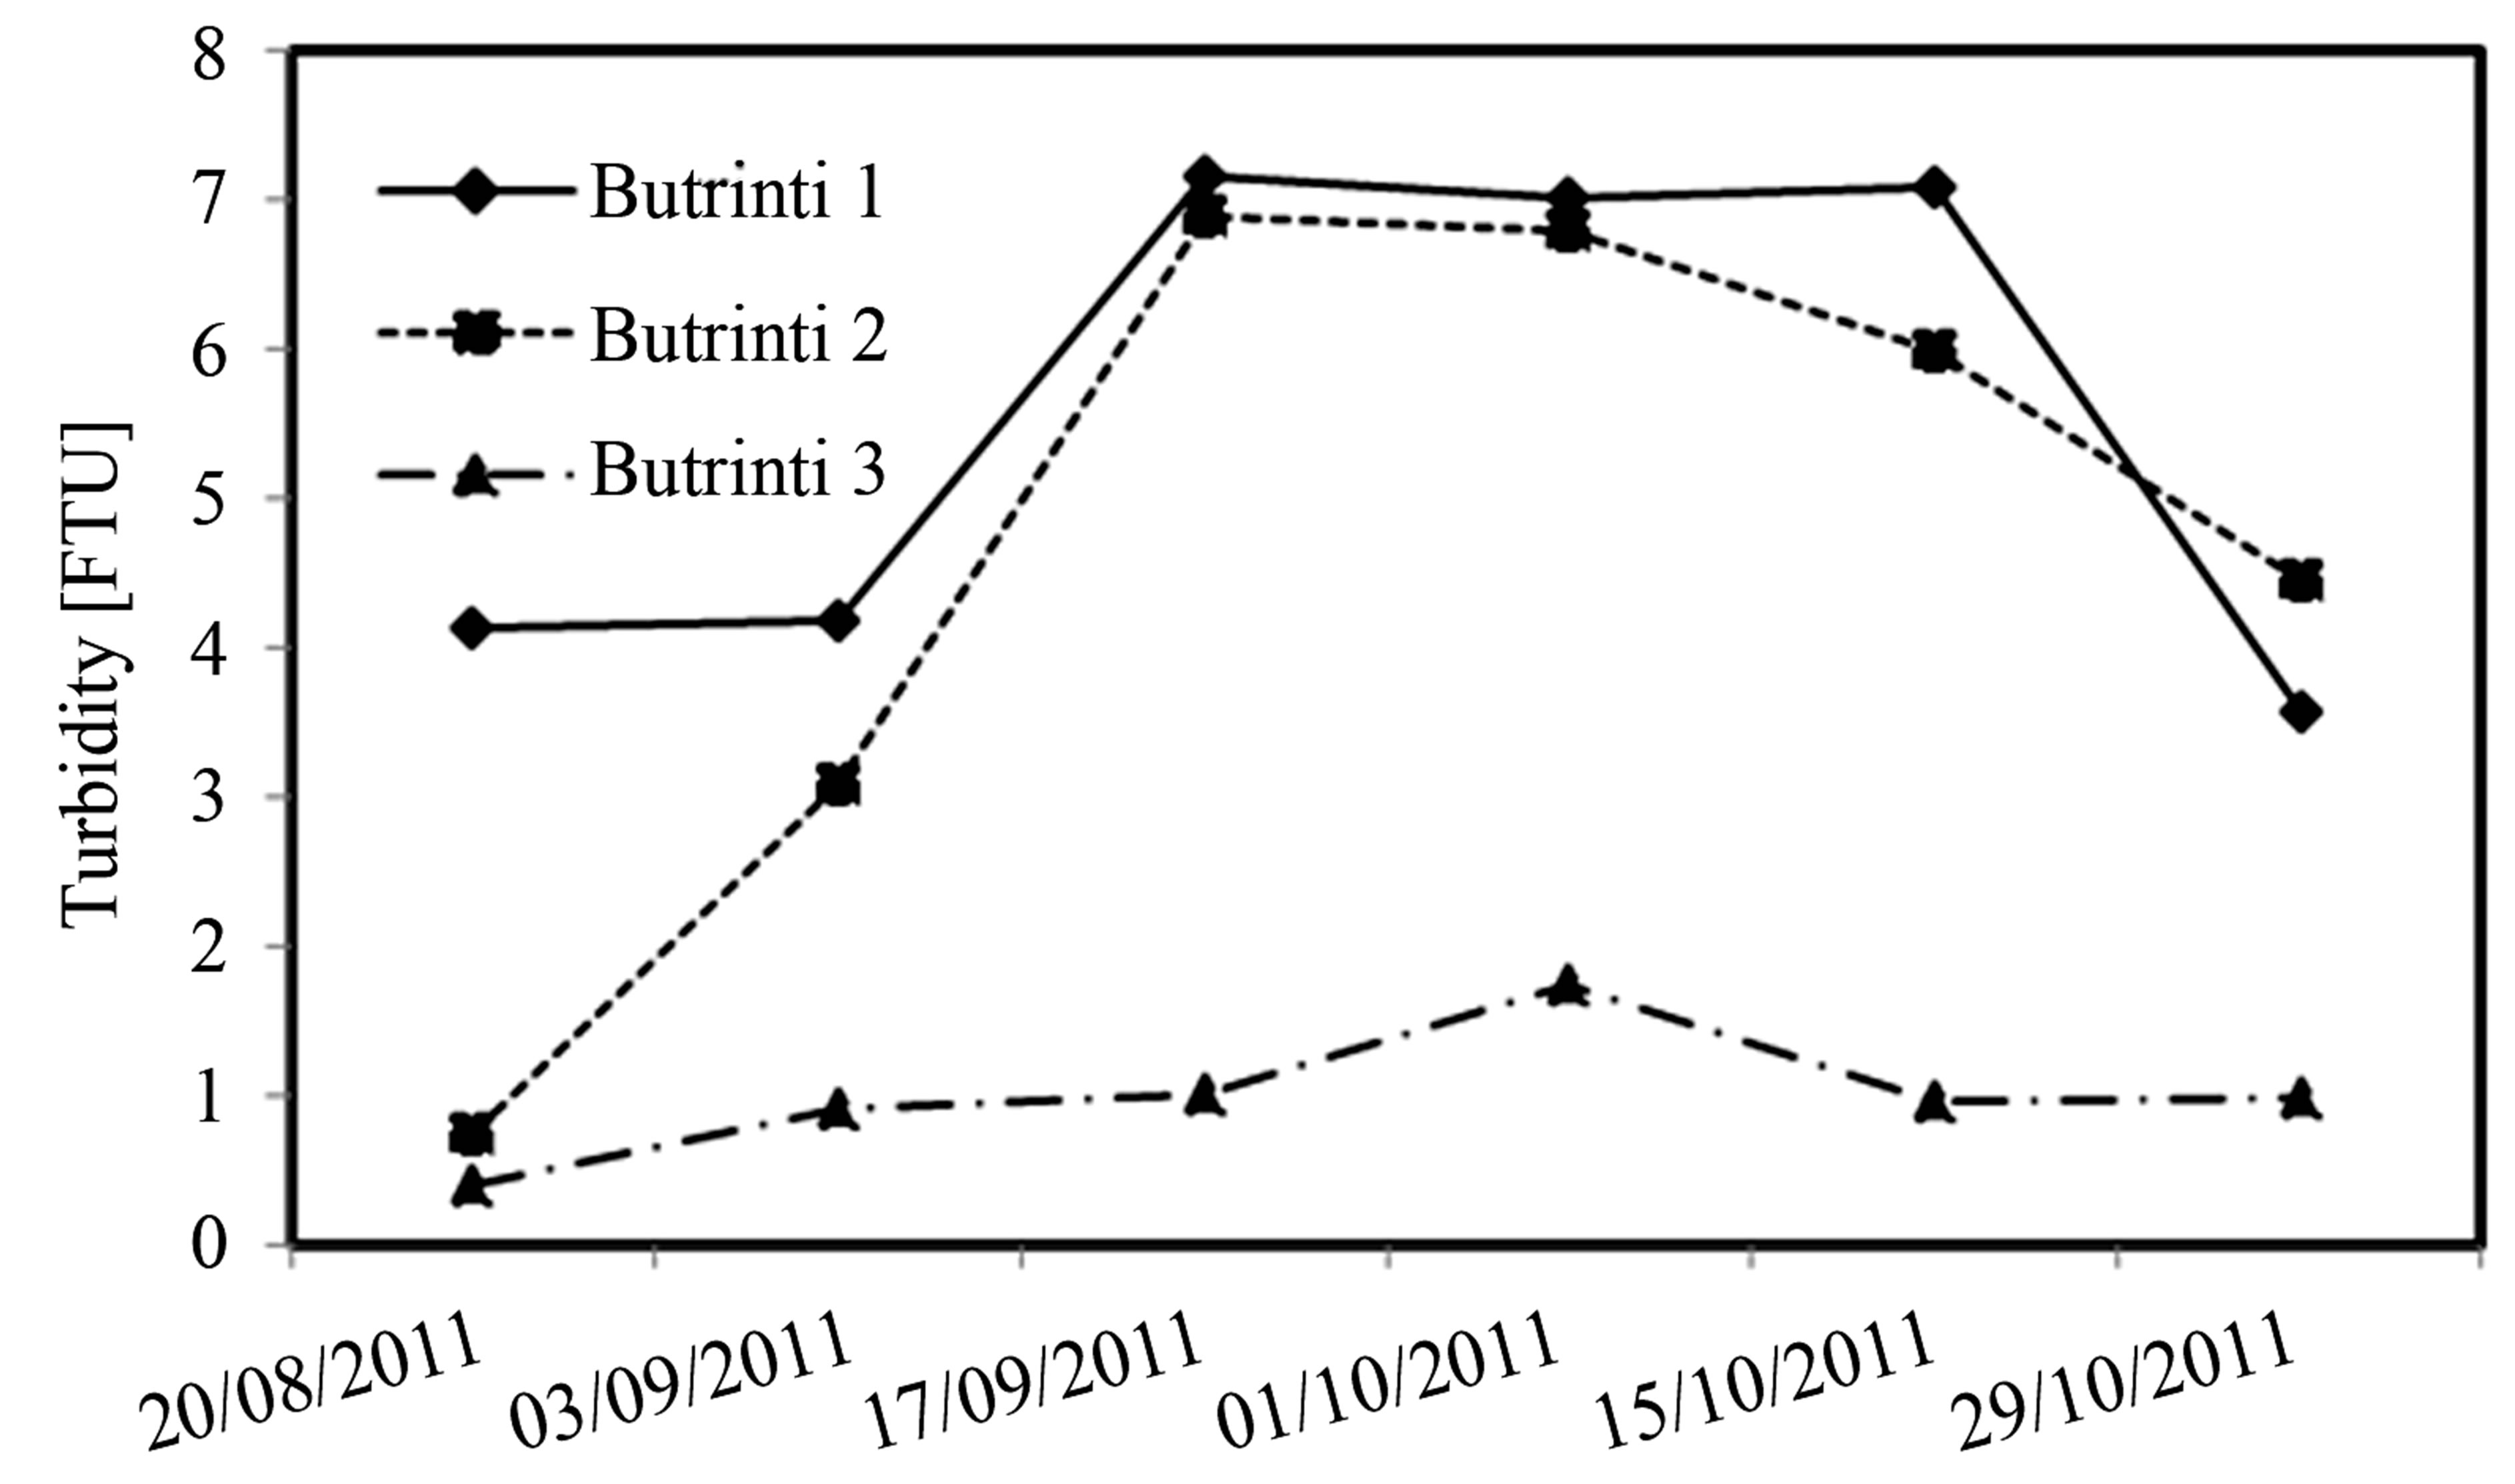
Figure 4. Variation of turbidity in Butrinti Lake during monitoring period.
as a better supply of freshwater from nearby Lake Bufi.
3.4. Relationship between Parameters, Secchi Depth and Turbidity
Transparency of water, expressed through the Secchi depth (distance) and water turbidity are two parameters that are closely related to each-other, and both are dependent on the concentration, type and size of particulates suspended in water.
This fact is confirmed by our statistical processing, taking into account the values of these parameters at all stations throughout the monitoring period. The relationship between these parameters, the viewing distance (Secchi disc) and turbidity are expressed by a power function of the inverse (y = a∙x−b) (Figure 5). Taking into consideration all the measurement data recorded for the
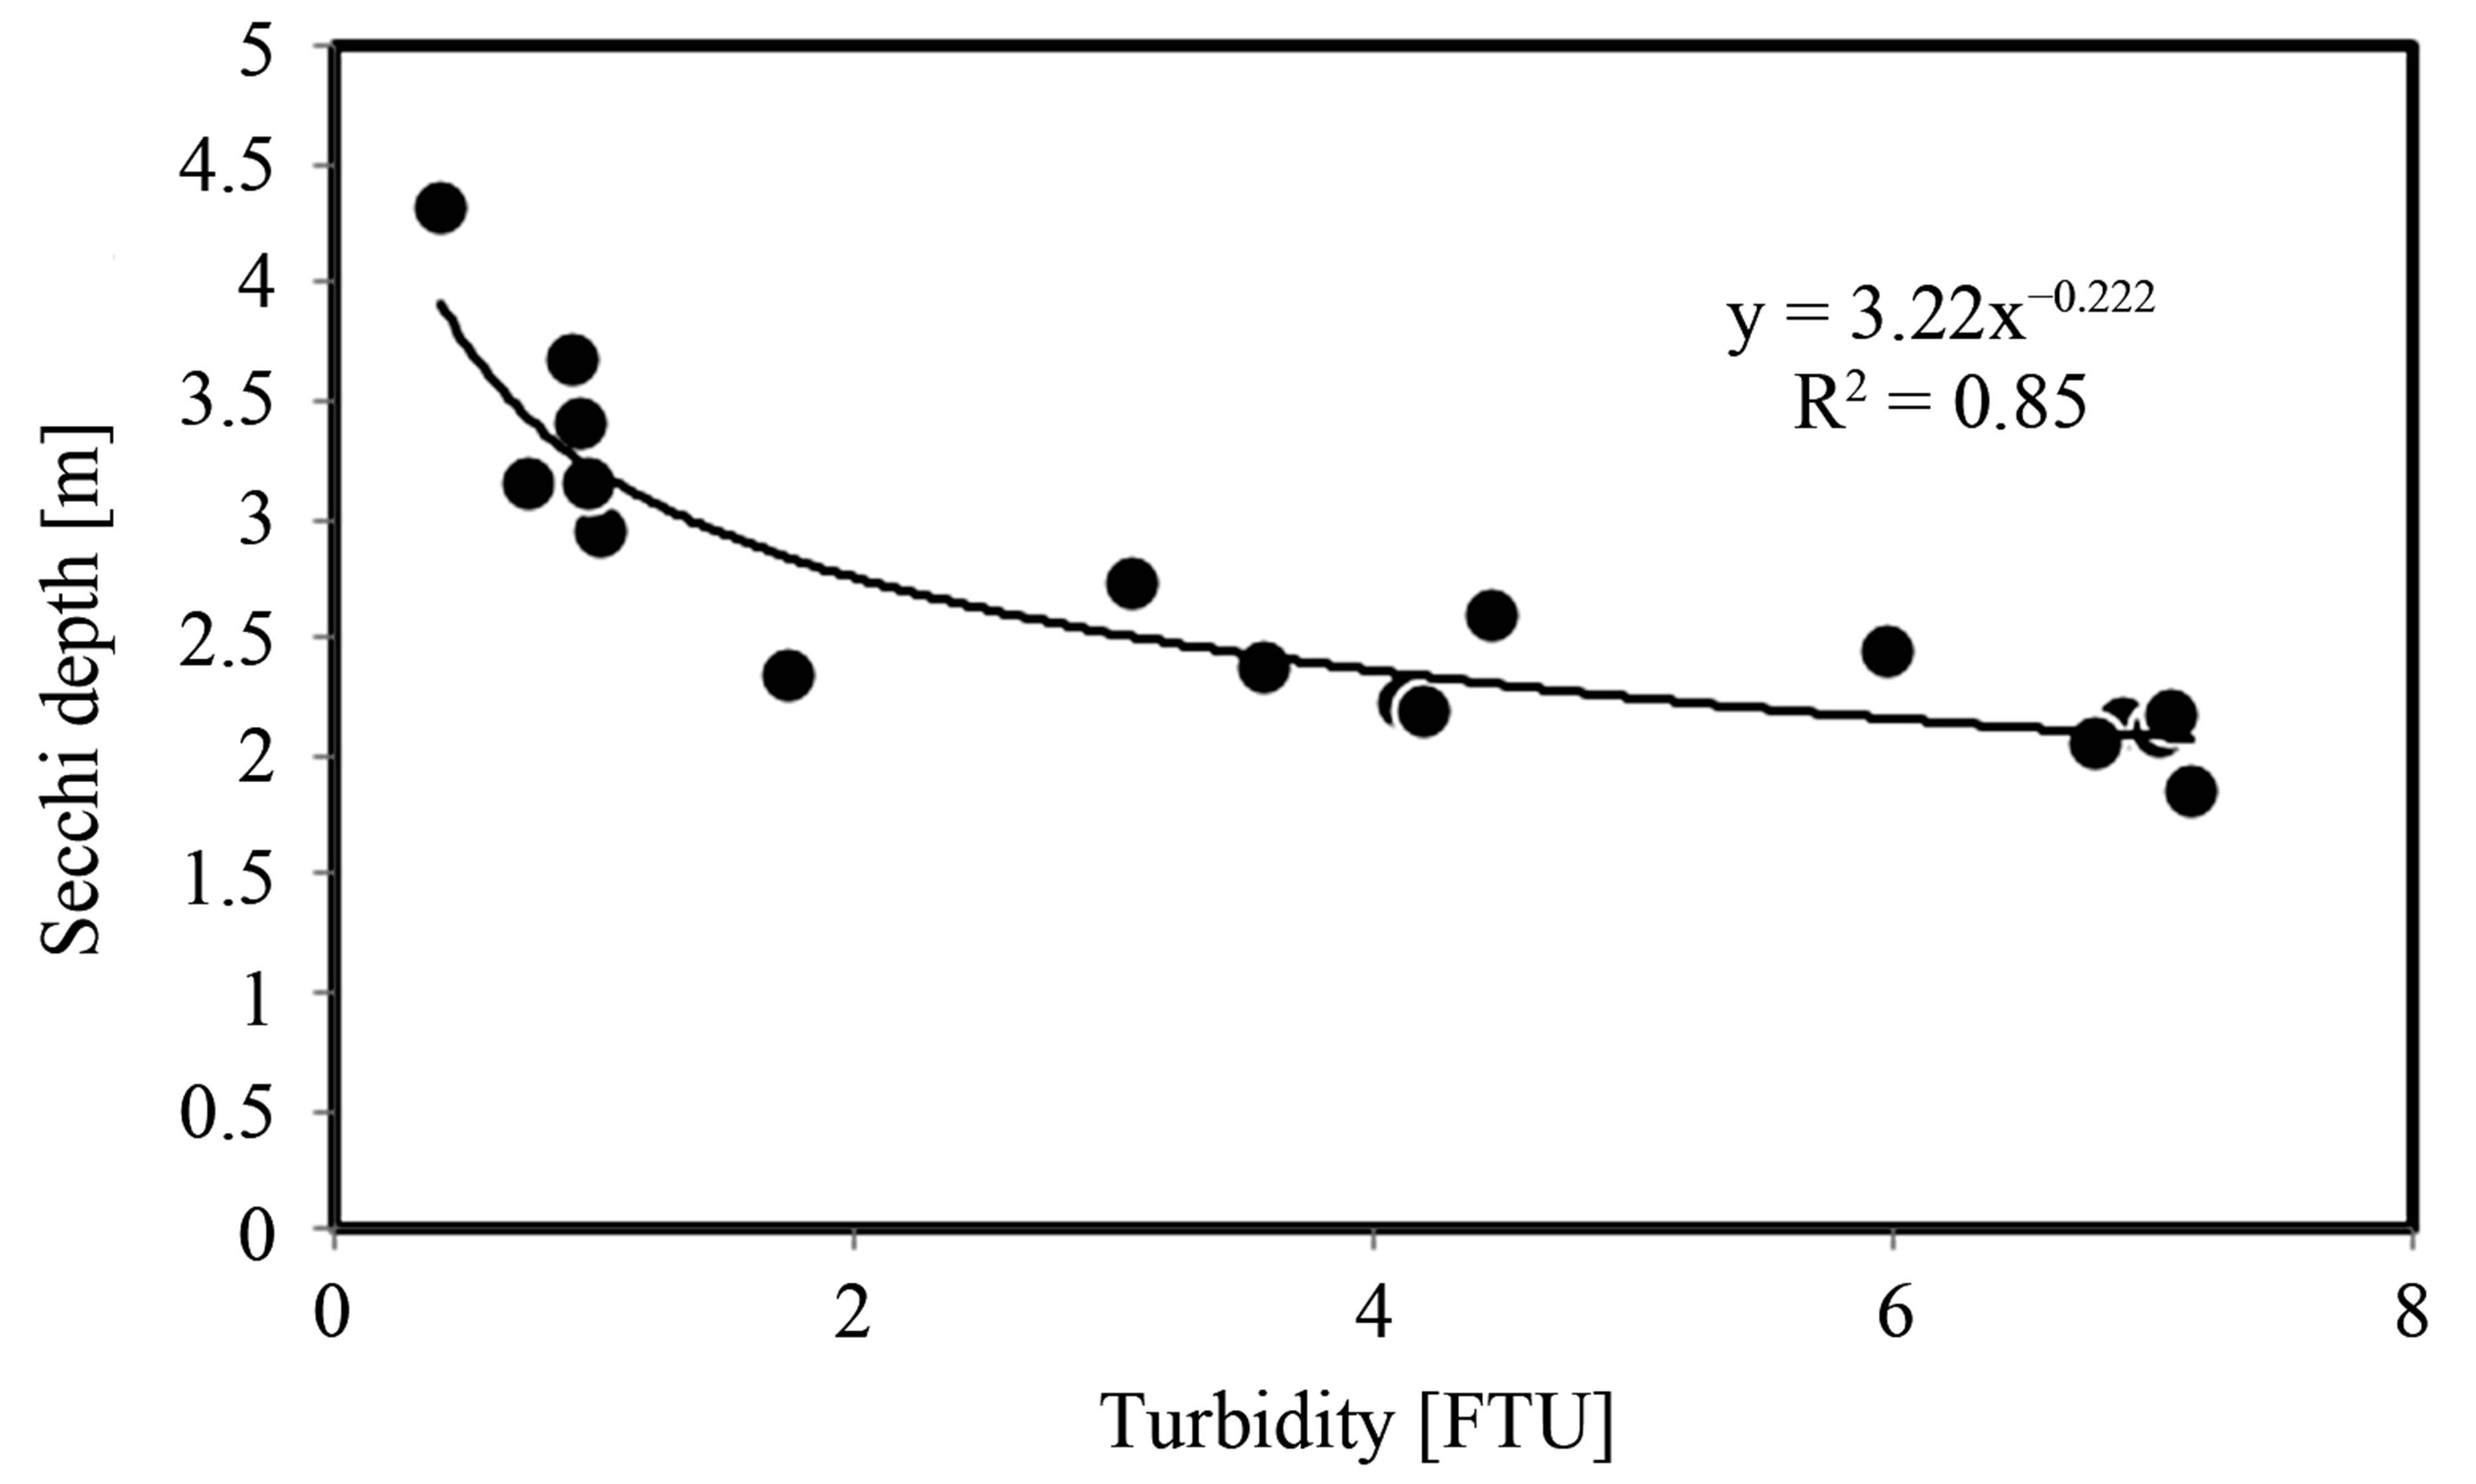
Figure 5. Relationship between turbidity and Secchi depth in Lake Butrinti (inverse power function).
Butrinti Lake, calculated values of power function parameters are: a = 3.22, b = 0.222 and a correlation coefficient of R2 = 0.85 (Figure 5).
4. Conclusions
1) Turbidity and transparency both show seasonal (time) variances during the monitoring period at each station. Each parameter shows variance by station (location) when measured at the same time.
2) High value of turbidity and low value of transparency were observed at Station 1 and the low value of turbidity and high value of transparency were observed at Station.
3) Differences were observed in both transparency and turbidity between three water stations which were selected at different points in Lake; it shows a spatial variance of parameters within the Lake.
4) A correlation exists between values of turbidity and transparency of water of this ecosystem which is expressed by an inverse power function as described by high correlation coefficient, with values R2 = 0.85.
5) Håkansson and Carlson classification on transparency by the way of Secchi depth acts as an indicator to monitor the development of algae with different levels of trophic status: Lake Butrint can be classified as mesotrophic, showing some variations from one station (location in the Lake) to another.
REFERENCES
- Turbidity Provisions EPA Guidance Manual, 1999, pp. 7/1-7/6.
- G. C. Holdren, “Turbidity and Other Surrogates Workshop Sediment,” 2002.
- D. Chapman and V. Kimstach, “Water Quality Assessments,” UNESCO/WHO/UNEP, 1996, pp. 79-82.
- W. A. Steel and S. Neuhauser, “RCSE TRS-No. 023,” 1999.
- R. W. Preisendorfer, “Limnol. Oceanography,” 1986, pp. 909-926. http://dx.doi.org/10.4319/lo.1986.31.5.0909
- J. R. Zaneveld and W. S. Pegau, “Opt. Express 11,” 2004, pp. 2997-3009. http://dx.doi.org/10.1364/OE.11.002997
- J. A. M. G. Hambrook Berkman and U. S. G. S. Canova, “Techniques of Water-Resources Investigations,” Book 9, Chap. A7, Section 7.4, 2007, pp. 17-20.
- L. Håkansson and A. C. Bryhn, “Eutrophication in the Baltic Sea,” 2008, p. 7.
- L. Håkansson and A. C. Bryhn, “Tools and Criteria for Sustainable Coastal,” 2008, pp. 19-22. http://dx.doi.org/10.1007/978-3-540-78363-3_5
- R. E. Carlson, “Limnology and Oceanography,” 1977, pp. 361-369. http://dx.doi.org/10.4319/lo.1977.22.2.0361
- R. E. Carlson and J. Simpson, “A Coordinator’s Guide to Volunteer Lake Monitoring Methods,” 1996, 96 p.
- HI93703-11 Instruction Manual. Portable Logging Turbidity Meter with RS232.
- OECD, “Eutrophication of Waters: Monitoring, Assessment and Control of Economic Cooperation and Development,” 1982, p. 154.
- V. Çako, “Methodologies for Conservation and Management of Water Ecosystems in Vlora Region,” 2012.
- F. Babani, “Ecologia, the GESTIONE Conservazione Ecosistemi Degli Know Transizione of Costieri,” INTERREG IIIA-AMJOWELS, 2007.
- F. Babani, E. Kongjika, A. Mullaj and A. Star, “Rivers and Citizens: Cross-Border Experience in Environmental Protection and Sustainable Development,” 2007, pp. 27-36.