Journal of Water Resource and Protection
Vol.5 No.8(2013), Article ID:35831,17 pages DOI:10.4236/jwarp.2013.58079
Application of a Groundwater Classification System and GIS Mapping System for the Lower Ruby Valley Watershed, Southwest Montana
1KirK Engineering & Natural Resources, Inc., Sheridan, USA
2Department of Geosciences, University of Montana, Missoula, USA
Email: *scott_payne@kirkenr.com
Copyright © 2013 Scott M. Payne et al. This is an open access article distributed under the Creative Commons Attribution License, which permits unrestricted use, distribution, and reproduction in any medium, provided the original work is properly cited.
Received May 19, 2013; revised June 25, 2013; accepted July 29, 2013
Keywords: Aquifers; hydrogeology; watershed; groundwater management; geographical information systems; rivers/streams; surface water/groundwater connection; land use
ABSTRACT
Classification of groundwater conditions at the watershed scale synthesizes landscape hydrology, provides a mapped summary of groundwater resources, and supports water management decisions. The application of a recently developed watershed-scale groundwater classification methodology is applied and evaluated in the 100,000 hectare lower Ruby Valley watershed of southwestern Montana. The geologic setting, groundwater flow direction, aquifer productivity, water quality, anthropogenic impact to water levels, depth to groundwater, and the degree of connection between groundwater and surface water are key components of the classification scheme. This work describes the hydrogeology of the lower Ruby Valley watershed and illustrates how the classification system is applied to assemble, analyze, and summarize groundwater data. The classification process provides information in summary tables and maps of seamless digital overlays prepared using geographical information system (GIS) software. Groundwater conditions in the watershed are classified as low production bedrock aquifers in the mountainous uplands that recharge the moderate productivity basin-fill sediments. Groundwater levels approach the surface near the Ruby River resulting in sufficient groundwater discharge to maintain stream flow during dry, late summer conditions. The resulting classification data sets provide watershed managers with a standardized organizational tool that represents groundwater conditions at the watershed scale.
1. Introduction
Evaluating how to distribute limited water resources as the demand to support domestic, municipal, energy, and agricultural uses increases requires the development of databases and watershed scale management tools [1-10]. Often basin scale water management emphasizes surface water resources as numerous characterization and classification schemes are readily available to classify these systems [11,12]. It is recognized that a groundwater classification tool that can produce practical summaries of basin scale groundwater systems is needed [6,13]. A classification tool that captures key datasets and improves technical communication between citizens, scientists, and land use planners is illustrated in this work [14, 15].
The classification methodology is applied to an intermontane watershed and groundwater system in southwestern Montana. The methodology maps the geological framework, aquifer productivity, groundwater quality, depth to groundwater, and the relative degree of groundwater/surface water exchange (Figure 1, Tables 1 and 2). Application of the classification process provides a graphical and descriptive summary of groundwater conditions in the lower Ruby Valley watershed (Figure 2) using classification criteria developed by Payne and Woessner [14,15]. The methodology applies standardized nomenclature and mapping techniques that supplement but do not replace the text, figures, maps, and tables commonly included in standard hydrogeological reports [16-19]. While site specific hydrogeological reports are published in a wide range of formats, this classification method promotes standardization of watershed scale
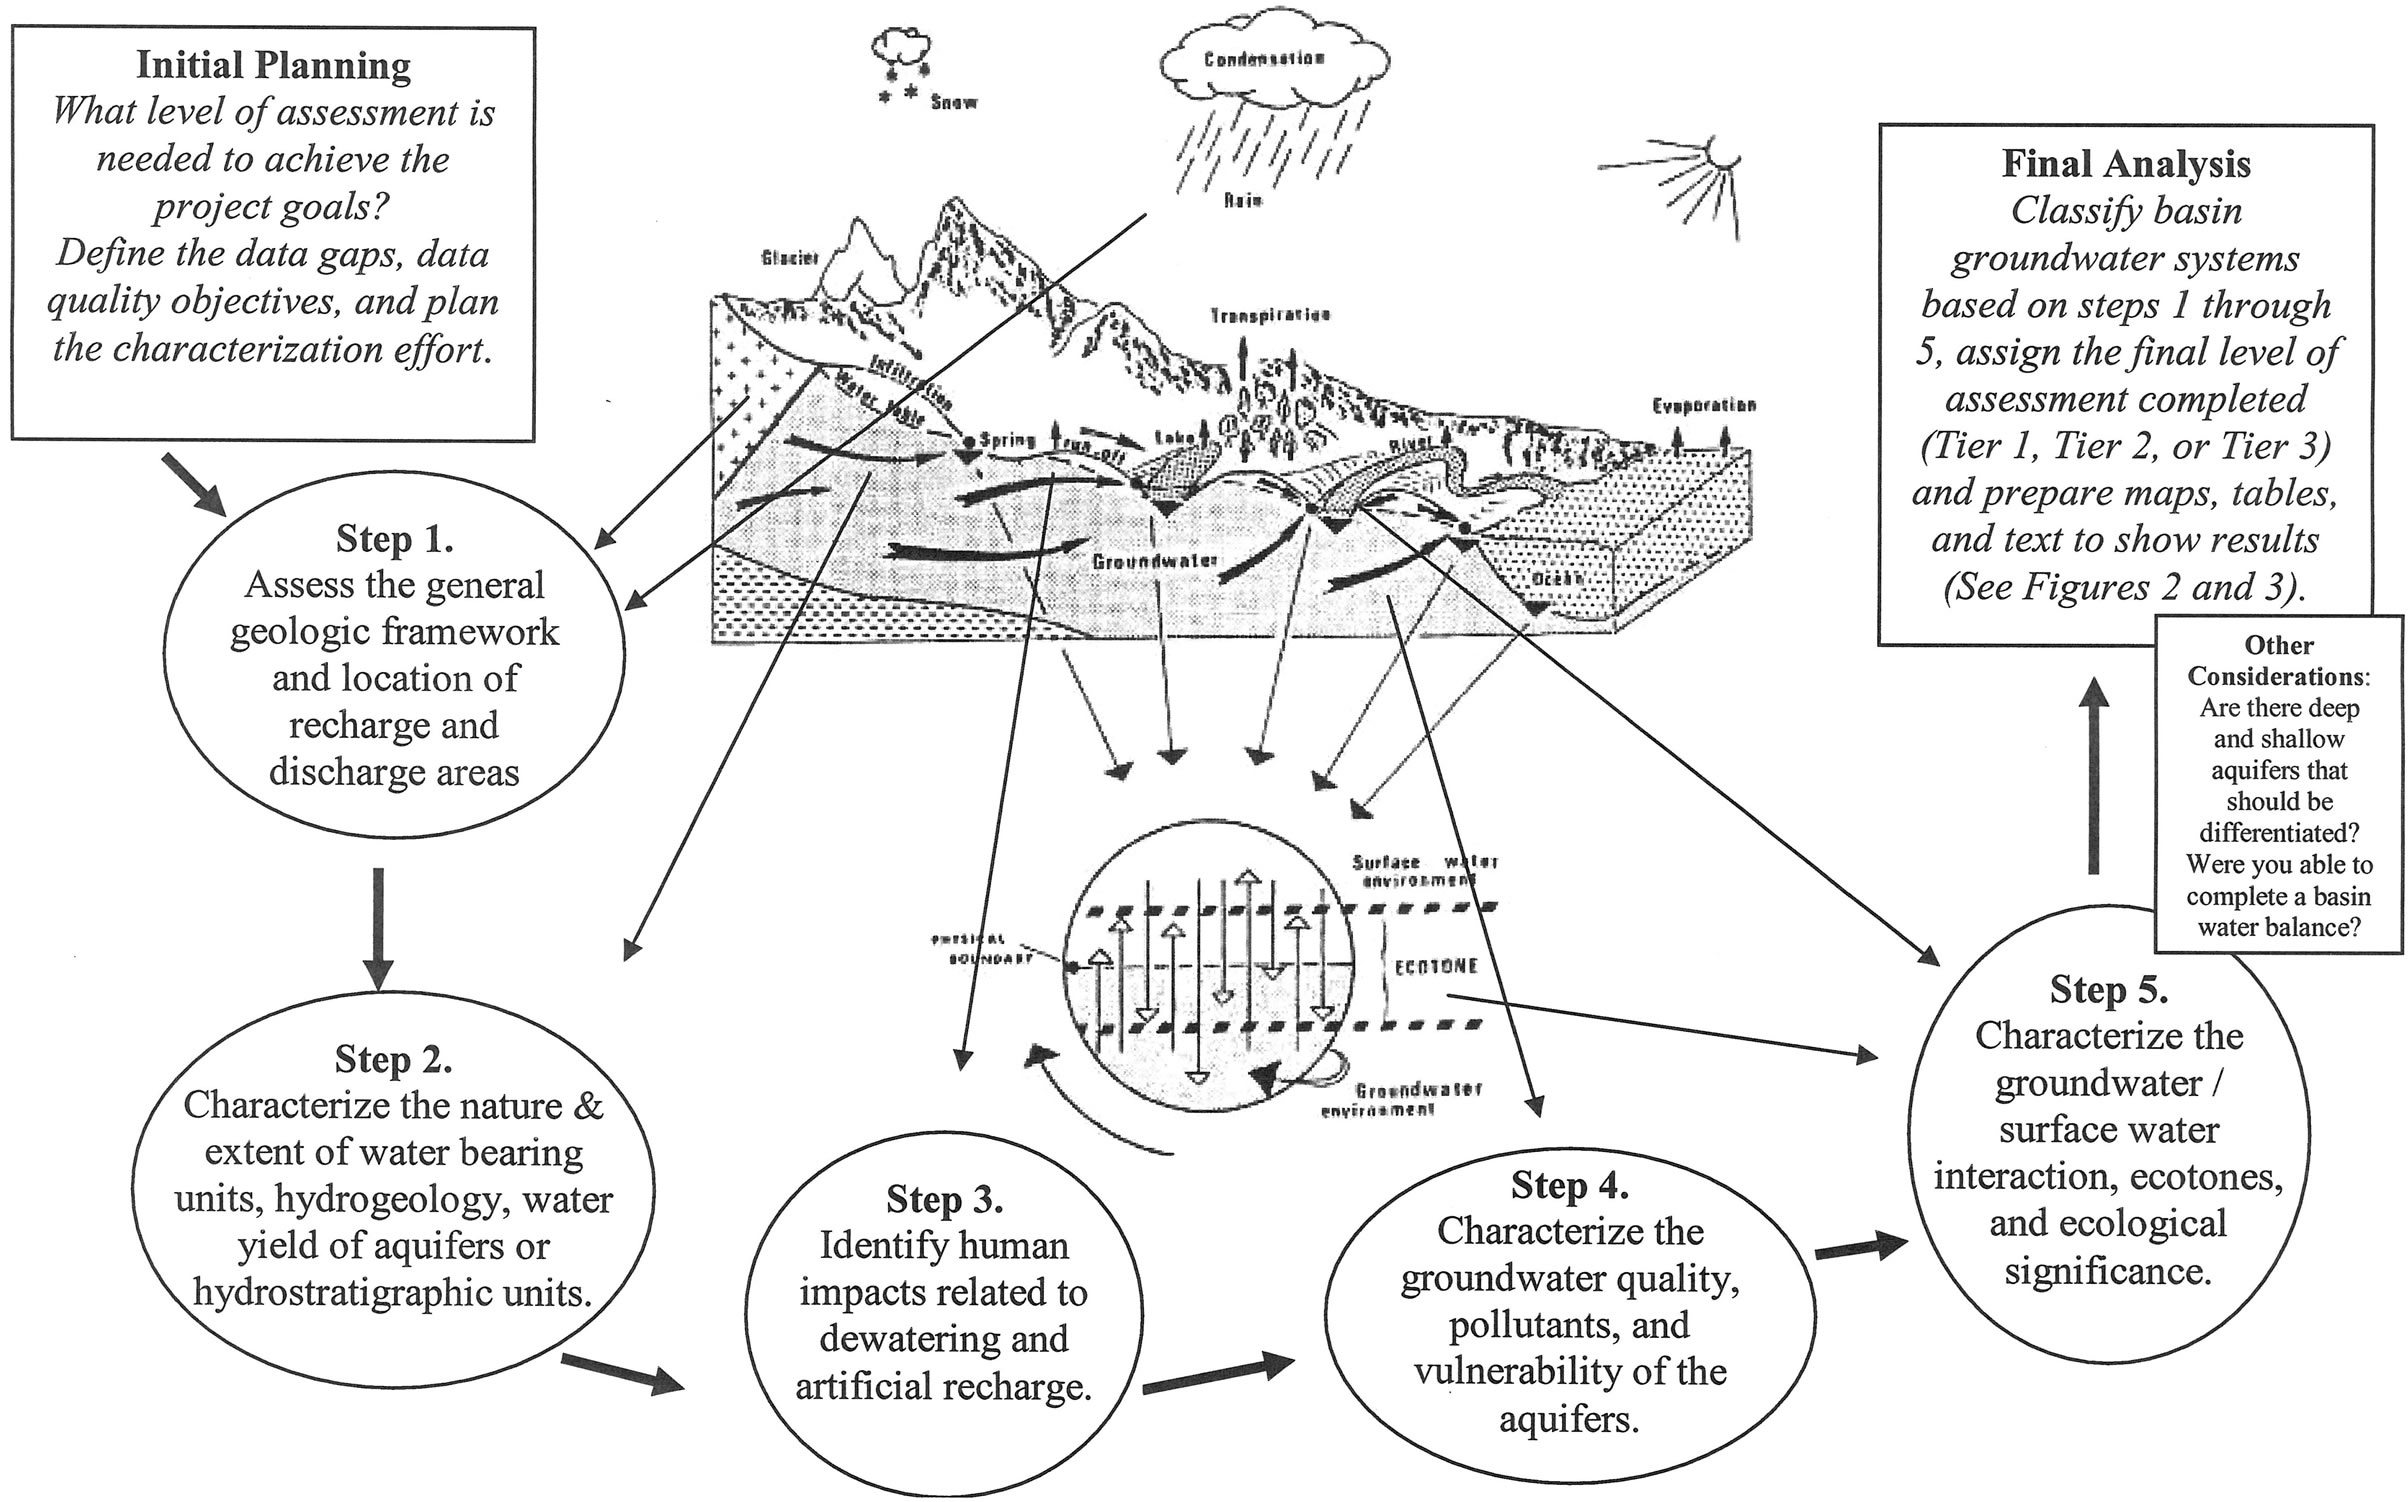
Figure 1. The basic components and steps proposed to classify basin groundwater systems and a diagrammatic explanation of groundwater/surface water ecotones in the mountain and plains landscapes (adapted from Gibert [20]).
information and is intended to provide interested citizens, natural resource planners and managers, and groundwater professionals access to simplified, standardized, and clearly presented summaries of groundwater information. Its application results in geographic information system (GIS) layers that can be viewed and analyzed with other overlays. This paper summarizes the hydrogeology of the lower Ruby watershed, presents an overview of the Payne and Woessner (2010) aquifer classification system, and presents results of application of the classification methodology to the lower Ruby Valley.
2. Study Area
The lower Ruby Valley Watershed of southwestern Montana is approximately 100,000 hectares (Figure 2). The regional geologic setting is the northeastern edge of the basin and range geologic province [21]. The basin fill sediments are composed of fluvial deposits of the Ruby River, and mountain derived alluvial fan and debris flow sediments including some deposits of volcanic origin [22]. The combined thickness of deposits is reported to range from 500 to 600 m [16]. The vertical relief of bedrock in the Tobacco Root, Greenhorn, and Ruby Mountains is typically over 1500 m higher than the valley floor and bound the north, east, and south sides of the valley, respectively. Climate in the valley bottom is semi-arid and mean annual precipitation is 25 - 30 cm; uplands and mountainous areas receive up to 130 cm per year [23]. The valley has a mean annual temperature of 6.5˚C [24].
Land use is dominated by agriculture that includes the production of cattle, grass hay, alfalfa, and some isolated grain crops. The majority of agriculture production relies on seasonal irrigation with water derived from snow melt dominated mountain tributaries, the main stem of the Ruby River (mean annual flow 5 m3/second at USGS station number 06019500, 1938-2008), and stored water from the upstream Ruby Reservoir.
The groundwater system includes bedrock, sediments associated with alluvial fans and Tertiary benches, and fluvial deposits [16,22]. The surrounding bedrock forms a low yield aquifer system and serves as an up gradient recharge source for the basin fill sediments [25]. However, irrigation water loss provides the majority of recharge to the tertiary and alluvial groundwater system [26]. Groundwater is withdrawn from valley aquifers and is the sole source of domestic and municipal water supplies.
The Ruby Valley Conservation District (RVCD) and the Ruby Watershed Council (RWC) recognized the importance of characterizing and understanding groundwater-surface water relationships, and developed a long term watershed scale water management plan that main
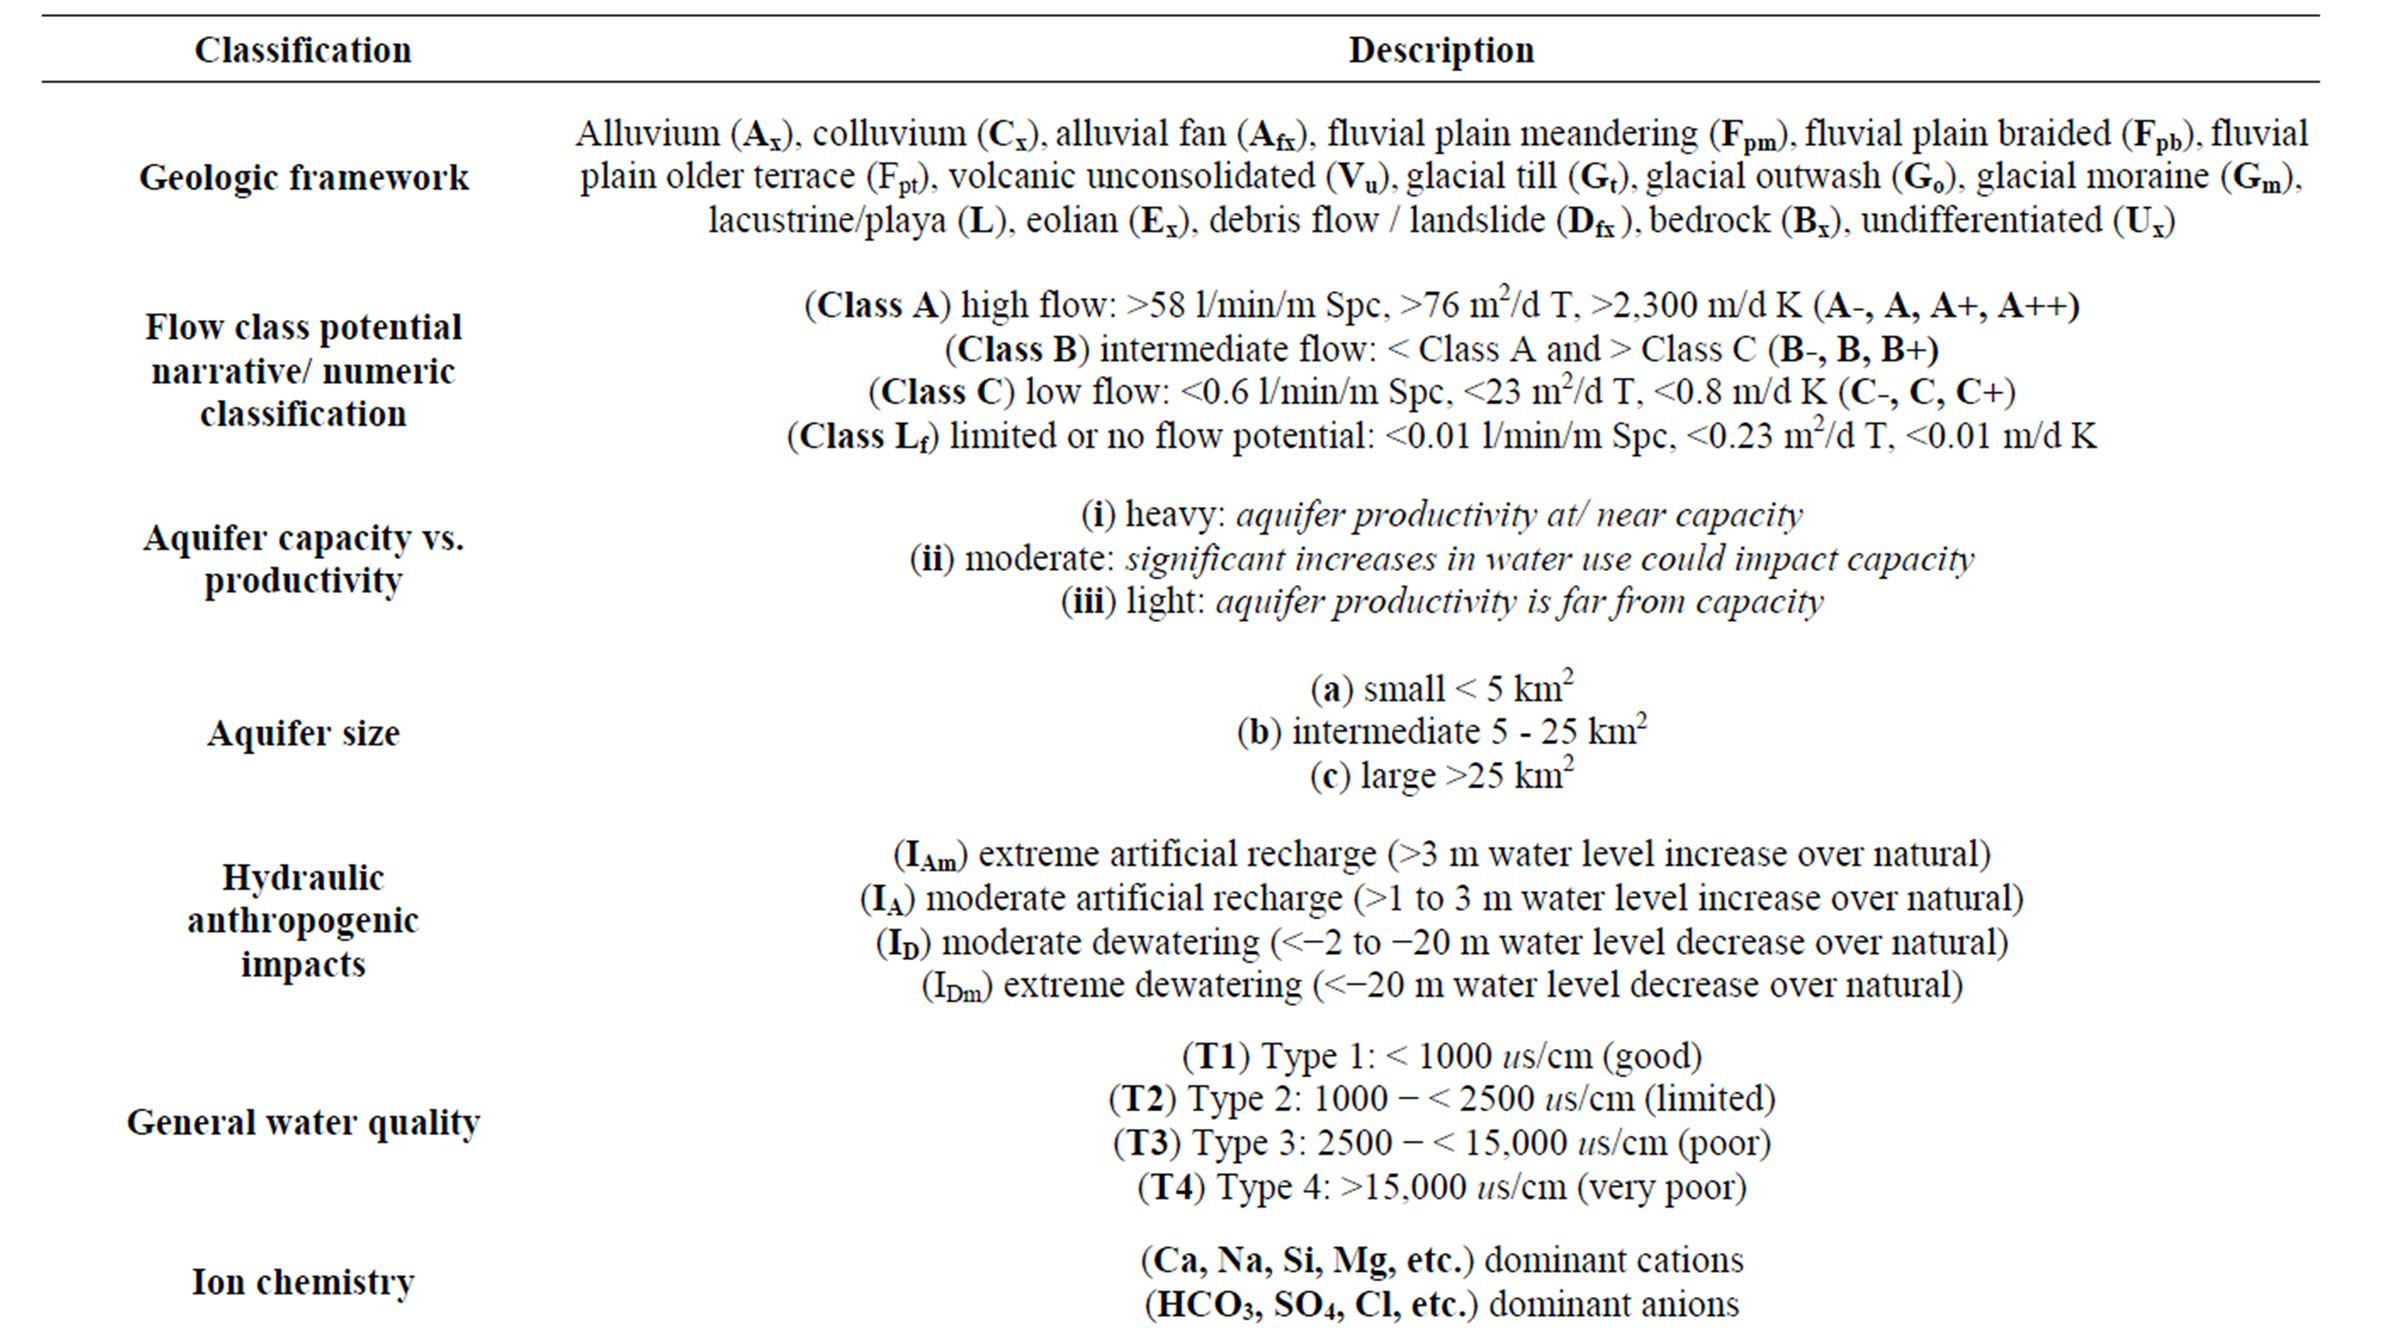
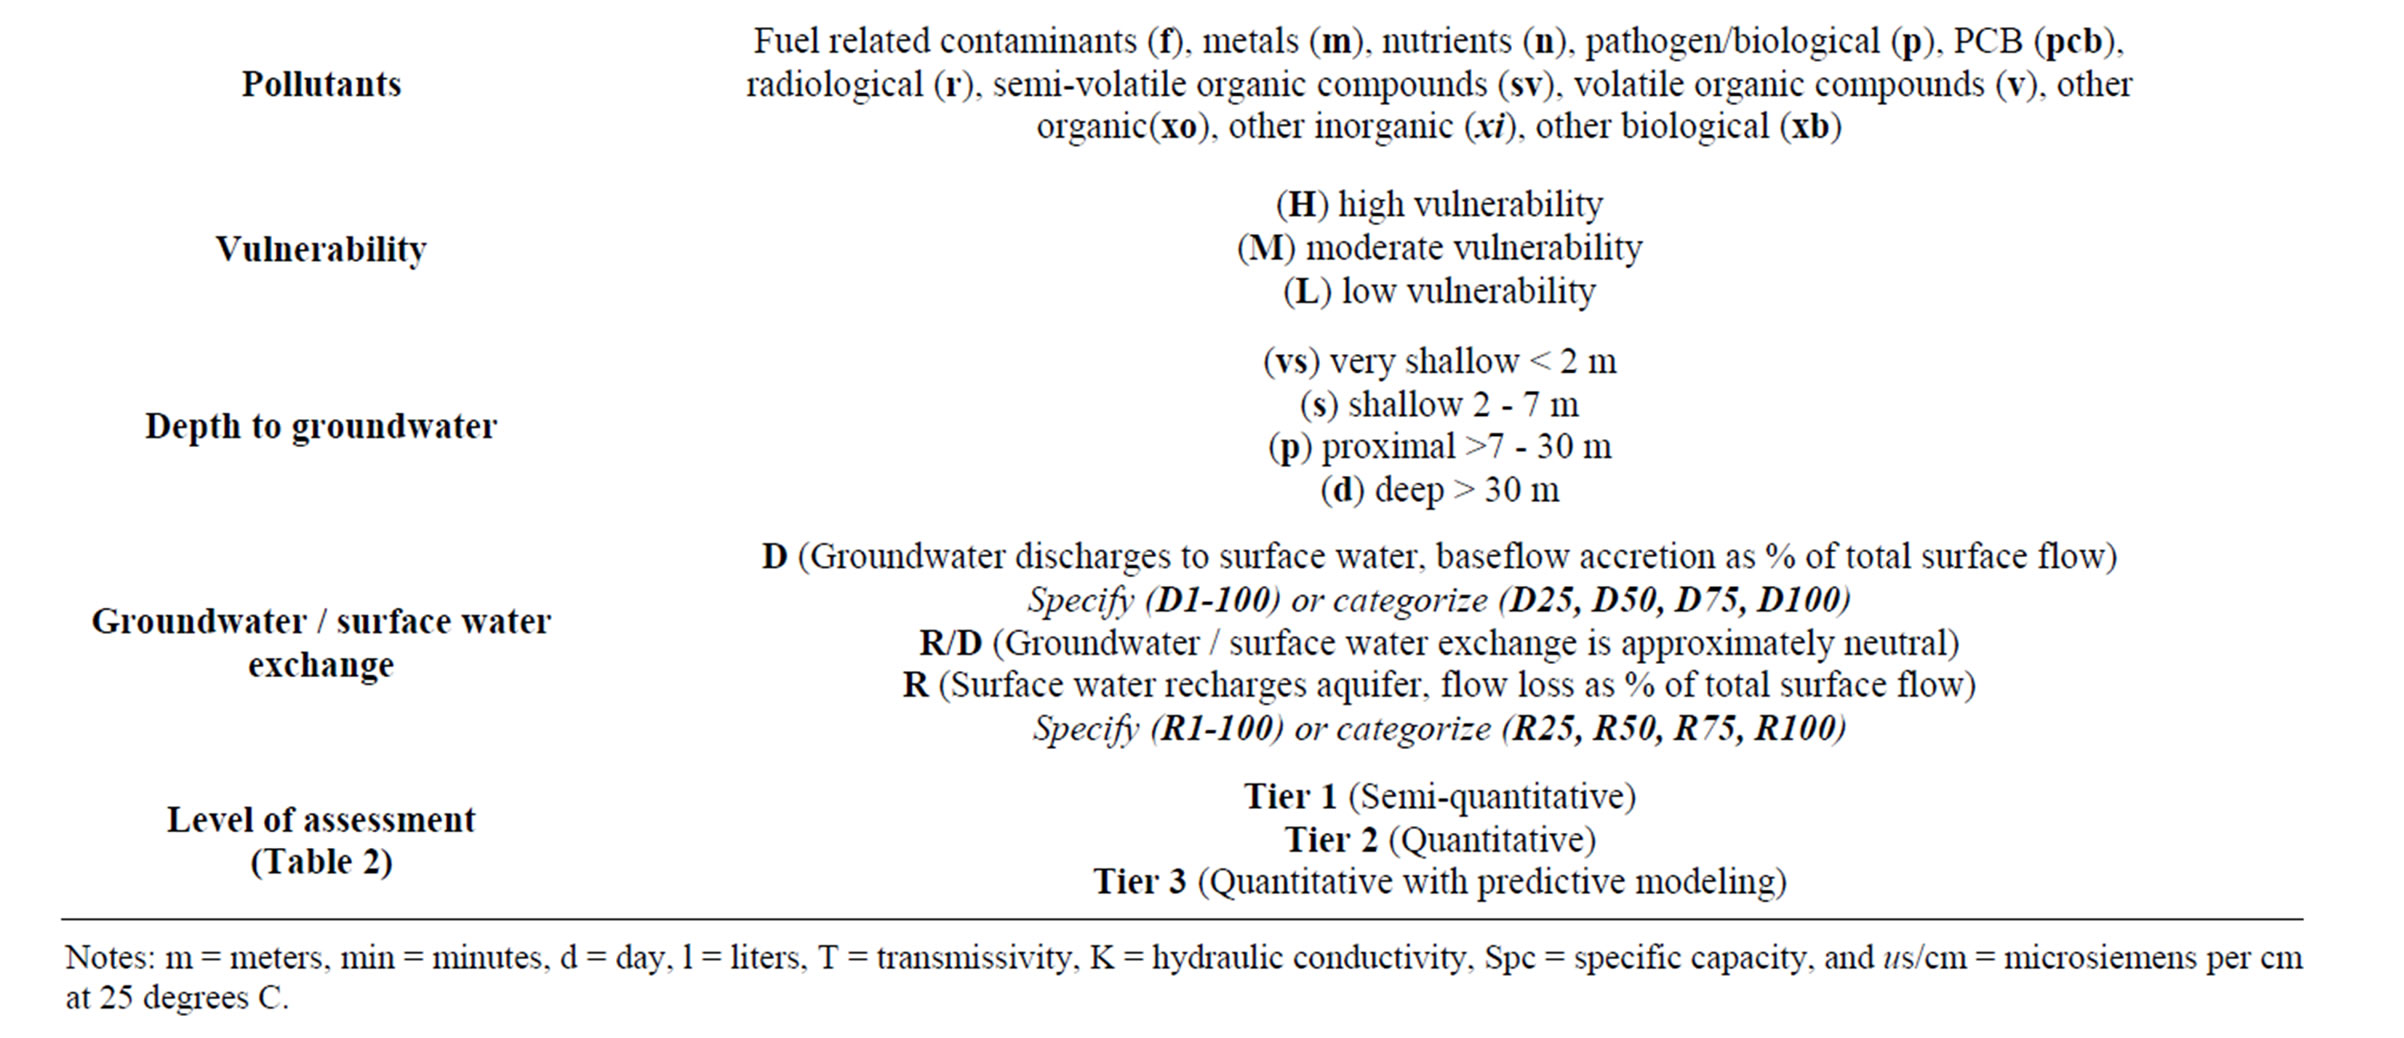
Table 1. Summary of aquifer classification codes and descriptions. Numeric classes, special conditions, and narrative descriptions are describedin Payne [14] and available at http://www.kirkenr.com/index_files/ProjectLinks.html.
tains water supply for current agriculture and land use, and protects and maintains the current quality and quantity of the groundwater and surface water resources. In 2004, the Lower Ruby Valley Groundwater Management Plan (LRVGMP) was prepared that included an initial attempt at classifying surface water and groundwater resources at the watershed scale [16]. That work concluded that the timing and quantity of groundwater supporting Ruby River flows required further analyses and refinement.
In 2005, the Ruby Groundwater/Surface Water Interaction Modeling Project was initiated. Modeling primarily relied upon the previous water resource data collected under the LRVGMP [26]. Field data and modeling analyses were used to refine the basin water balance and identify key processes driving exchange of groundwater with surface water. Model predictions were used to evaluate potential future scenarios in which residential development
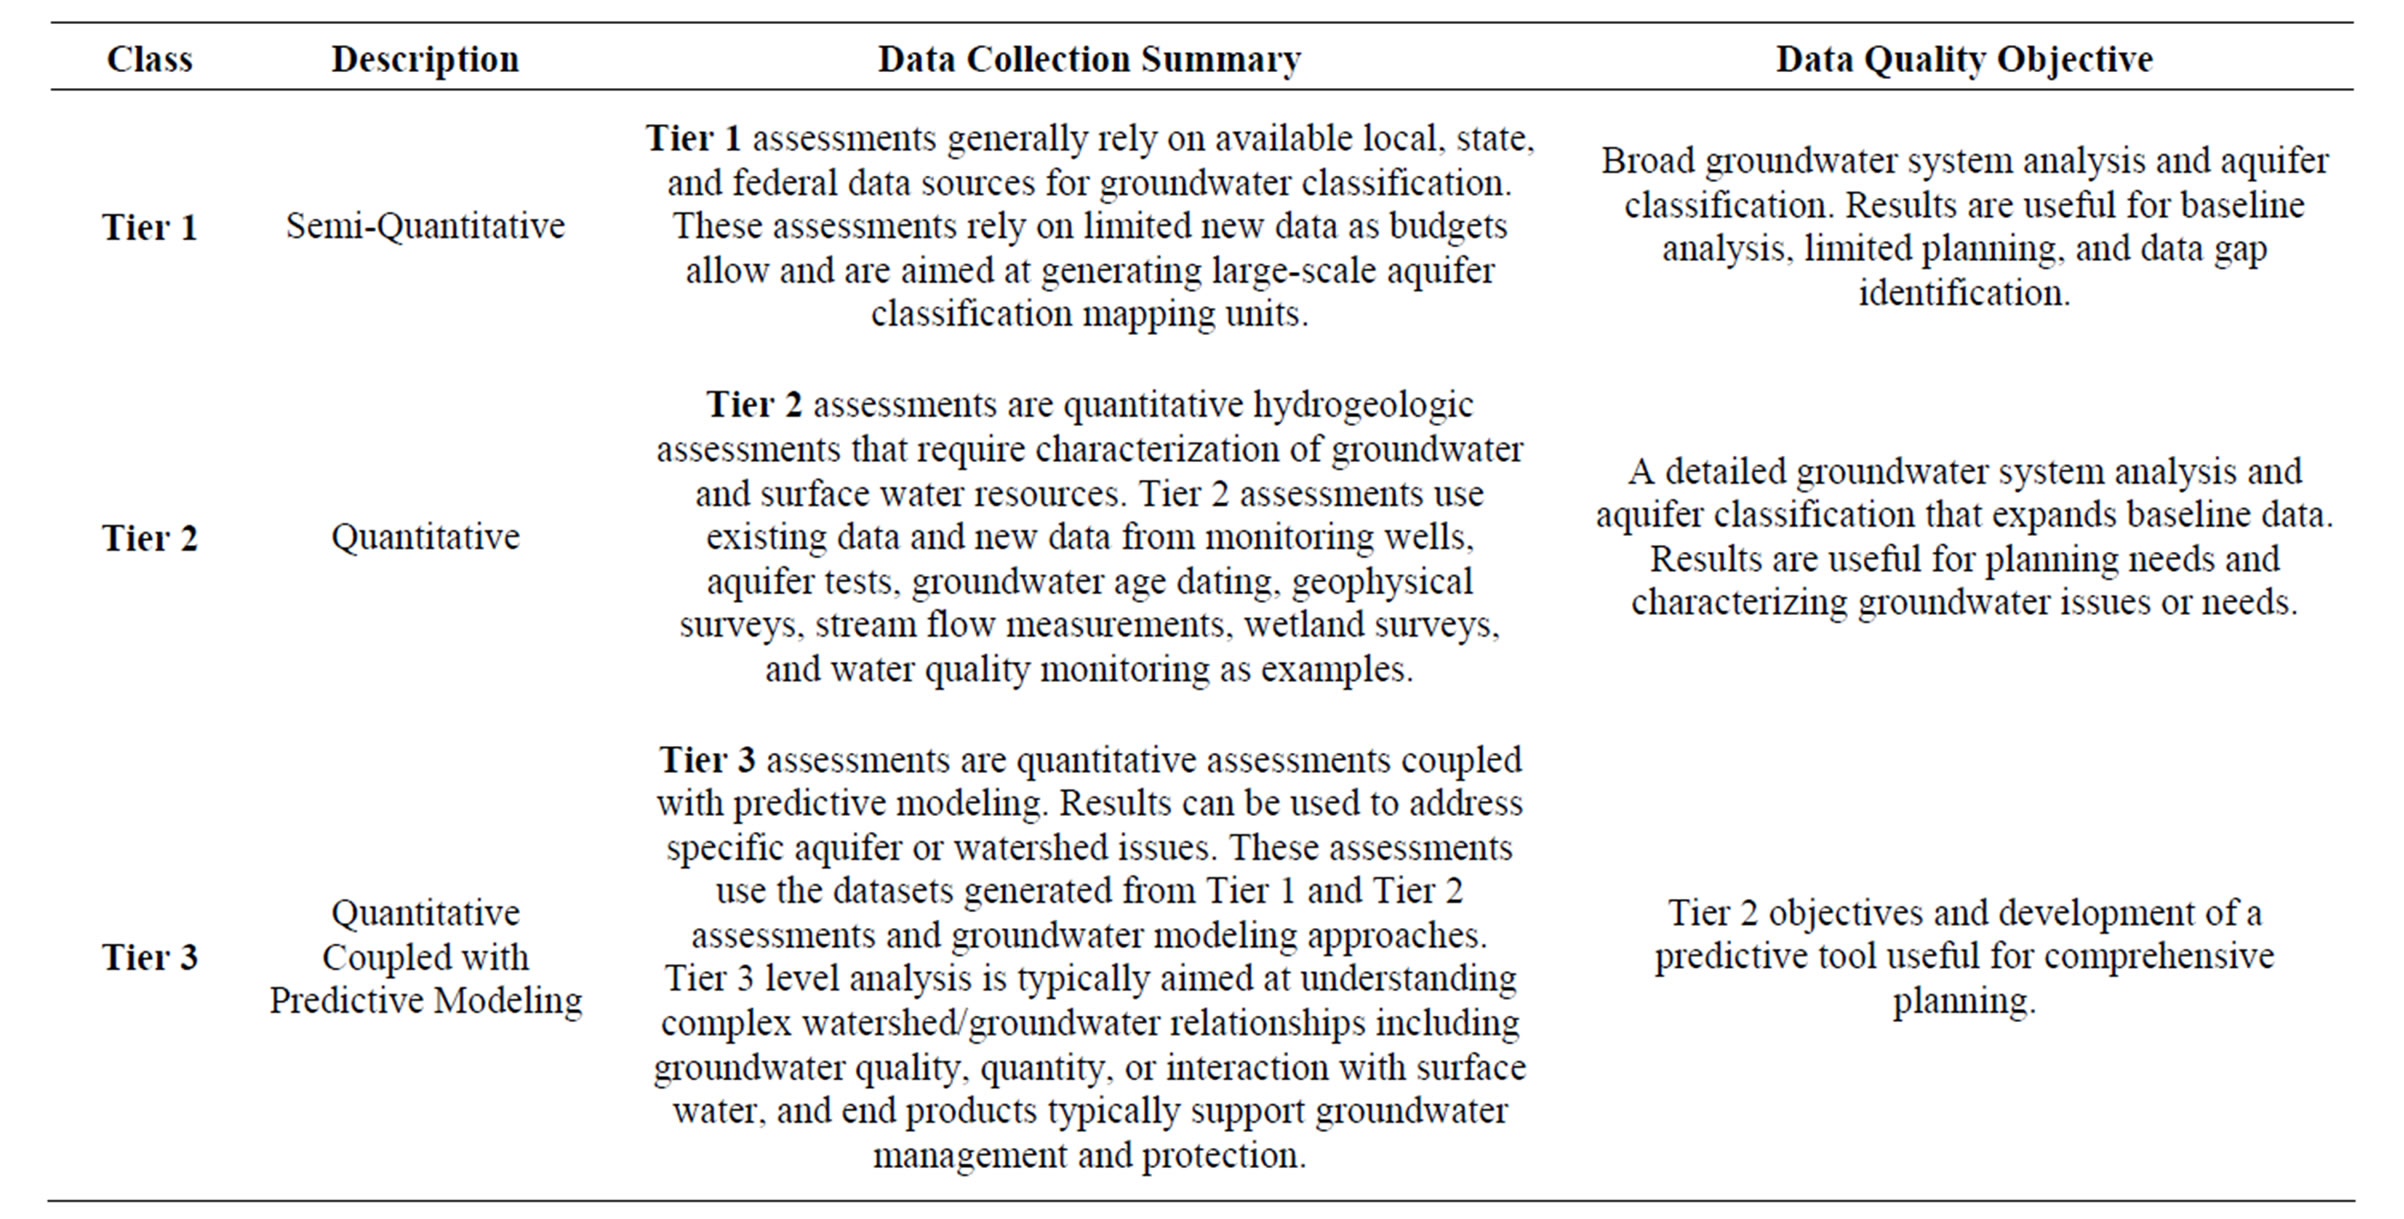
Table 2. A three tier assessment hierarchy for aquifer classification.
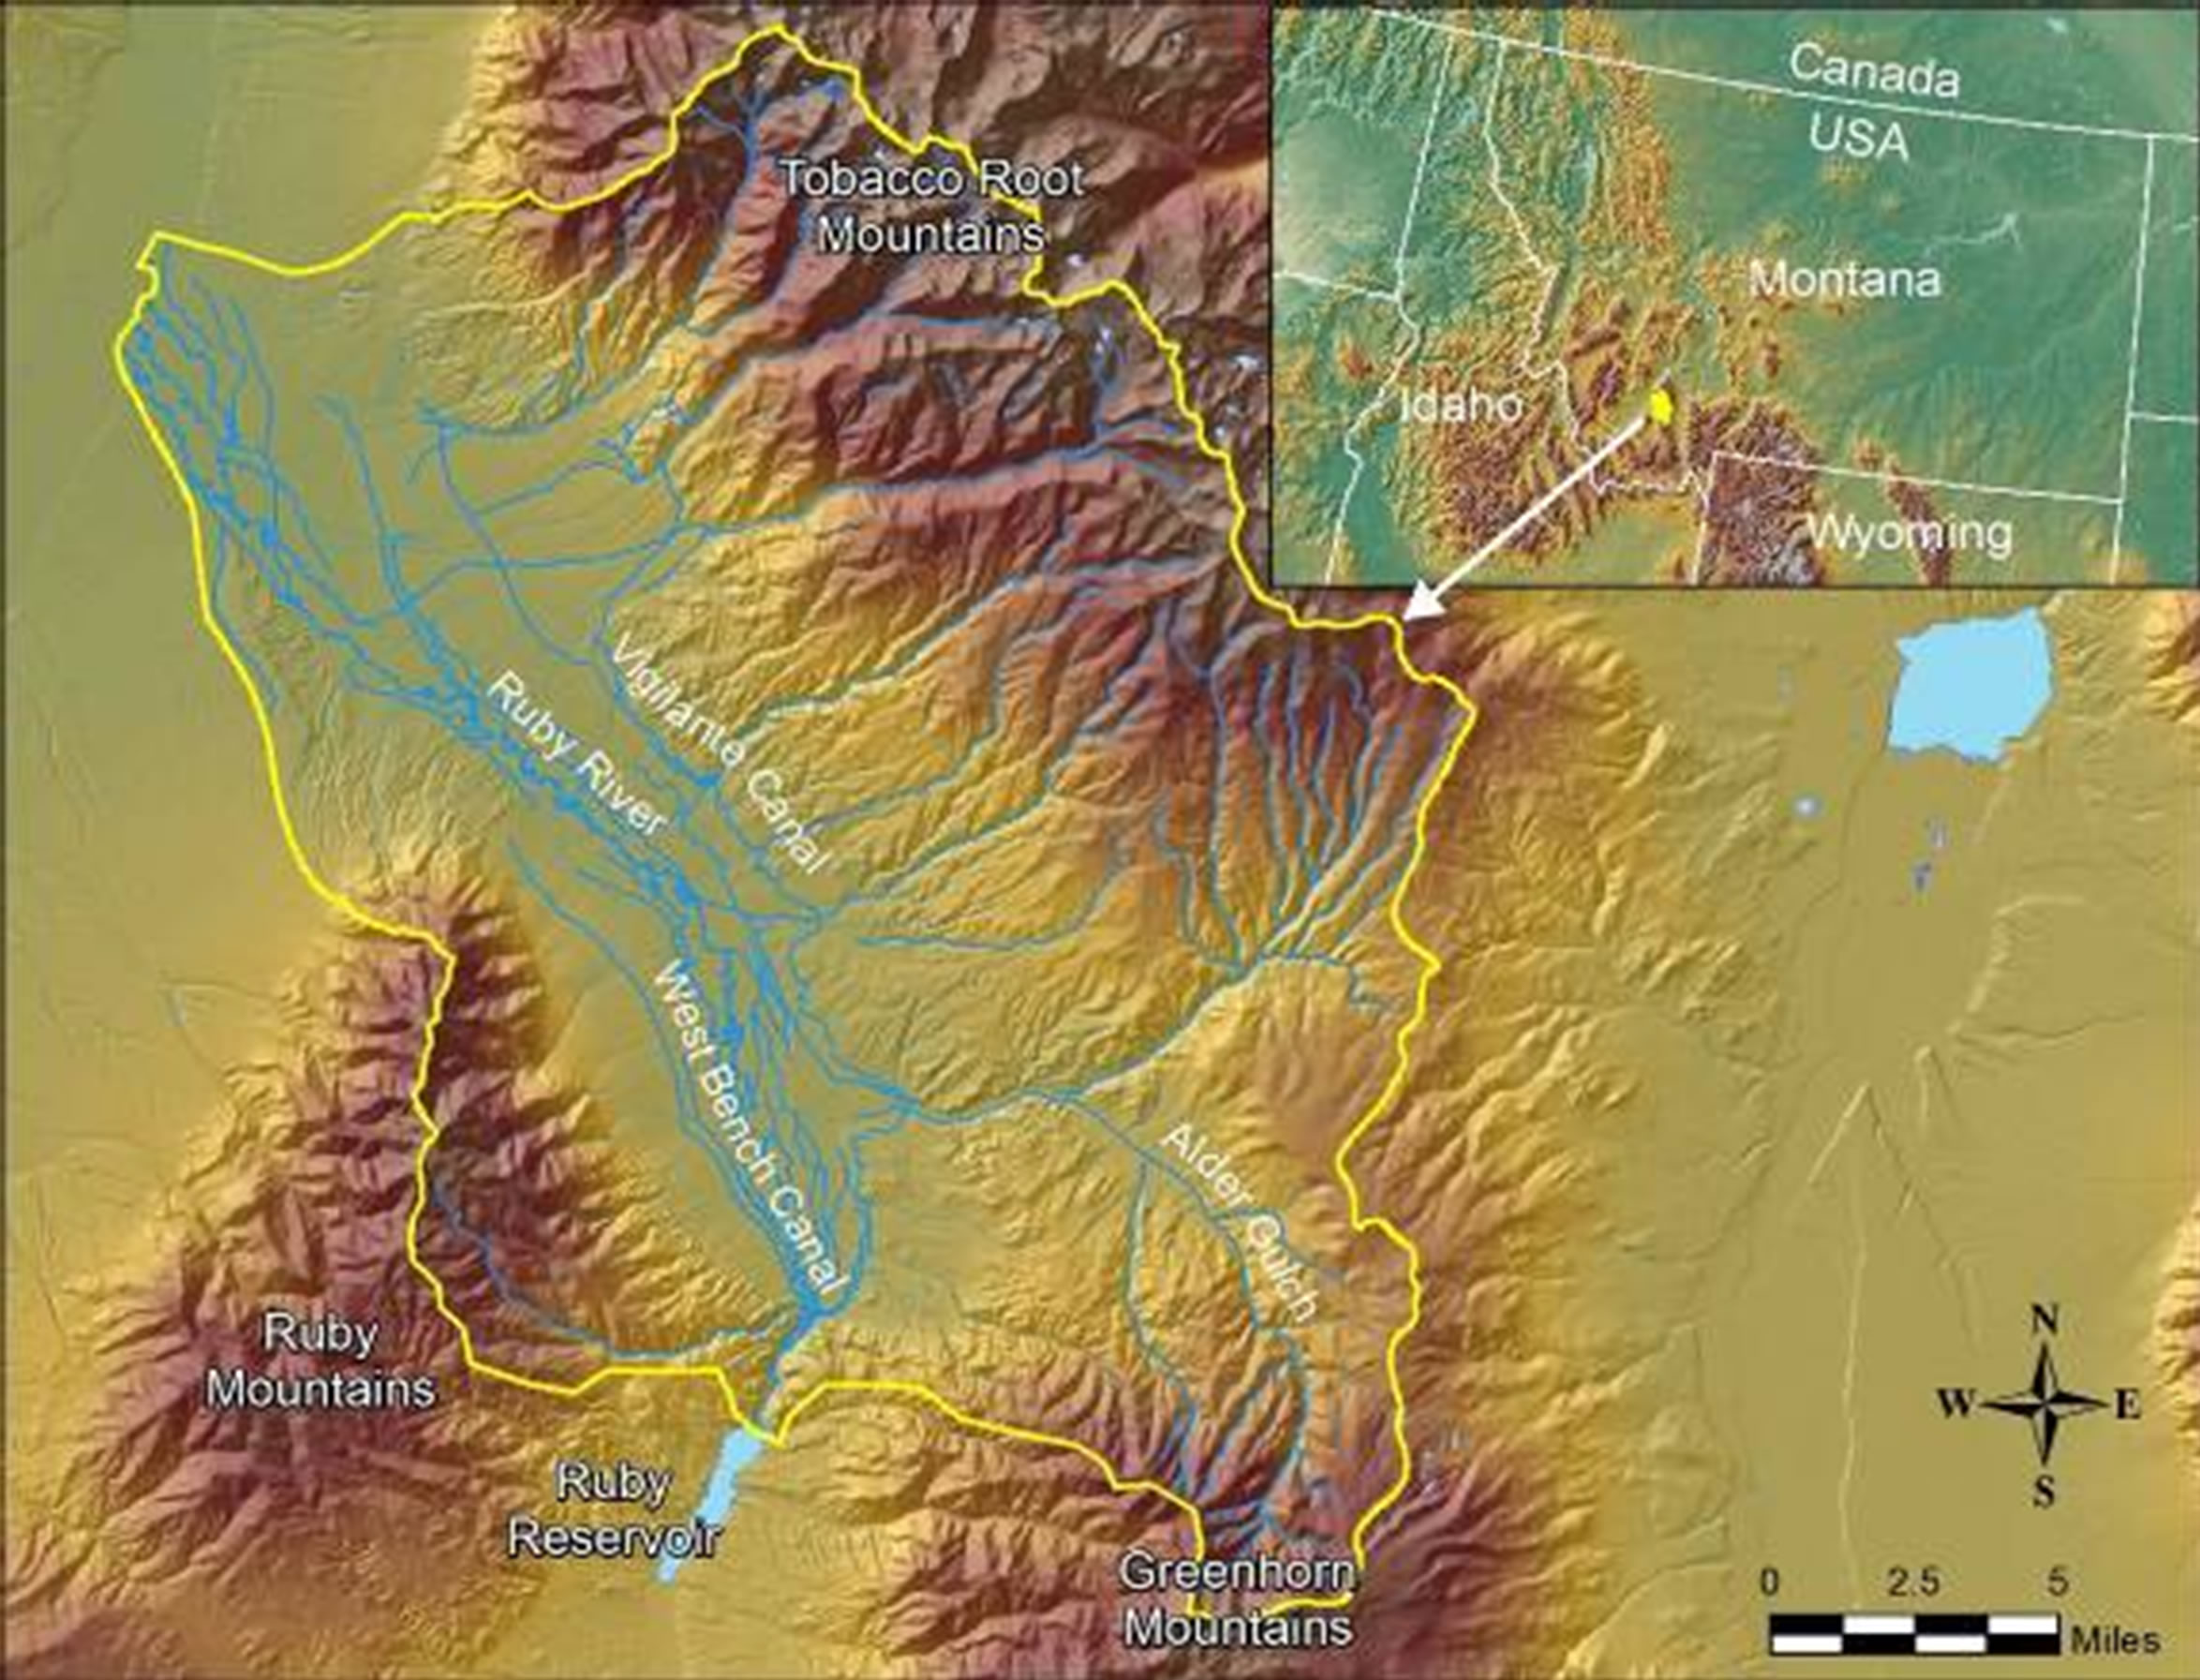
Figure 2. Location map for the lower Ruby Valley study area.
and changes in agricultural water use affect the hydrologic system.
3. Methods
3.1. Watershed Characterization
Table 3 summarizes the datasets compiled using standard hydrological and hydrogeologic methodologies [16] except in areas with sparse groundwater data where depth to groundwater was inferred from vegetation types [27]. Figures 3-9 show selected project watershed characterization data.
3.2. GIS Database Management
Final watershed characterization information was input into ESRI ArcGIS software for mapping and analysis. Project GIS data (Table 3) were organized into a database that supports aquifer classification as well as future hydrogeological analyses.
3.3. Aquifer Classification
The groundwater classification methodology applied to the lower Ruby Valley groundwater system used the criteria described by Payne and Woessner [15]. Aquifer classification codes in metric and English units and pro-
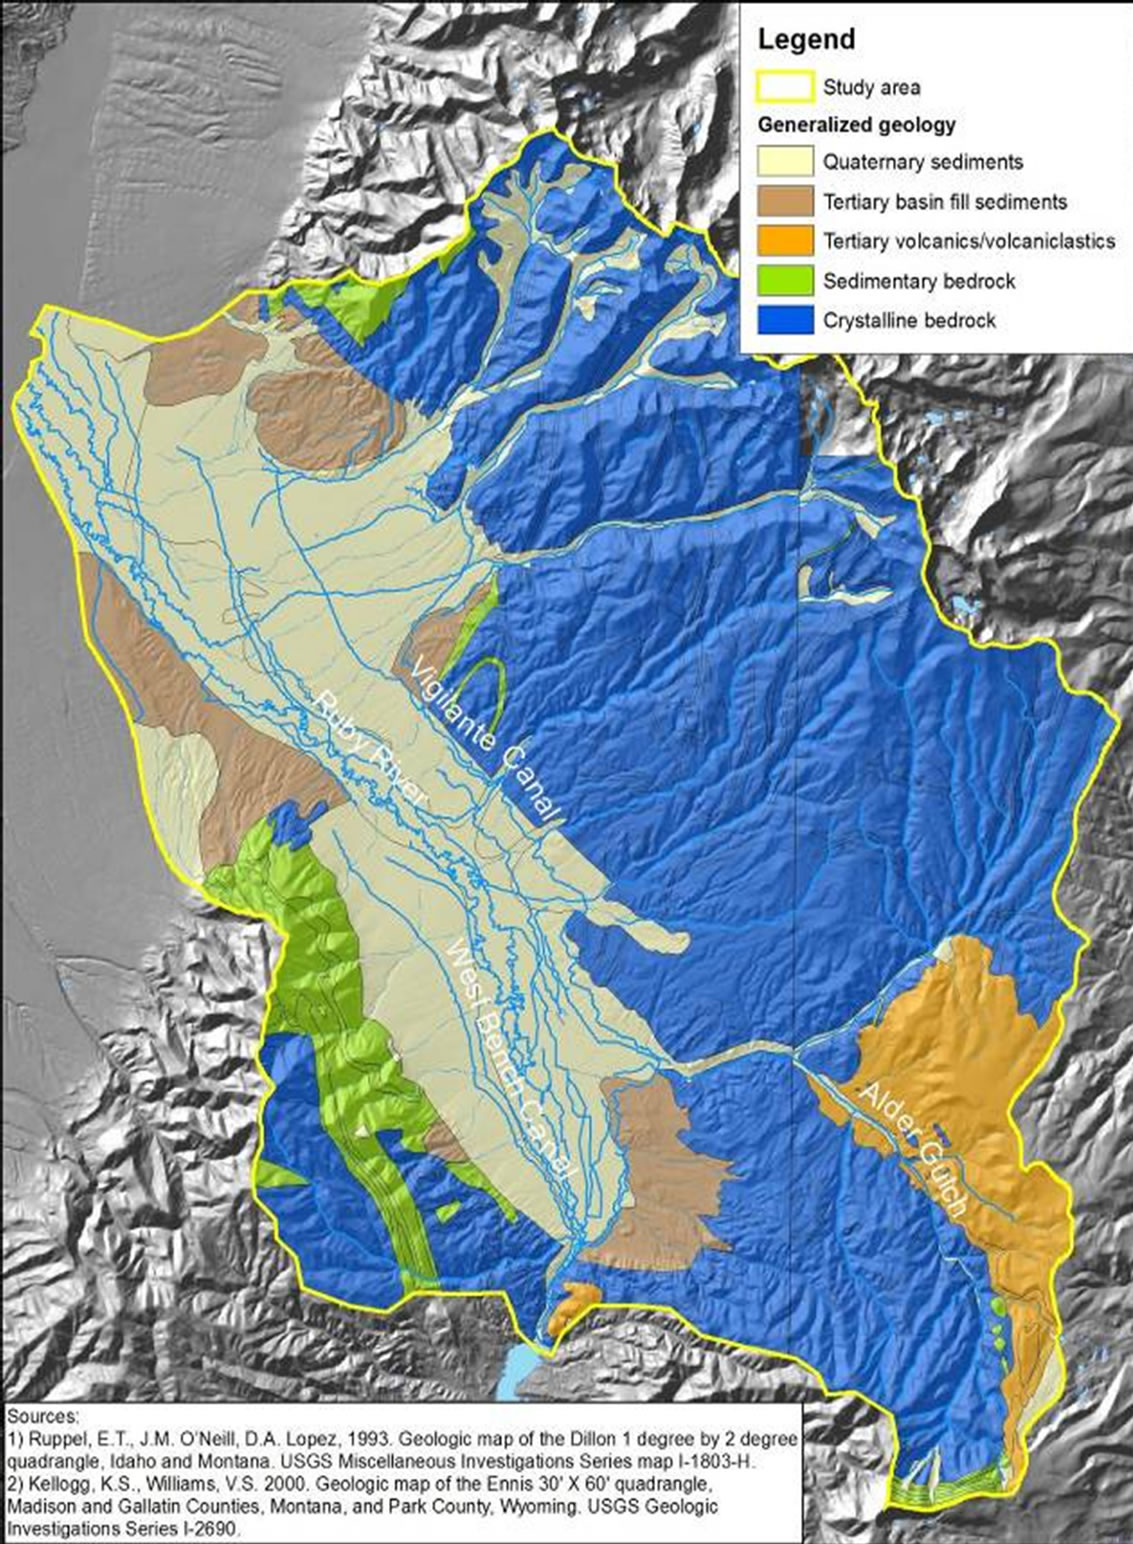
Figure 3. Lower Ruby Valley Geologic Map.
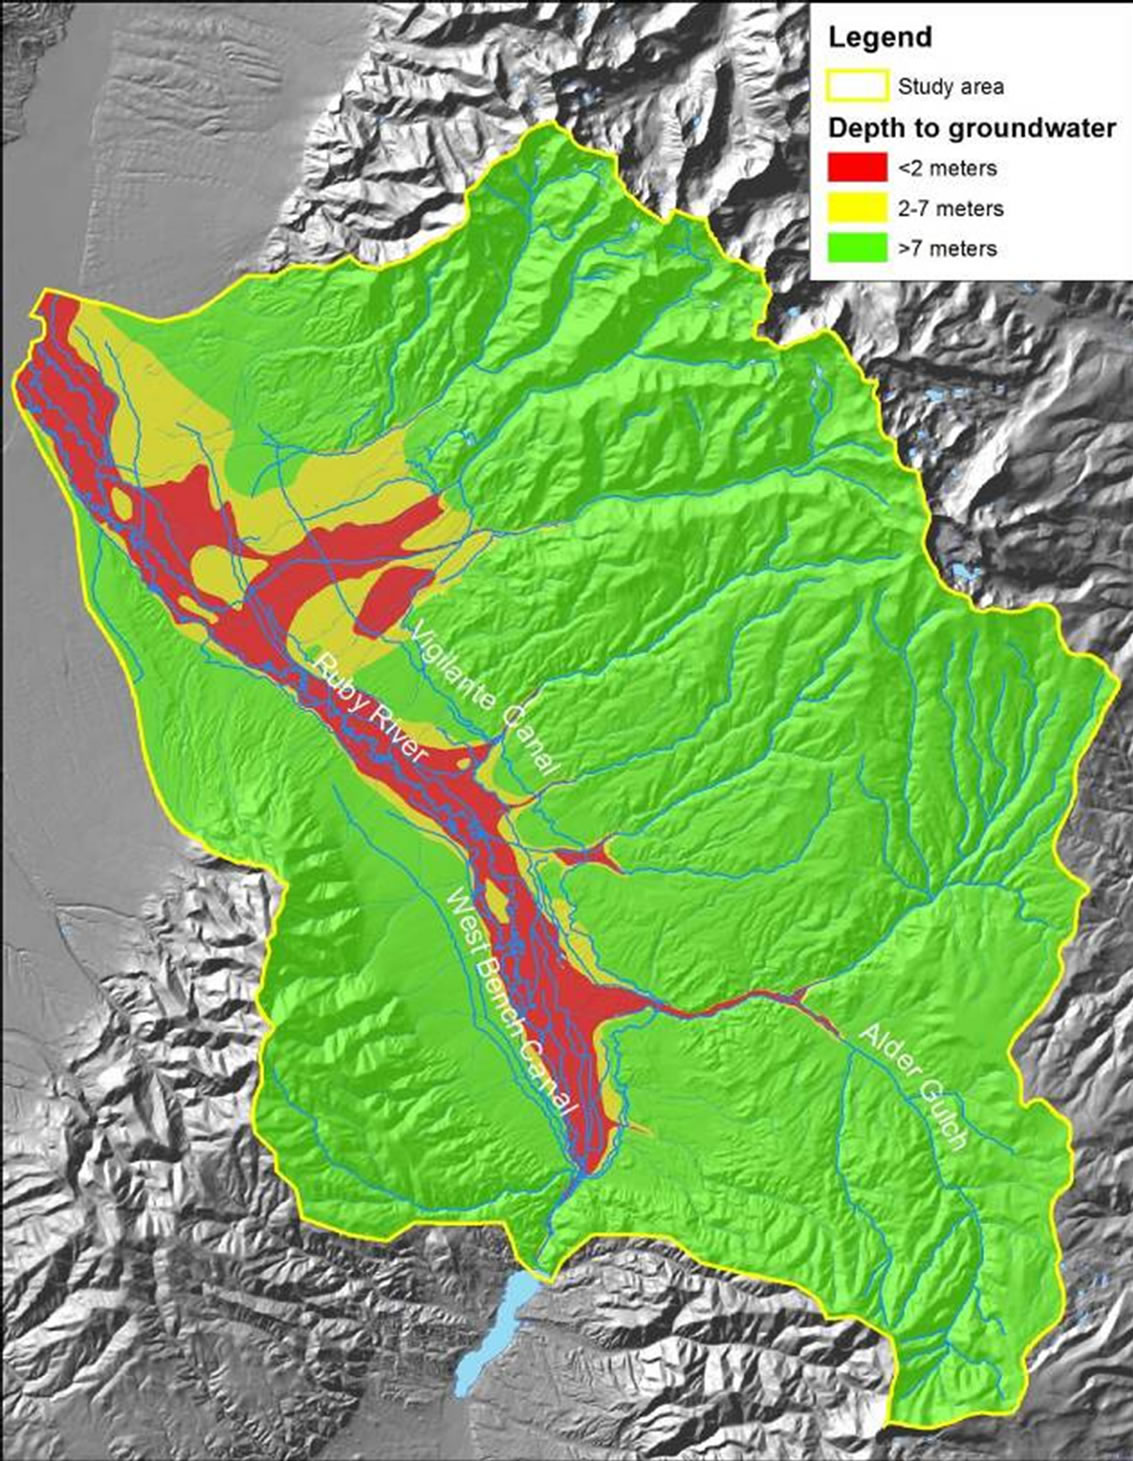
Figure 4. Lower Ruby Valley depth to Ground-water [15].
ject plates/large scale maps are online at: http://www.kirkenr.com/index_files/ProjectLinks.html along with example GIS files. Aquifer classificationdatasets are generated in five steps described in Figure 1. For the lower Ruby Valley classification, a more detailed Tier 3 level assessment (Table 2) was completed for basin fill sediment aquifers and a Tier 1 level assessment, based on more limited data, was completed for the sur rounding mountain bedrock aquifer. A mapping element, the aquifer classification arrow developed by Payne and Woessner [15], is used to graphically summarize the general direction of groundwater flow and post key project assessment data on project maps.
GIS was used to delineate aquifer boundaries and create and georeference the aquifer classification arrows to show groundwater flow direction and aquifer information. Each aquifer is assigned a color or pattern with solid lines separating aquifer boundaries. GIS datasets supporting the classification results summarize the geologic framework, aquifer productivity, water quality, water level trends over time, depth to groundwater, and the degree of connection between groundwater and surface water [15].
The geological framework analysis was used to identify hydrostratigraphic units and geologic features that affect groundwater occurrence, flow, and aquifer properties [28,29]. Aquifer size and relative aquifer ca pacity vs. productivity were assessed by mapping the aerial extent
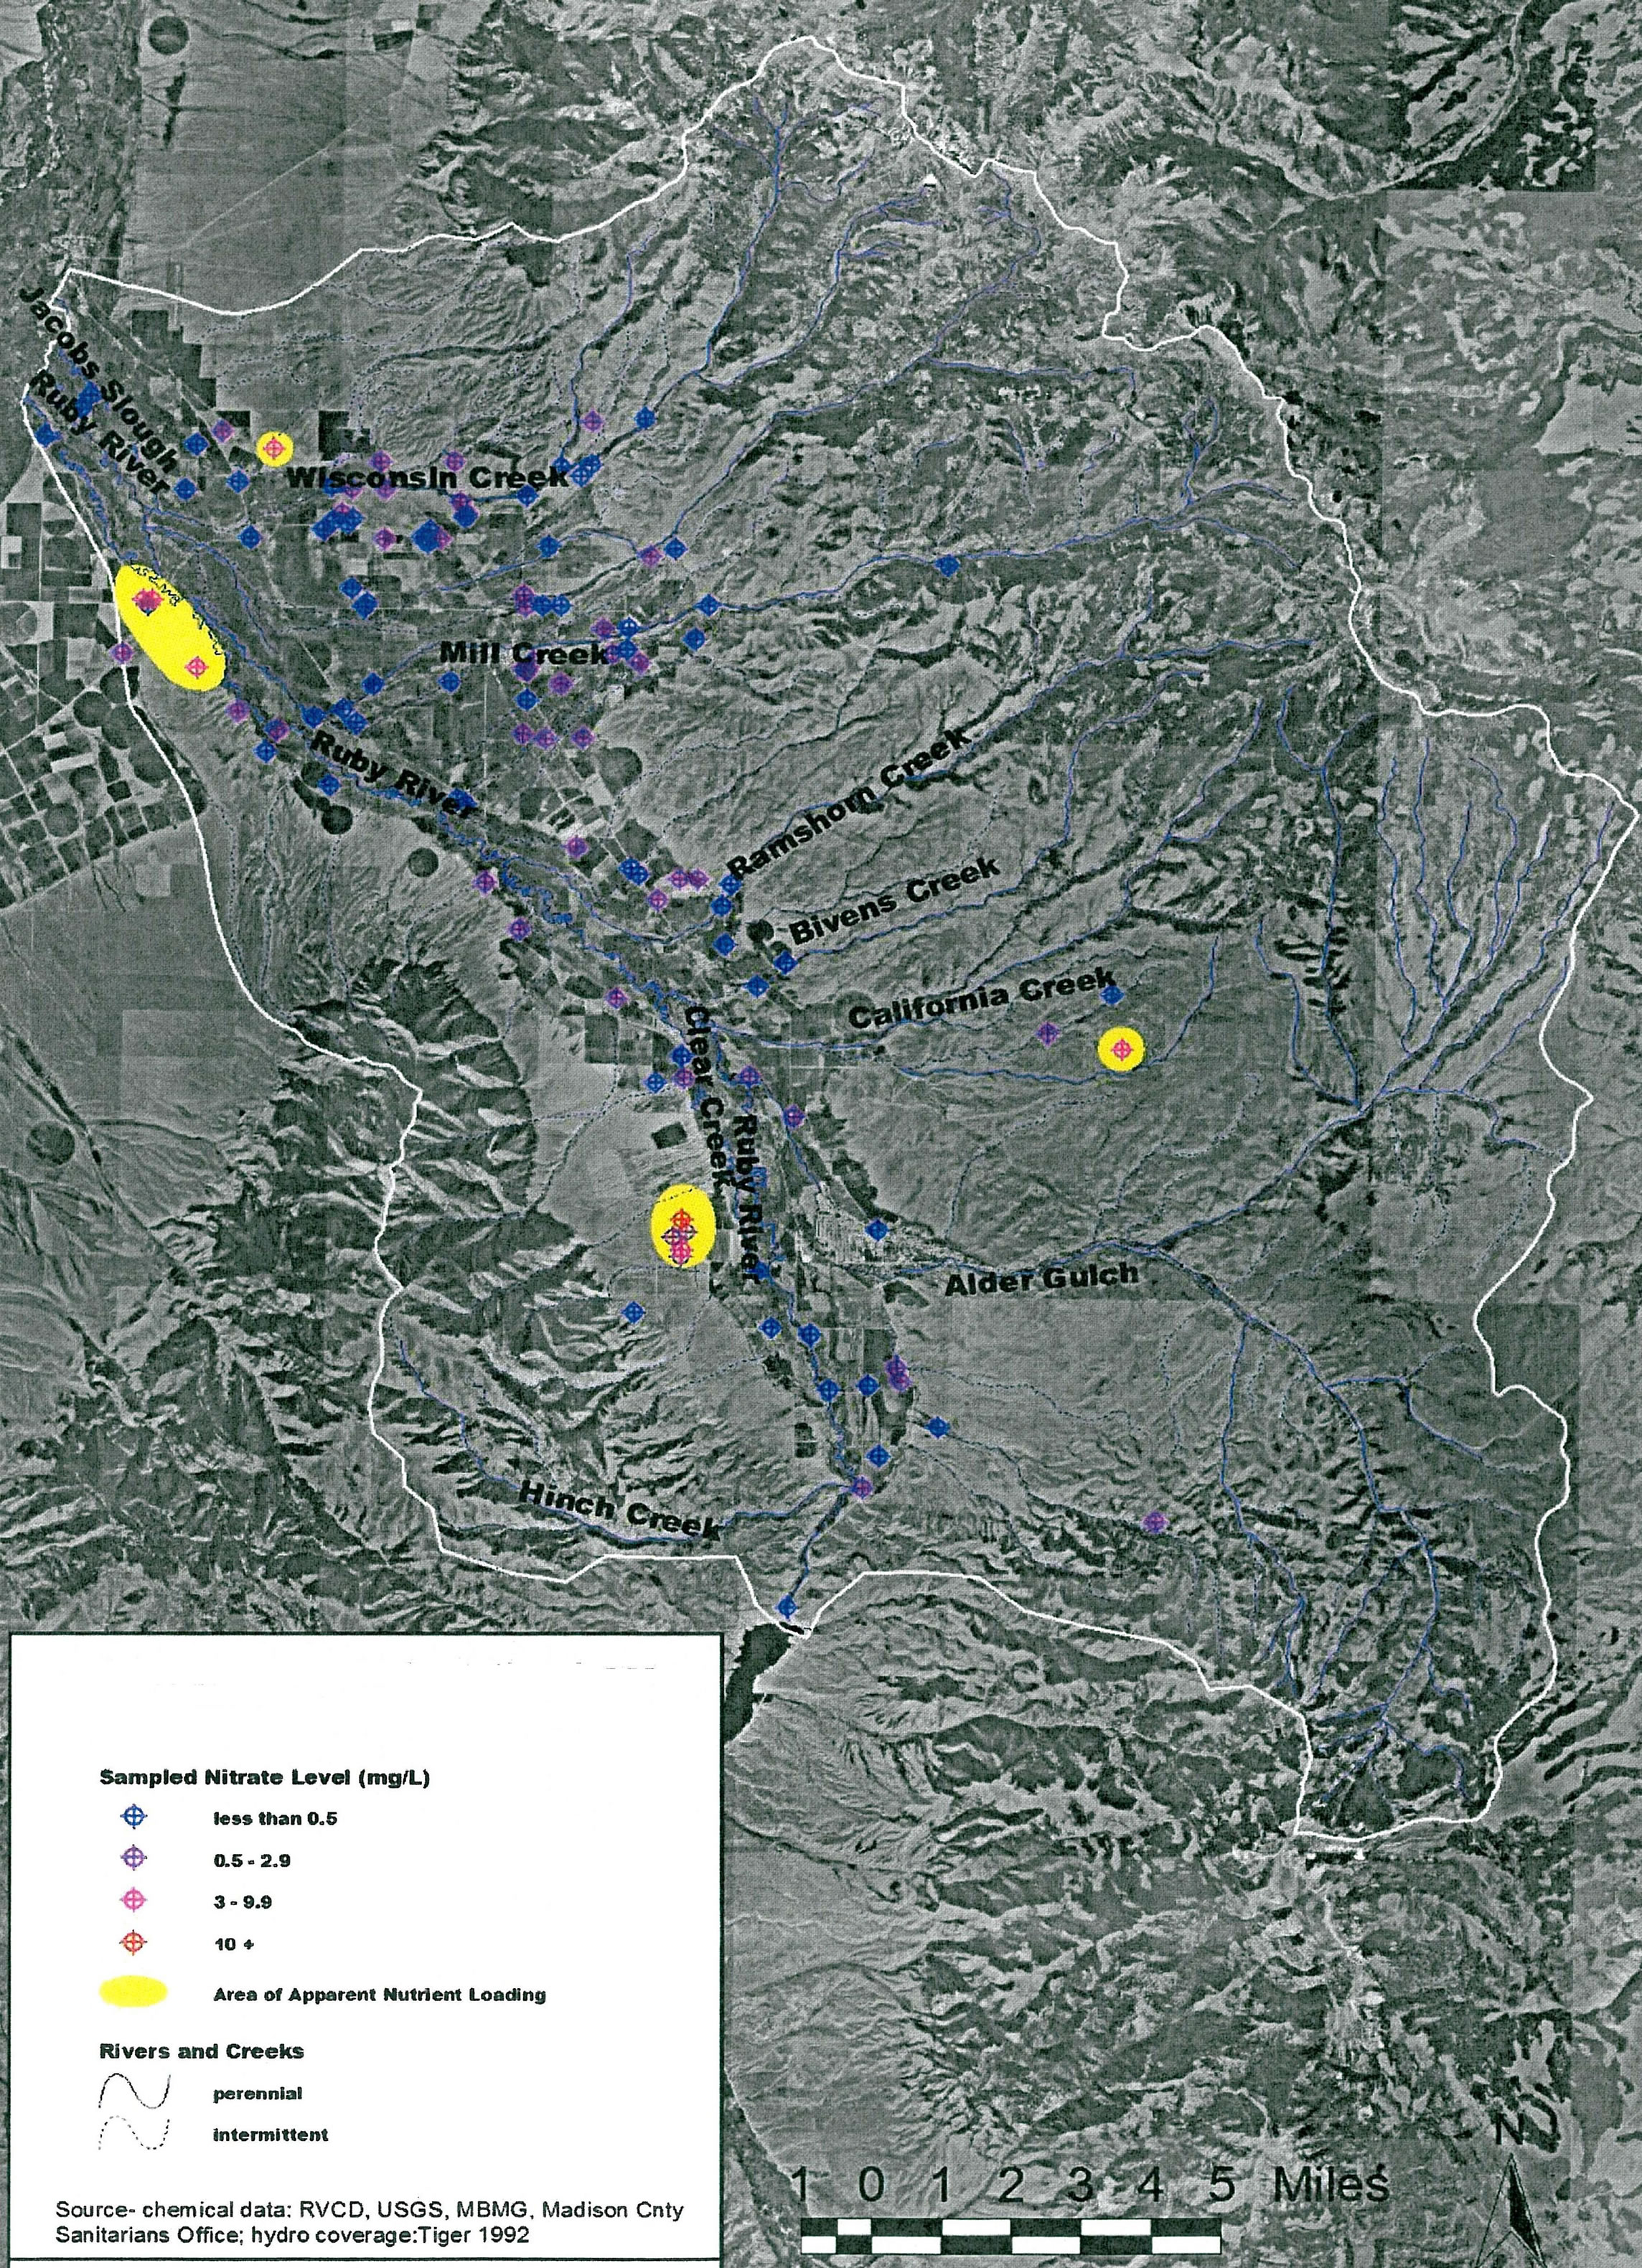
Figure 5. Lower Ruby Valley nutrient loading [15].
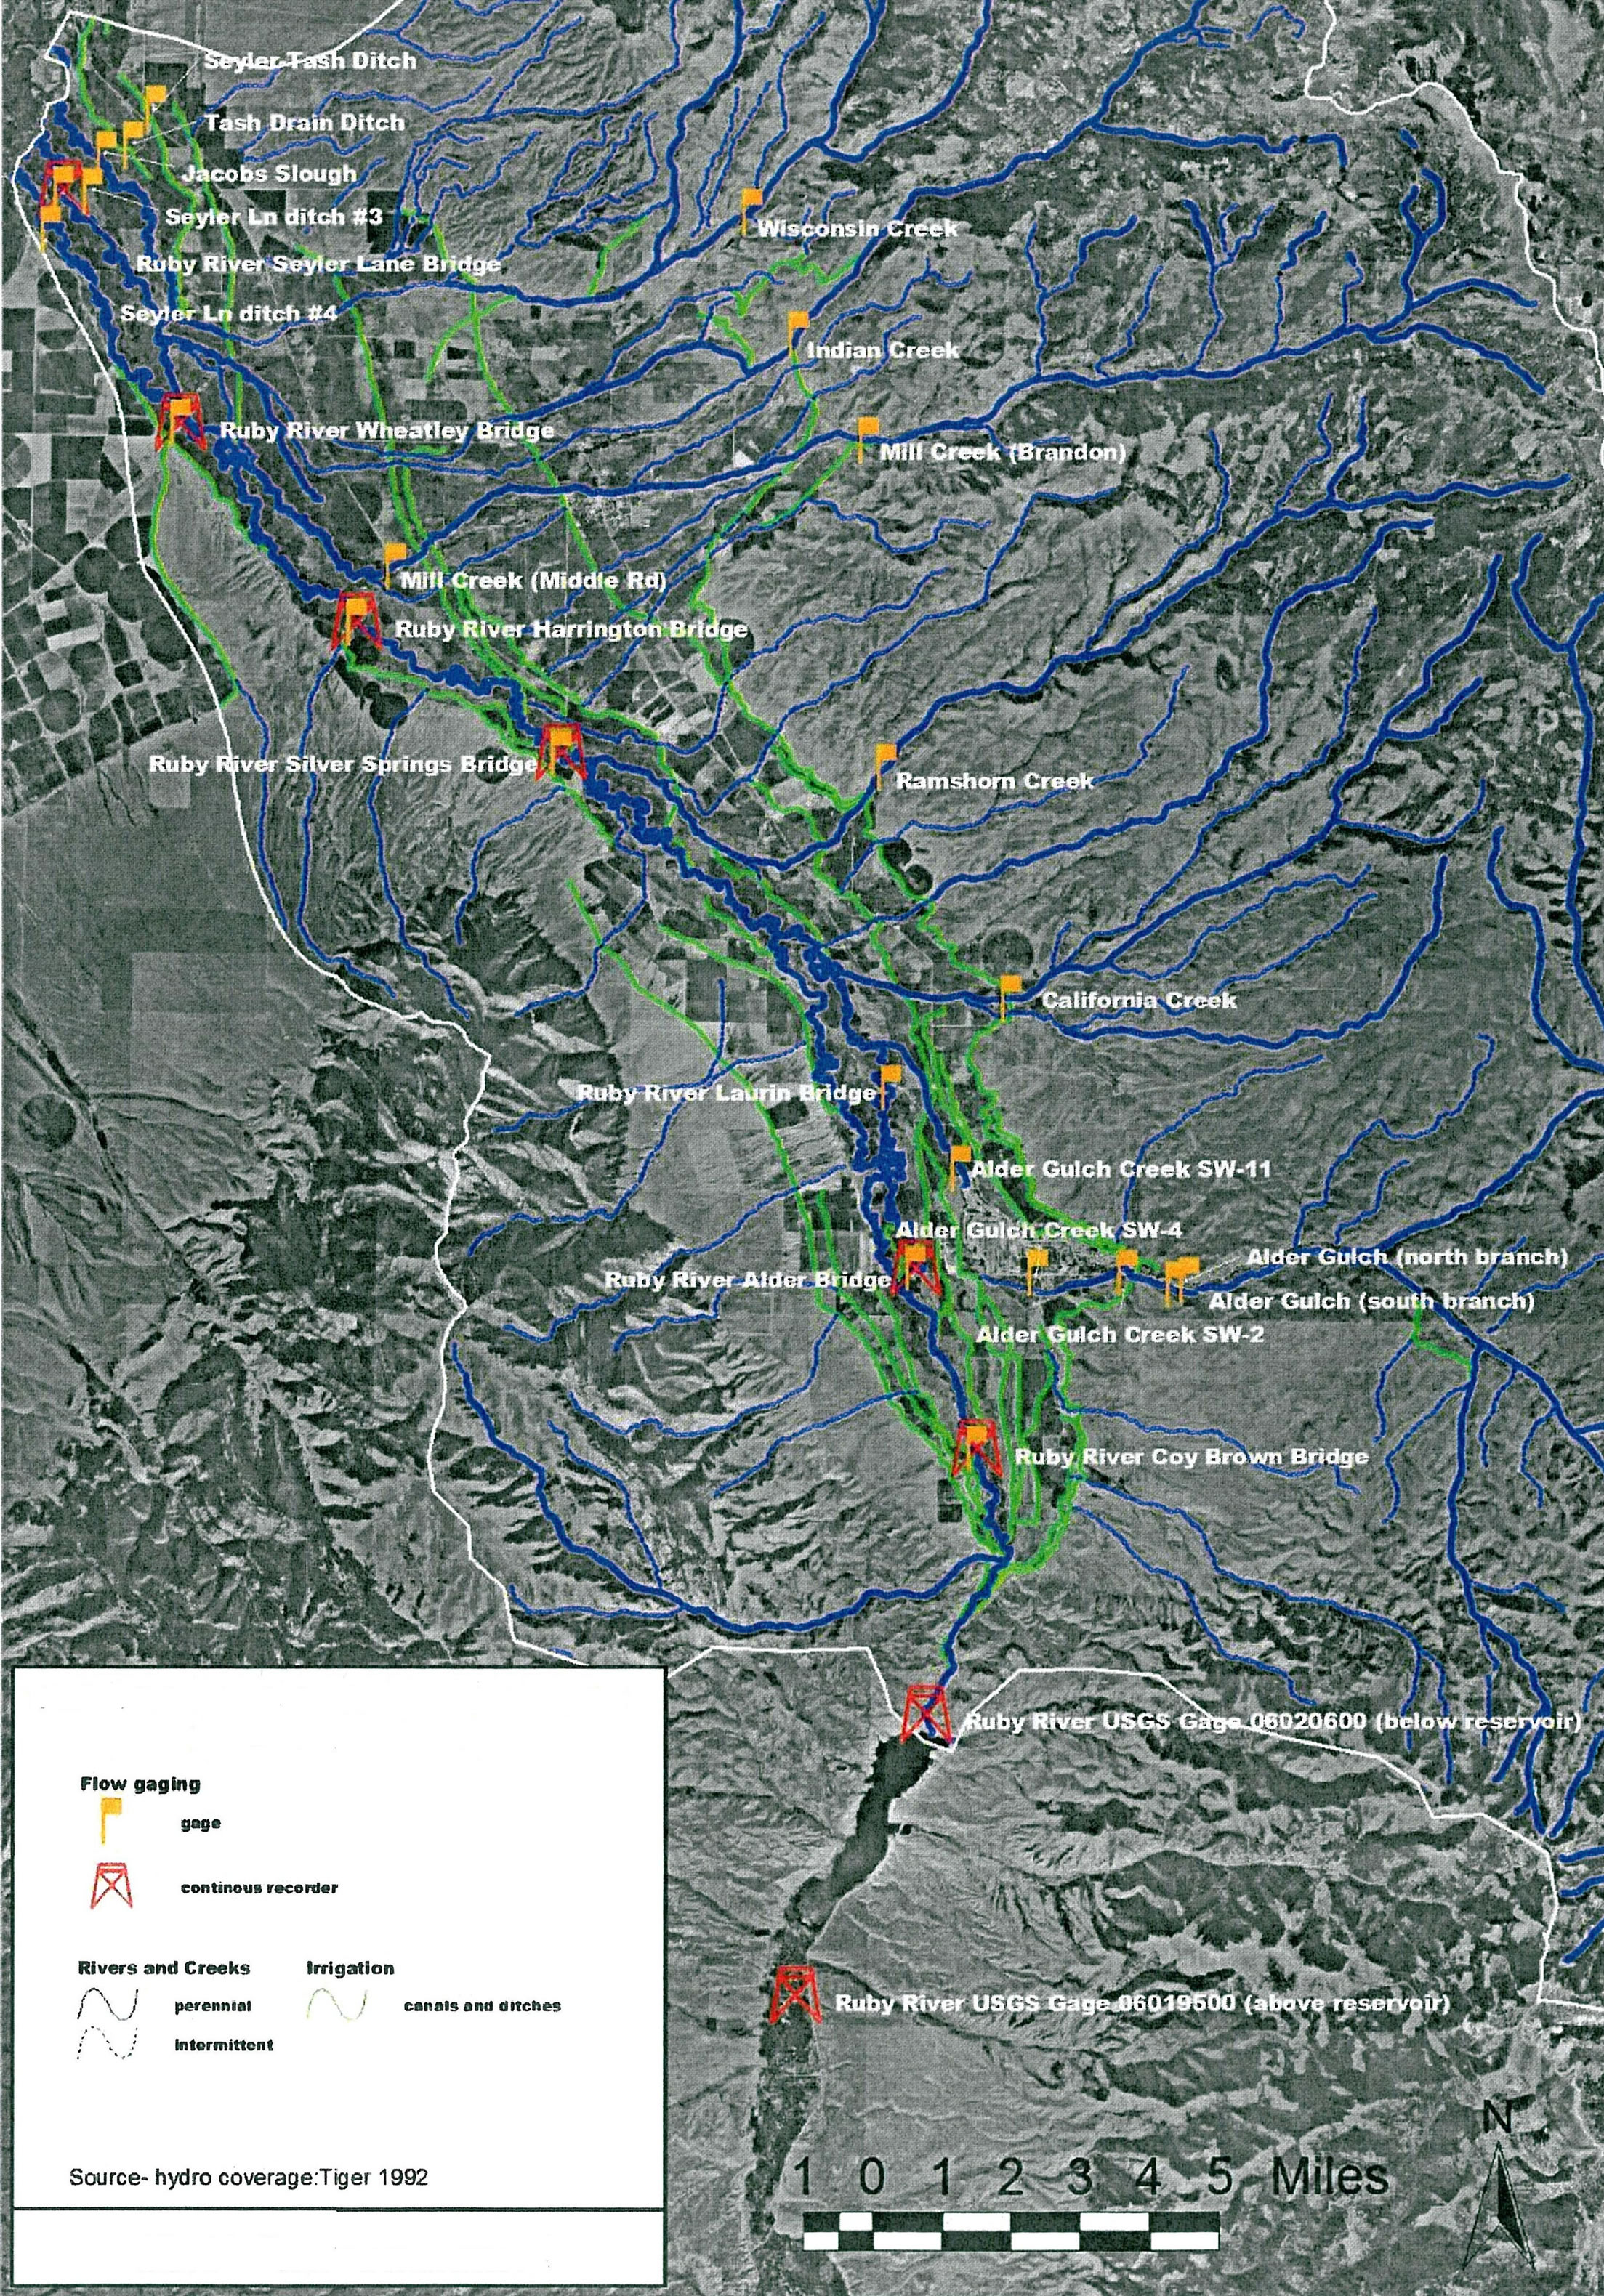
Figure 6. Lower Ruby Valley surface water monitoring features, streams, and irrigation water conveyance [15].
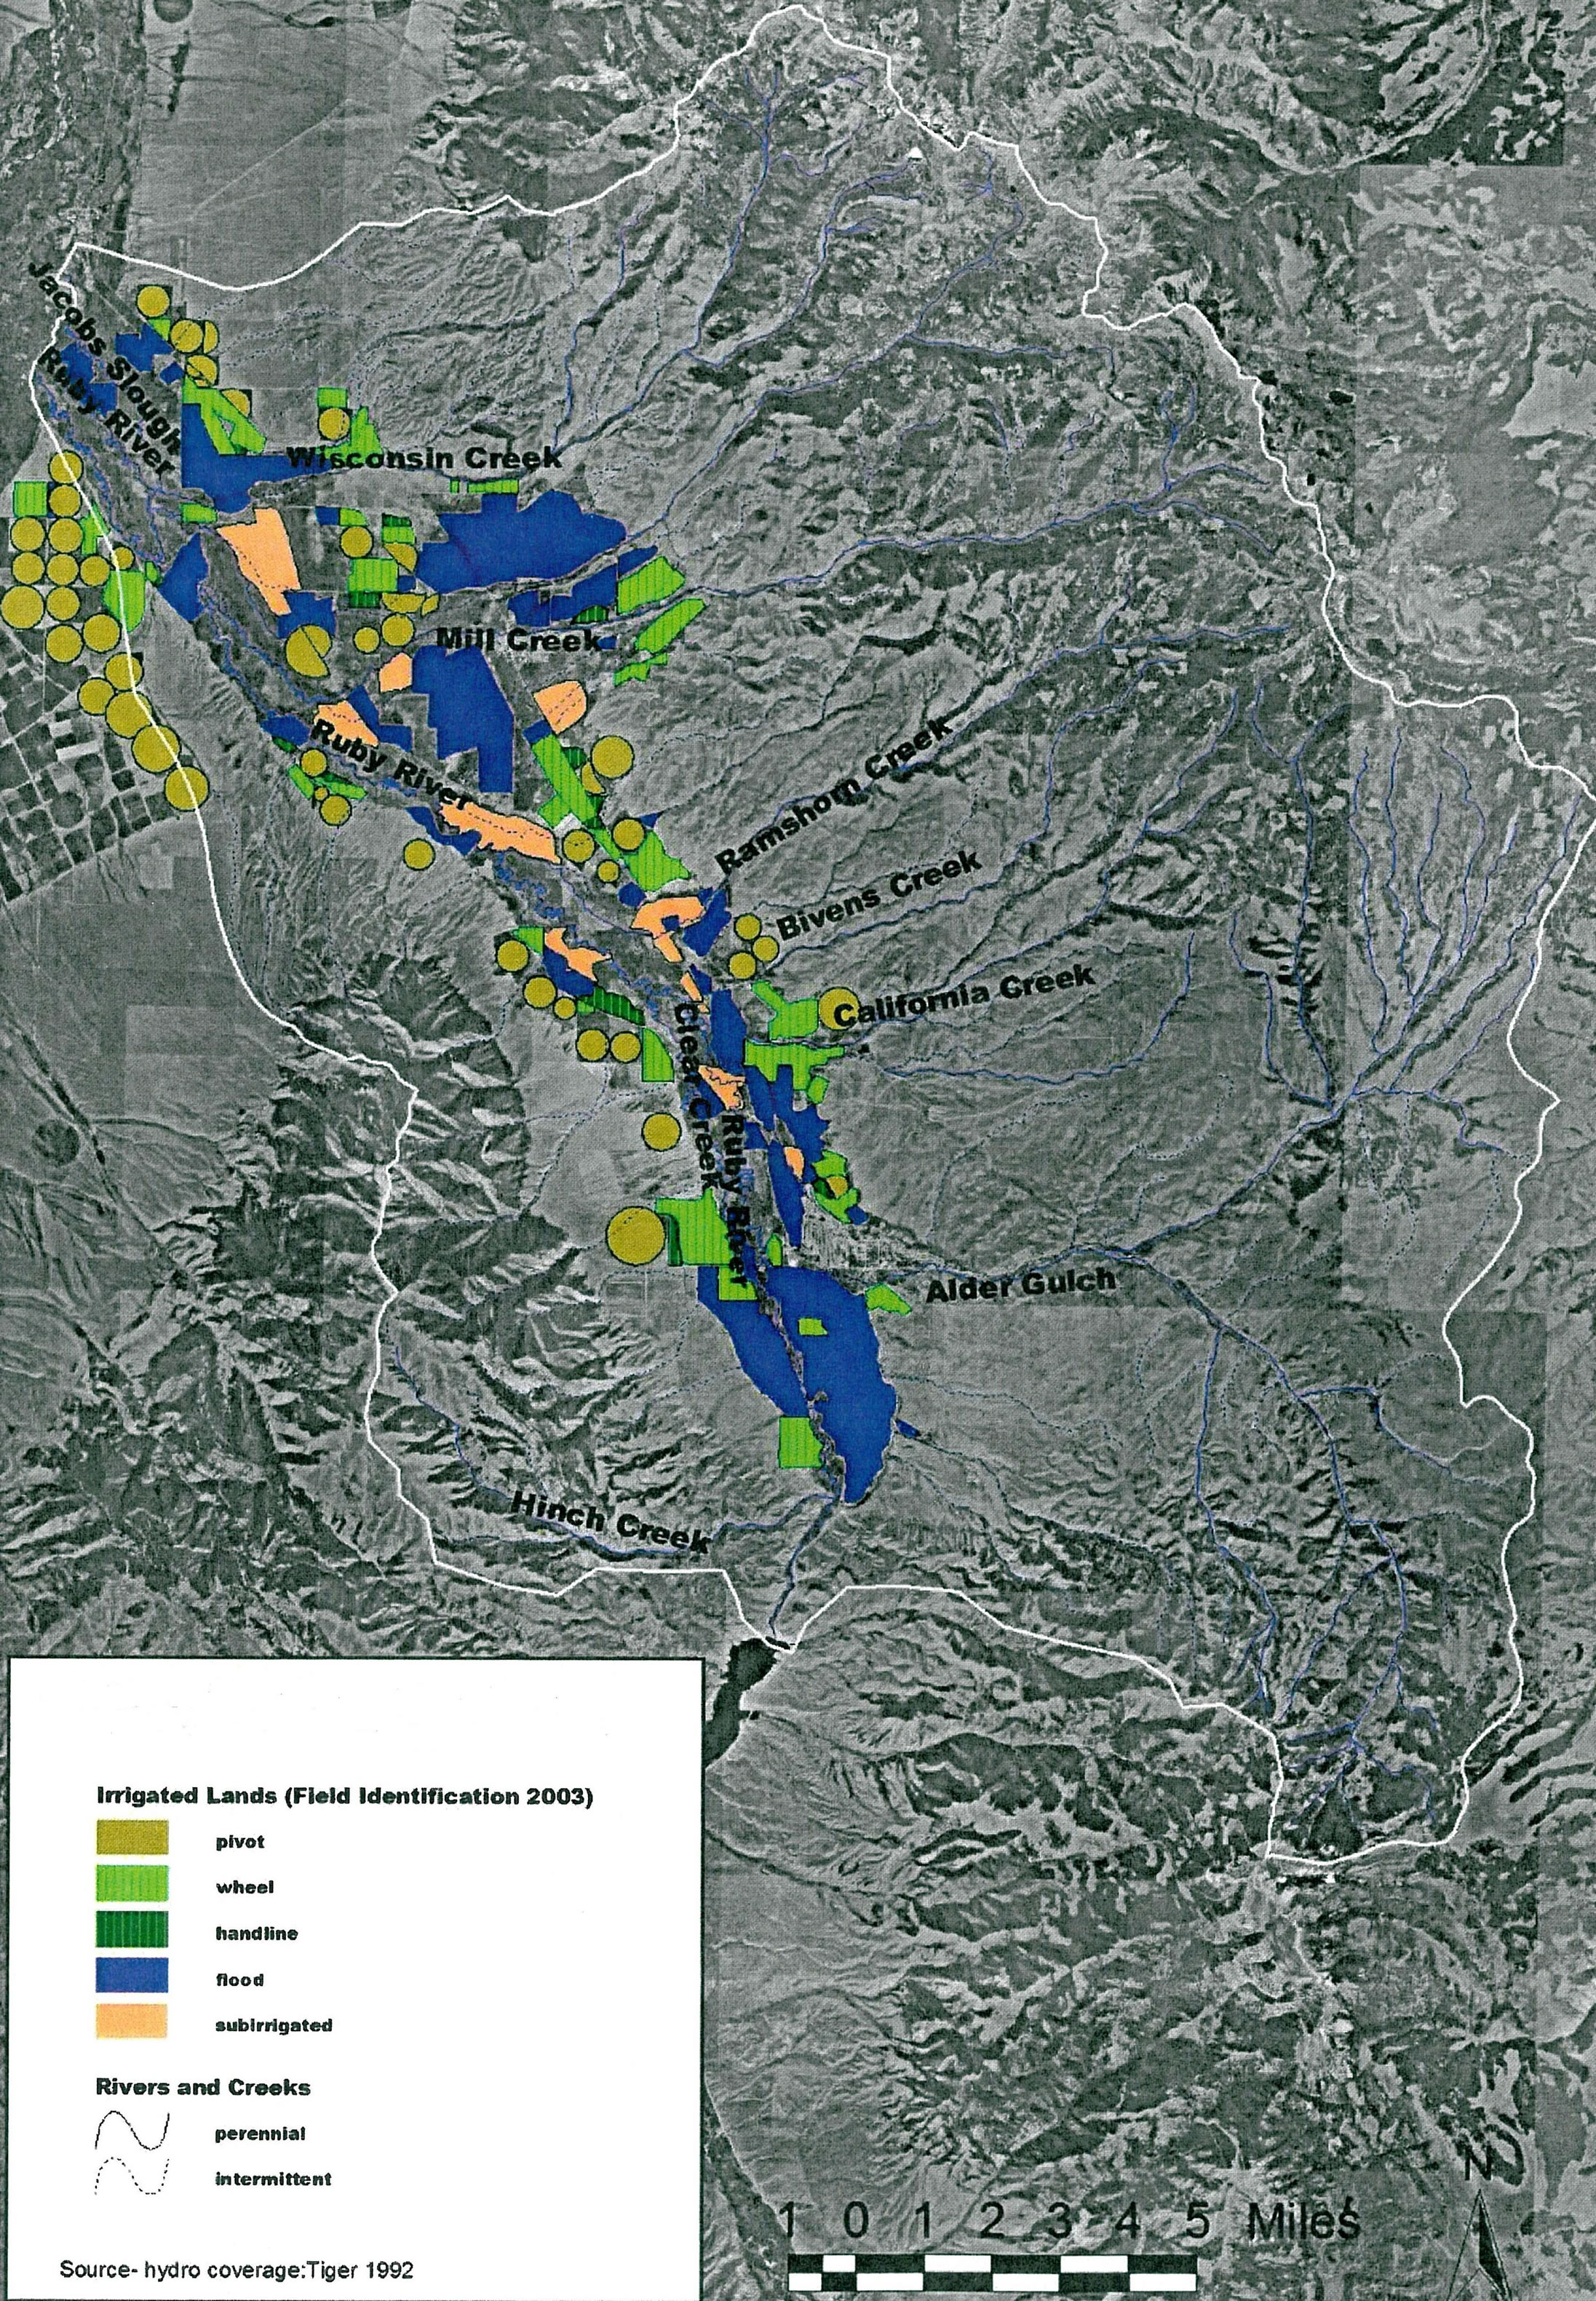
Figure 7. Lower Ruby Valley irrigated lands field mapping results [15].
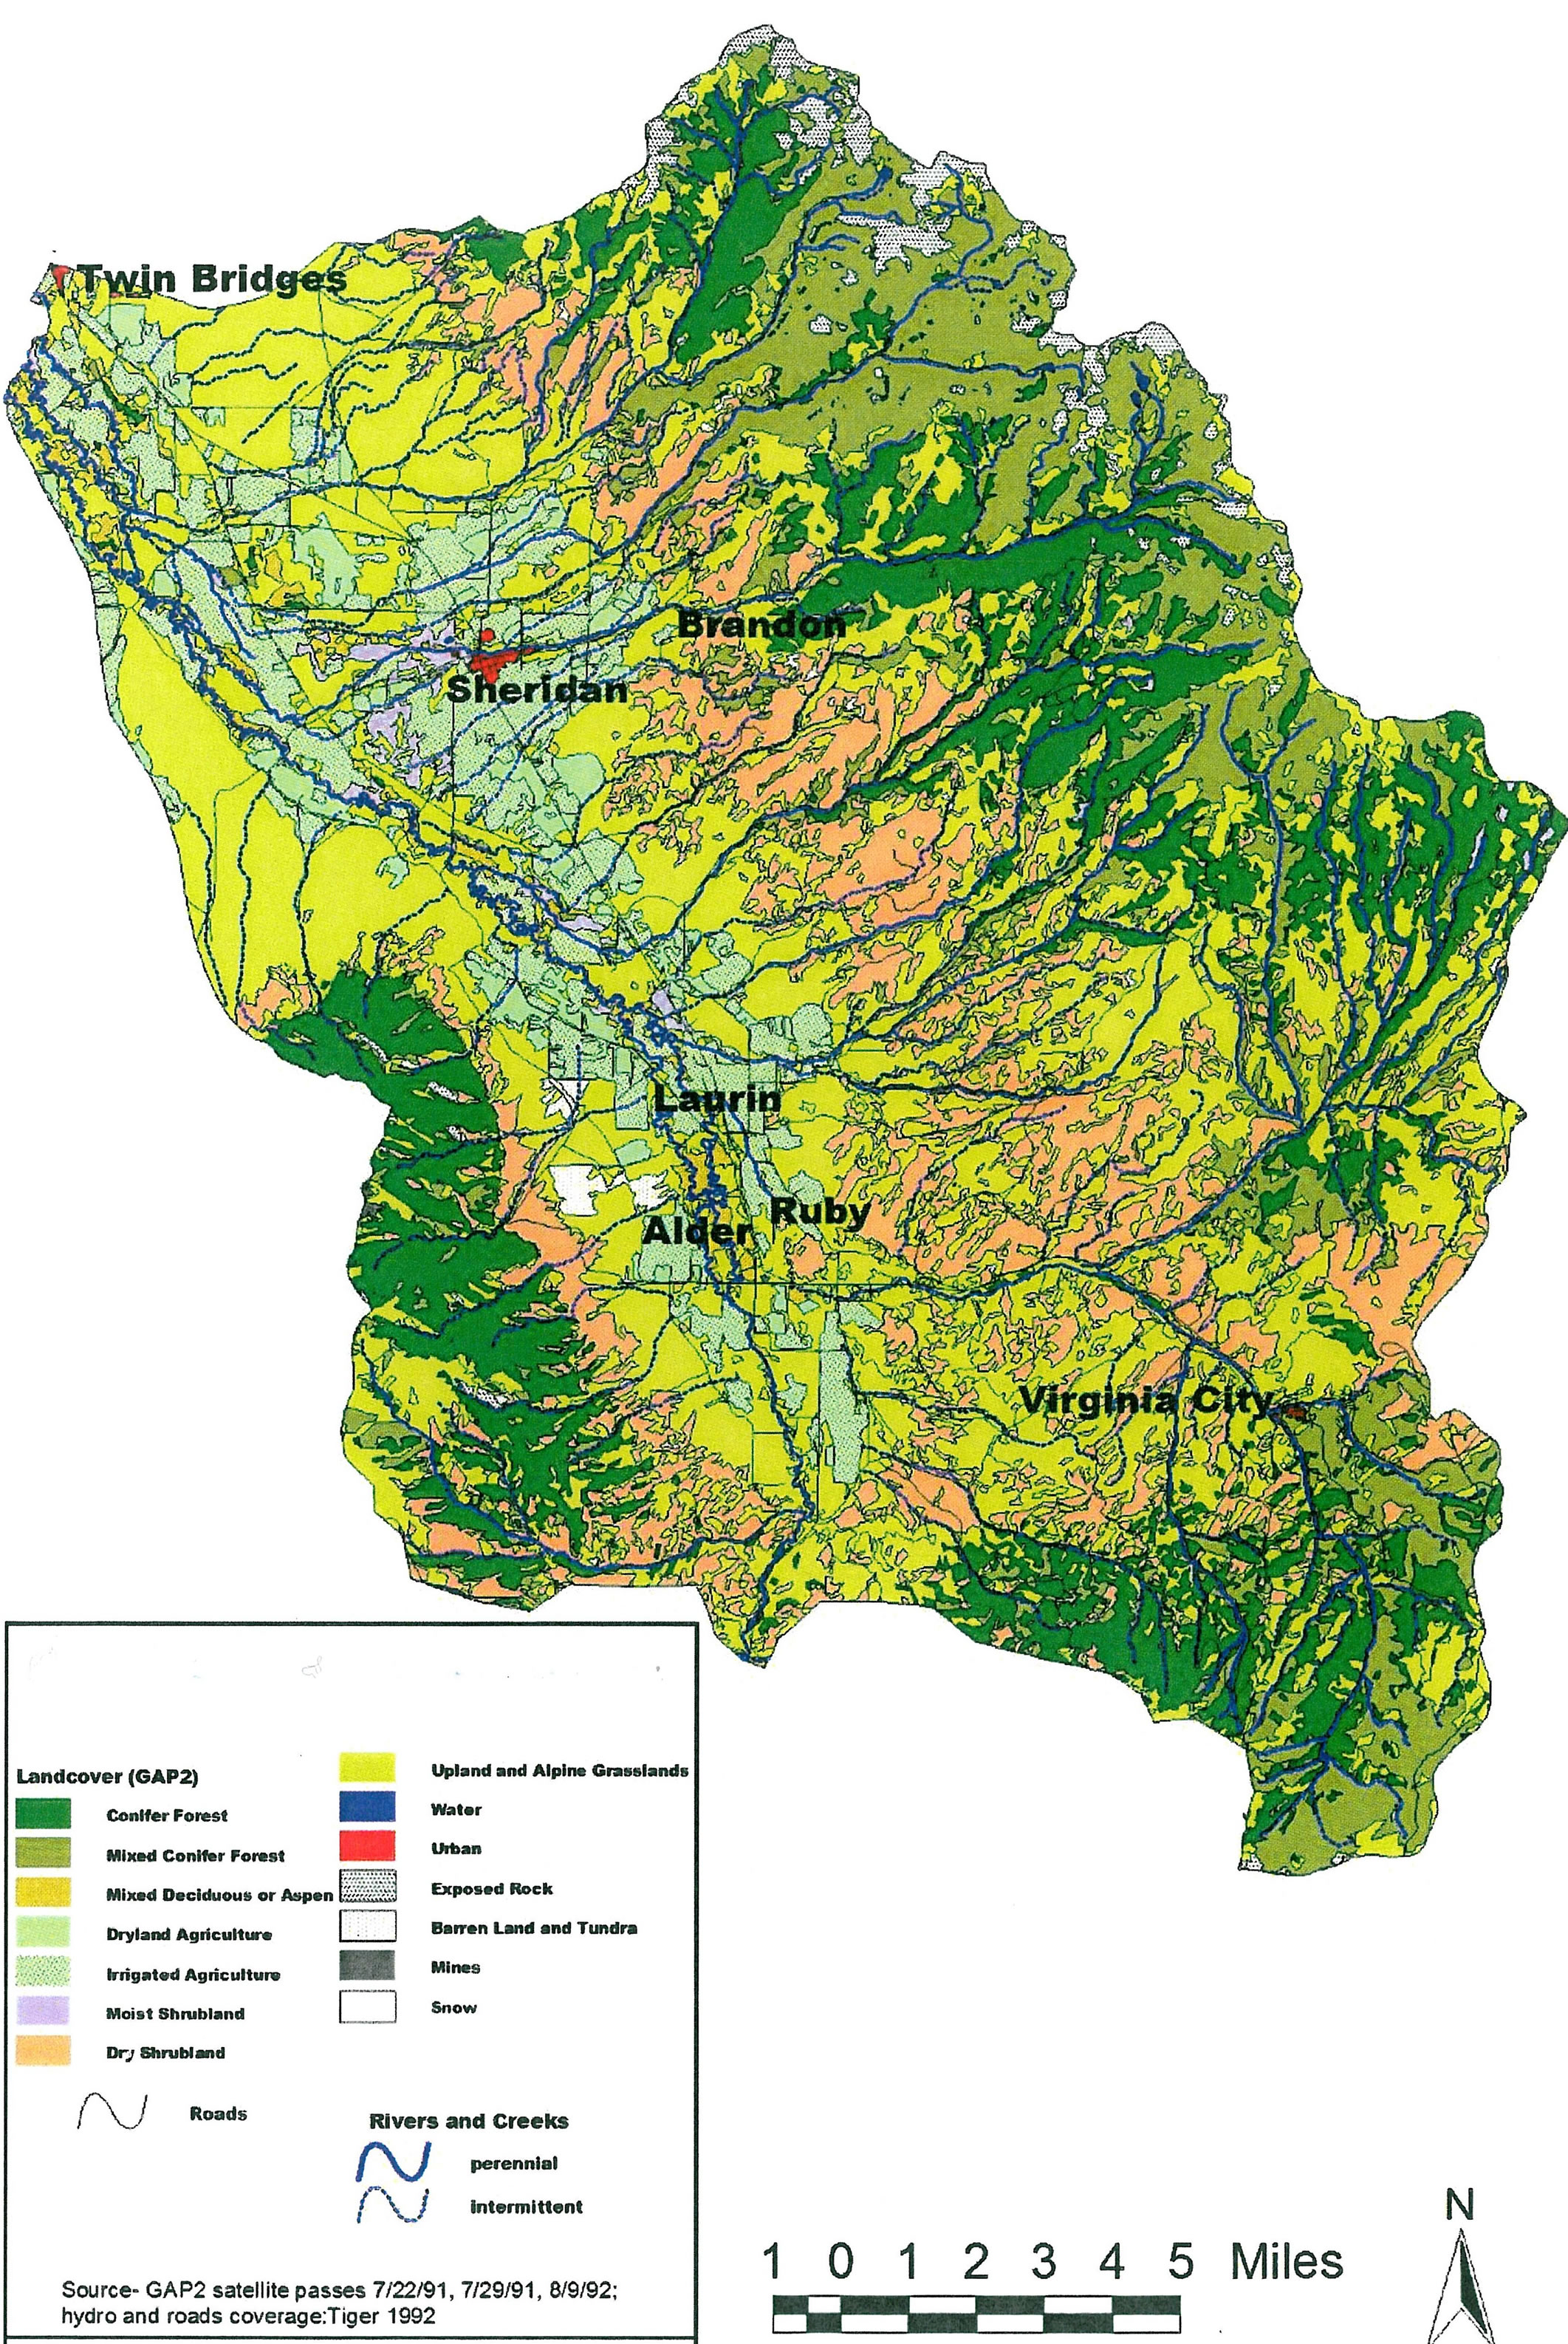
Figure 8. Lower ruby valley land cover.
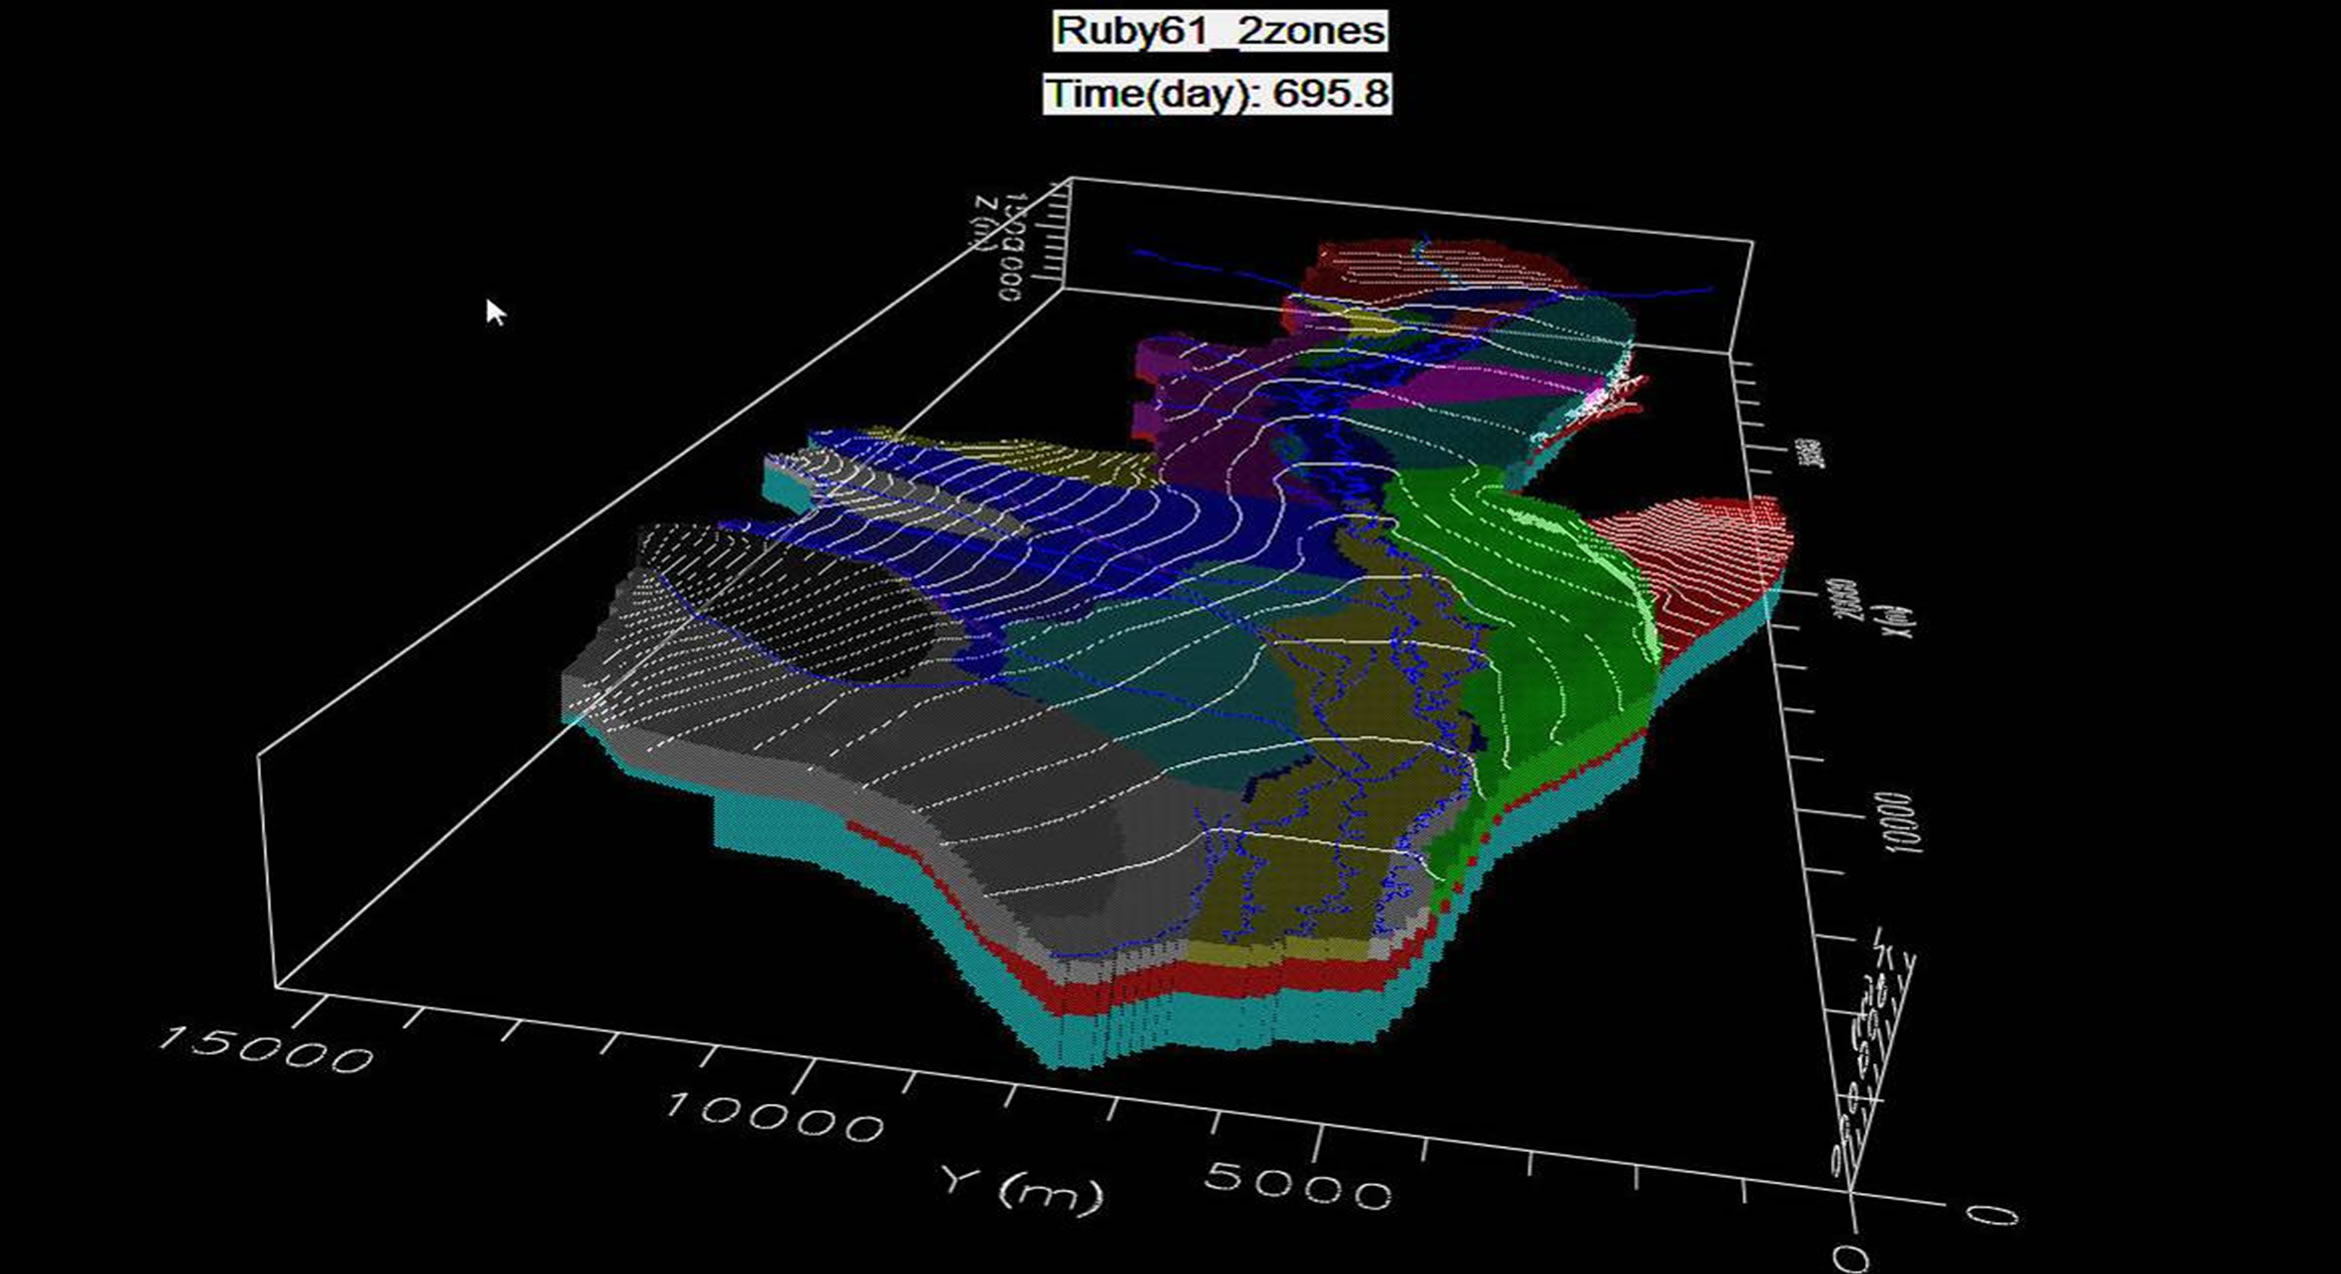
Figure 9. The Lower Ruby Valley groundwater and surface water model. The model grid includes 400 columns and 150 rows of square 100 x 100 meter cells and includes 3 layers. The different colored cells represent hydraulic conductivity (K) zones in the various aquifers, the blue lines are stream and river features simulated in which stream flow is explicitly modeled, and the white lines are the groundwater head equipotential surface with a 50 ft contour interval. The colored K zones in the figure correspond to the K zones and aquifers and is described in further detail in the hydraulic properties section of Magruder and Payne [26].
of aquifers and qualitatively comparing groundwater availability with groundwater use as described by Kreye [30] and Berardinucci and Ronneseth [31]. Four central themes were assessed to identify groundwater quality features including general water quality based on specific conductance, dominant cation-anion chemistry, presence of pollutants, and aquifer vulnerability [32,33]. Groundwater/surface water exchange was assessed by evaluating depth to groundwater, slope of the ground surface compared to the water table, direction and magnitude of vertical hydraulic gradients, synoptic stream flow measurements, and the presence of field indicators of shallow groundwater [34-38].
Mapping-classification results depend upon the desired level of analysis, scale, spatial and temporal data coverage, and budgetary limitations [15]. For the lower Ruby Valley watershed a basin-scale analysis was needed to comprehensively evaluate sources of recharge to valley aquifers and discharge connections to important surface water features. Basin-scale maps were prepared showing aquifer classification results for the shallow and deep aquifer systems. Accompanying the aquifer classification maps are tabular summaries of classification results.
3.4. Numerical Modeling
A Visual MODFLOW (Version 4.2 Waterloo Hydrogeologic, Inc.) model was developed to refine the lower Ruby Valley groundwater basin water balance, provide further understanding of groundwater recharge/discharge and surface water connections, and simulate broad implications of large-scale water management changes within the lower Ruby Valley basin fill sediments. The model simulates transient groundwater flow and the interaction between groundwater and streams, rivers, and irrigation canals and ditches and was parameterized and calibrated to the existing conditions and data available from the period April of 2002 through June of 2003 (Figures 9 and 10). Model scale, parameterization, cali bration, validation, and predictive simulations are described by Magruder and Payne [26]. Model results are used in classifying aquifer flow class potential, capacity vs. productivity, depth to groundwater, and groundwater/surface water connections (Table 1). Modeling is also used in developing the aquifer descriptions provided in the tabular summaries of aquifer classification results.
4. Results
Plates B1 and B2 are large scale maps and summary tables of aquifer classification results for the shallow anddeep aquifer systems that are available for viewing at http://www.kirkenr.com/index_files/ProjectLinks.html. Figure 11 is a close up of Plate B1 for discussion on
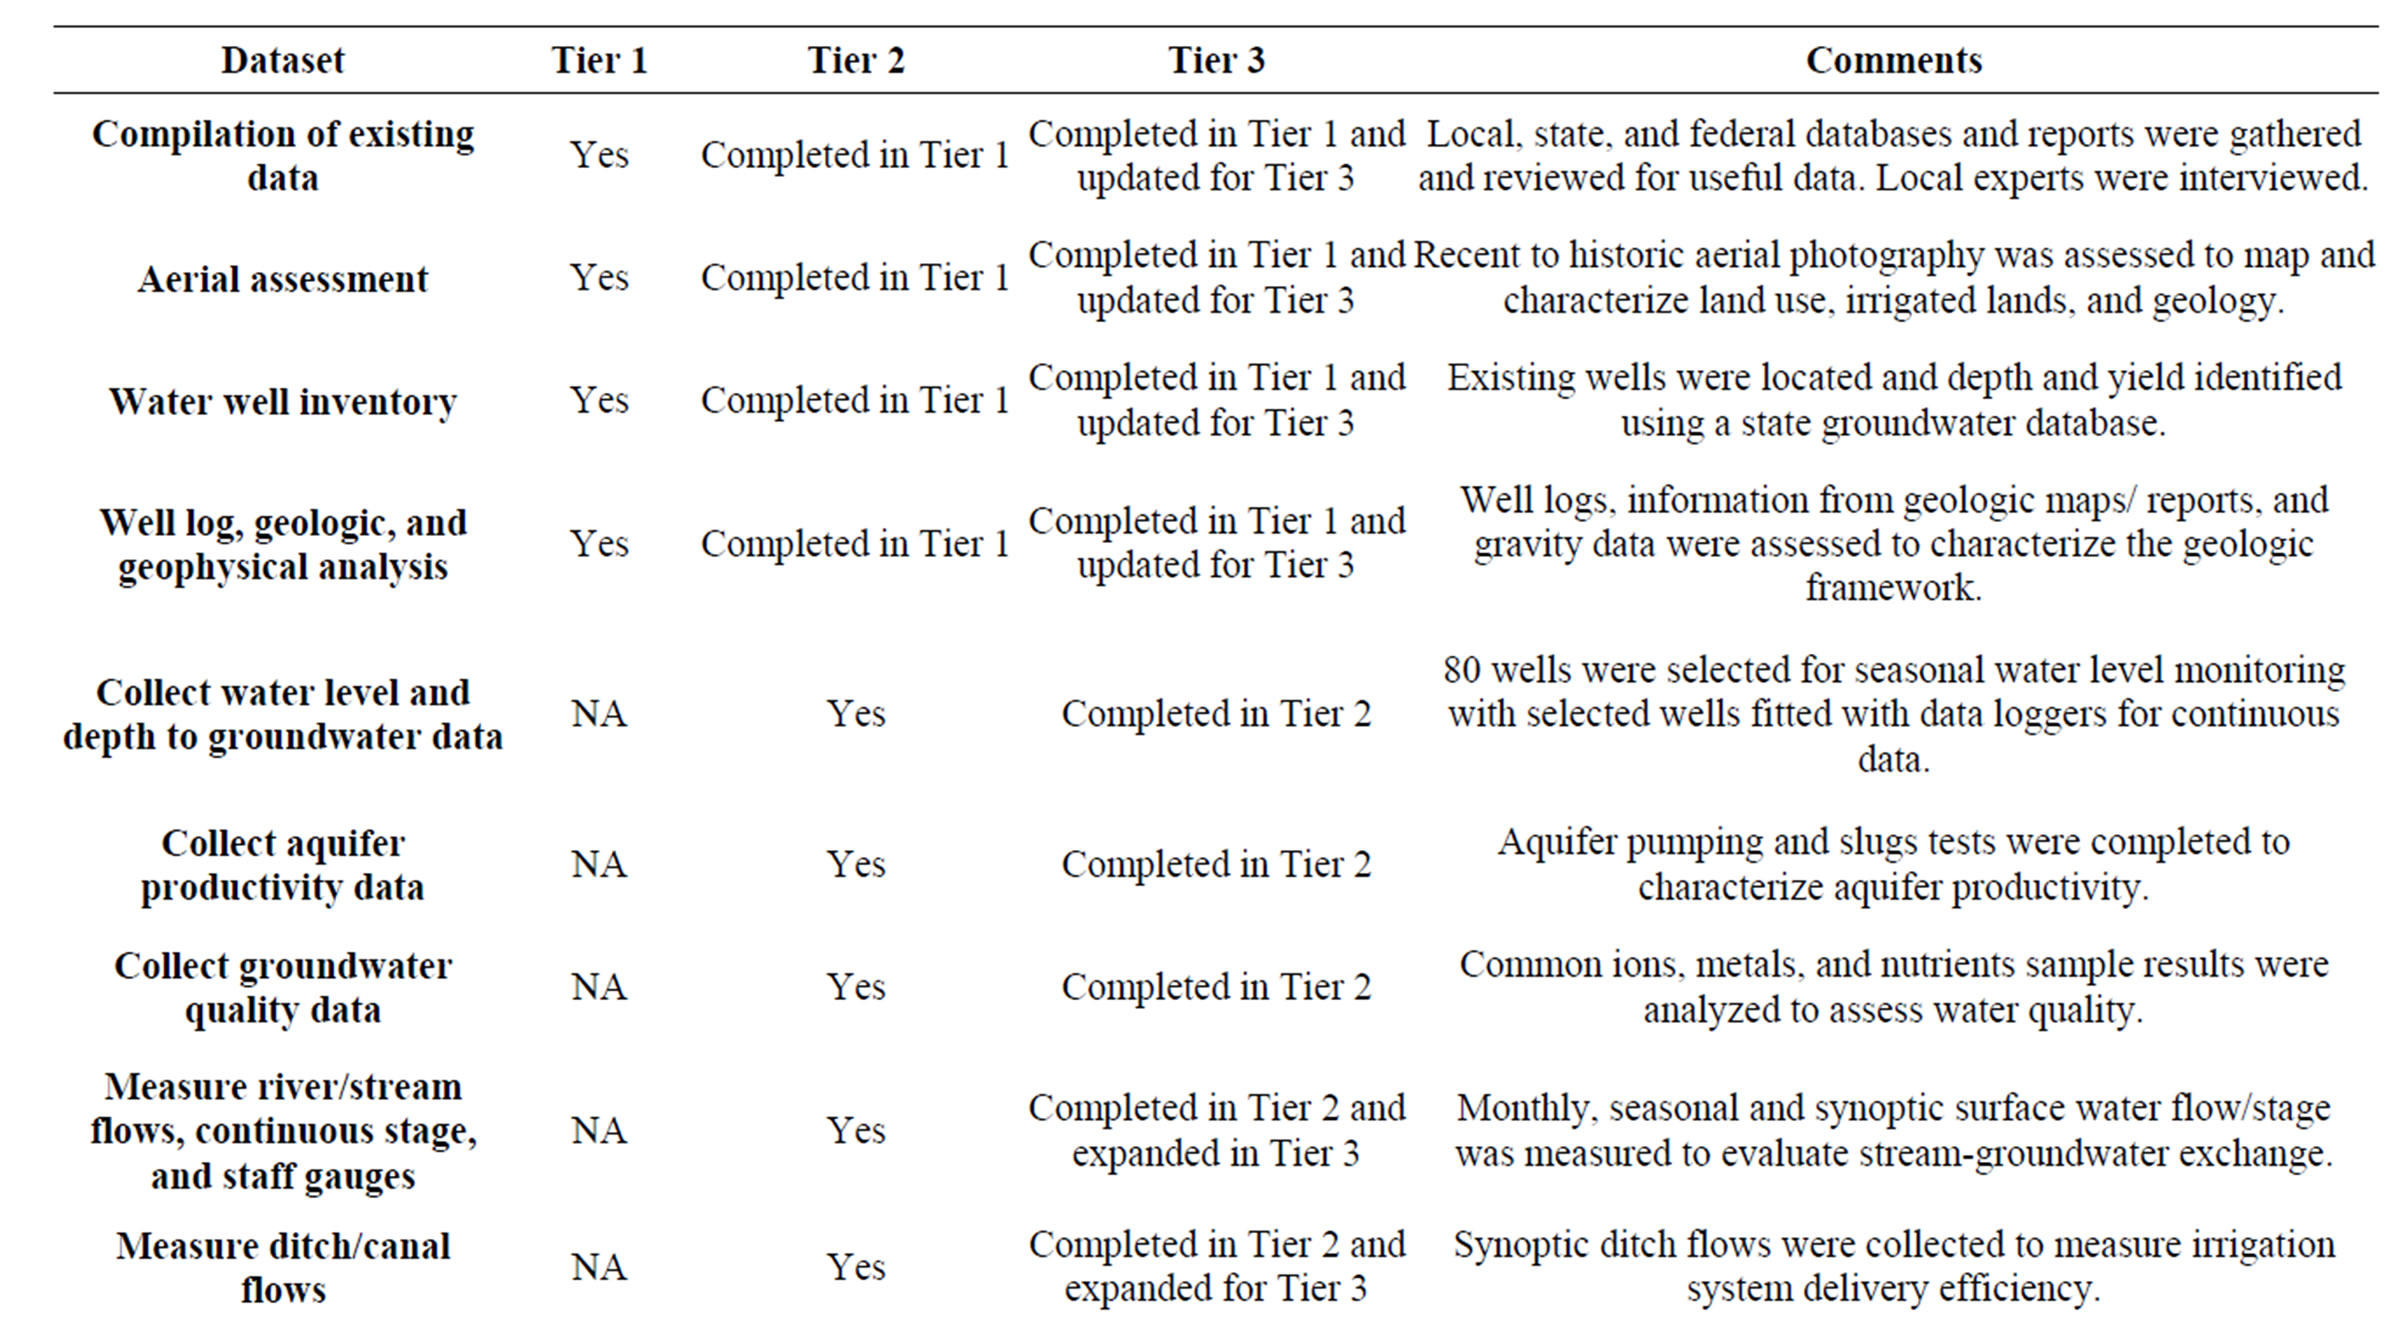
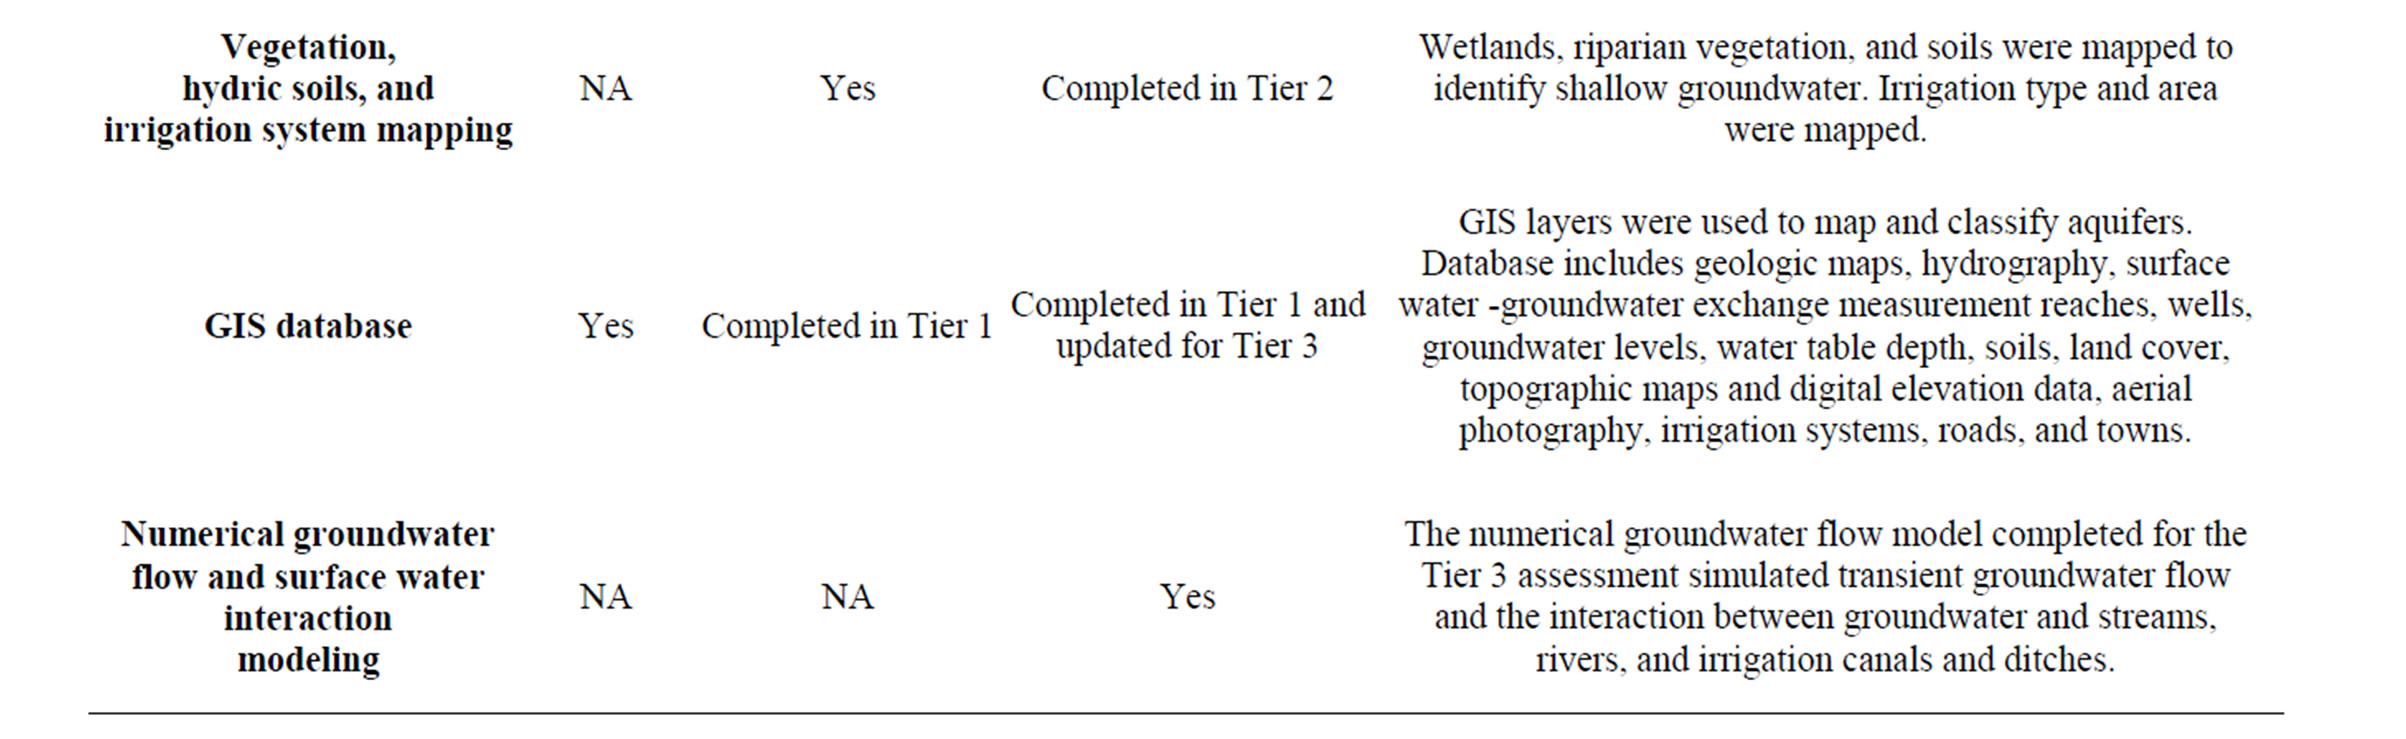
Table 3. Datasets collected for the Tier 1 through 3 assessments lower Ruby Valley groundwater classification. The Tier 1 and 2 assessments were completed in 2004. The Tier 3 assessment was completed in 2008.
aquifer delineation and classification results.
4.1. Shallow Aquifer Classification
The shallow aquifer classification broadly separates aquifer into two categories 1) Quaternary and Tertiary basin fill sediments and 2) bedrock aquifers. The shallow basin fill aquifer is divided into four primary aquifer systems (Quaternary floodplain alluvium, Quaternary landslide deposits, Quaternary alluvial fans, and Tertiary sediments undifferentiated) and eleven aquifers (Ruby Floodplain, Alder Floodplain, Indian Creek Landslide, West Bench-Quaternary alluvial fan, West Bench-Tertiary sediments undifferentiated, Sheridan Fan, East Bench, Greenhorn Tertiary, Mill Creek Tertiary, Tobacco Root Tertiary, and Wet Georgia Tertiary) (Plate B1).
The shallow aquifers are classified into high, intermediate, and low flow potential aquifers (A, B, and C, respectively, as defined in Table 1). Most of the shallow aquifers are classified as intermediate flow class potential (Class B-/B/B+ alluvial fans, floodplain alluvium, and Tertiary sediments) (Figure 11 and Plate B1) capable ofproviding adequate water for individual households and other uses. Larger yield wells, meaning water wells useful to supply irrigation and municipal needs at flow rates much larger than single domestic water wells, can be developed by targeting areas of Class A or Class B flow potential and following design standards for production wells [39]. Tertiary sediments mapped as Class C, low flow class potential, are not likely to produce adequate yields for irrigation use, although tapping the underlying deep aquifer system has produced larger yields
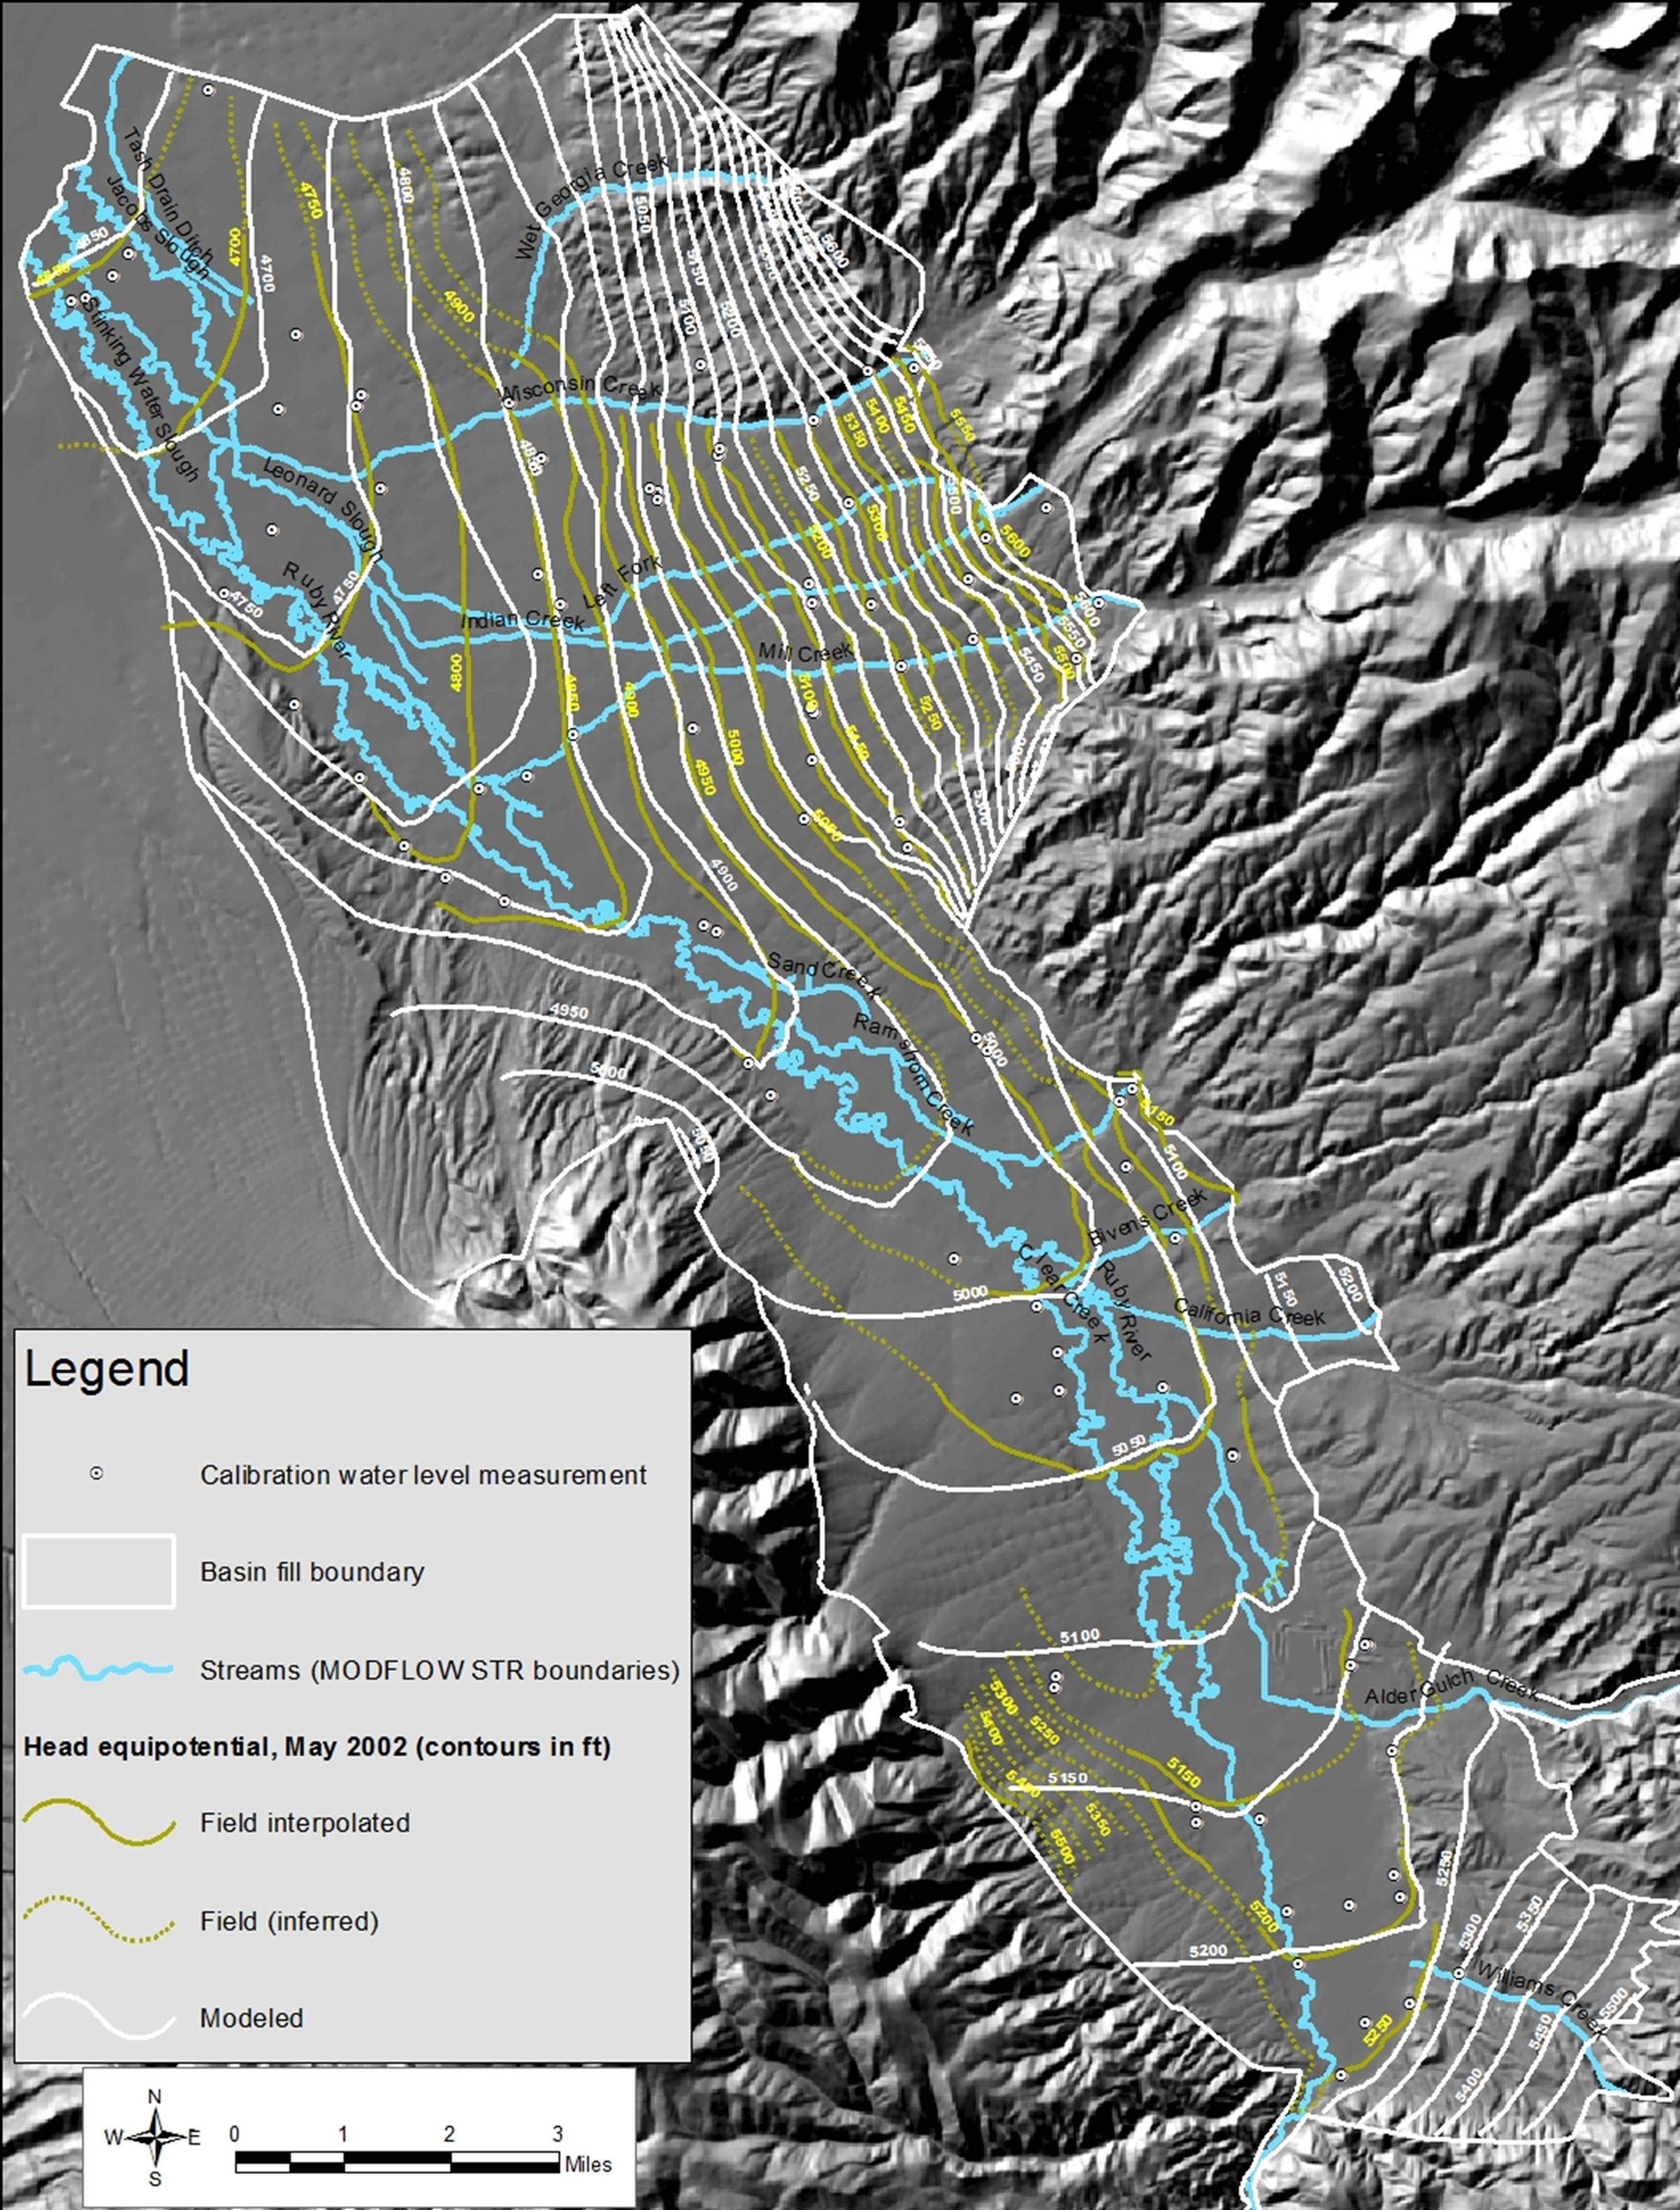
Figure 10. Comparison of modeled and field measured equipotential surface May 2002 Magruder and Payne [19].
Figure 11. Lower Ruby Valley shallow aquifer classification map (from Plate B1). To view the full scale size maps and summary tables download maps at http://www.kirkenr.com/index_files/ProjectLinks.html.
in some cases if the wells are properly located, sufficiently deep, and properly designed to provide flows of more than 500 liters per minute (Plate B2 page 2 Aquifer Description).
Depth to groundwater in the shallow aquifer within the valley is mostly shallow to proximal to the ground surface (2 m to 30 m) to very shallow (<2 m) in the river bottom (Figure 4 and Plate B1) in the valley and greater than 30 m (deep) in valley margin benches and fans. Depth to groundwater is not easily determined in the mountainous area due to limited data. Depths to groundwater and flow directions are inferred based on vegetation surveys, topography, and a limited number of bedrock wells.
Groundwater discharge into the Ruby River and tributary sloughs sustains an important fishery and aquatic life [16]. Discharge to the Ruby River is shown in Figure 11 and Plate B1 at the lower portion of the Ruby Floodplain where the aquifer is classified as D50 (per the classification methodology 25 to 50 percent of base flow is local groundwater discharge) and groundwater is very shallow (<2 m). Groundwater discharge from the Sheridan Fan aquifer maintains stream flows in Leonard Slough and lower Mill Creek where shallow groundwater is mapped D100 and D75 respectively (Table 1 and Figure 11). Irrigation derived groundwater recharge originating from the Sheridan Bench, Tobacco Root Fan, and West Bench aquifers are an important component of basin fill aquifer groundwater which sustains base flow in these surface water features (Plate B1 page 2).
Groundwater is generally good quality (Type 1 Table 1) and is classified predominantly as a calcium bicarbonate type. In the lower reaches of the valley there are a few areas in which magnesium sulfate dominates the water chemistry (Type 2 Table 1). Elevated nitrate concentrations sampled in domestic wells of the East Bench, West Bench, Wet Georgia Tertiary, and bedrock aquifers suggests local-scale septic system or agricultural impacts to groundwater (Figure 11, Plate B1, and Figure 6).
4.2. Deep Aquifer Classification
The deep basin fill aquifer (Plate B2) is delineated as an undifferentiated Tertiary sediment aquifer, water bearing deposits underlying shallow Quaternary sediments. Few irrigation and municipal supply wells penetrate the deep basin fill aquifer as most domestic and agricultural water supply needs are met by developing the shallow aquifer.
Deep aquifer productivity is generally low to moderate and has a generally low hydraulic conductivity (Class C aquifer in Table 1 and mapped in Plate B2). A few high yielding wells have been completed in this aquifer; high yields useful to supply municipal water and irrigation water needs are possible if wells target areas of high flow class potential, are sufficiently deep, and properly designed (Plate B2 map and aquifer description). Groundwater flow direction in the deep aquifer is from topographically higher areas towards to the Ruby River floodplain based on modeling. Depth to groundwater is deep; however, confined conditions in the deep groundwater system can result in the potentiometric head rising above the shallow aquifer water table. Recharge to the aquifer occurs principally from the bedrock groundwater system based on the inferred groundwater flow direction in the mountains and basin groundwater modeling. Modeling indicates deep aquifer discharge is by upward leakage into the Ruby floodplain aquifer and via intra-basin flow to the Jefferson Valley to the north. The calcium bicarbonate dominated water quality of the deep aquifer is good to limited use (as defined in Table 1 and Plate B2).
Bedrock aquifer data is limited and the classification results are mapped as Tier 1 (Table 2). Data are insufficient to determine if there is a difference in the bedrock aquifer properties and conditions with depth. The shallow and deep bedrock are considered one aquifer in this classification.
5. Discussion
The aquifer classification results in Plates B1 and B2 provide valuable, easy to use, and appealing mapping and tabular synthesis of complex technical information in the lower Ruby Valley watershed. In some areas with very limited field data, classification results are inferred (Tier 1) where other areas have supporting data and modeling analysis to support the classification results (Tier 2 and 3). The plates also synthesize watershed-scale groundwater information useful to plan land development and conservation projects. Potential uses include identifying viable groundwater supplies for off-stream water development for livestock and analysis of groundwater supply potential for proposed housing development located away from public water supplies.
The classification methodology was formulated in part to aid local watershed managers and the county planning office personnel that are not formally trained in hydrogeology to understand pertinent groundwater information. Maps and summary tables (Plates B1 and B2) provide structure to important information and serve as stand alone work products or as supplements to the detailed technical reports [16,26]. Conceptually, the classification results are used similarly as geologic maps useful to review housing development, waste water infrastructure development associated with municipalities and subdivisions, and assess various types of water conservation projects led by the government agencies, such as the US Department of Agriculture Natural Resource Conservation Service.
Conceptually as an approach to presenting data, classification results in Plates B1 and B2 provide groundwater professionals a standardized approach for comparing watershed-scale groundwater conditions. For example, groundwater flow class potential (aquifer productivity) for aquifers in the lower Ruby Valley can, with minimal review, be compared to quickly assess potential for water supply development. The classification system can be used to communicate general groundwater conditions such as depth to groundwater and the exchange between groundwater and surface water to projects such as water resource supply assessments or environmental impact assessments. An example would be using the maps and summary tables to compare the availability and depth of groundwater resources for a proposed petroleum pipeline, housing development, or industrial facility. Another example is review of a new irrigation groundwater water right application near the Ruby River and groundwater fed sloughs. Classification results allow groundwater professionals unfamiliar with an area to quickly gain an understanding of watershed groundwater conditions, reference of previous investigations, and identify data gaps if classification results are incomplete.
The use of GIS as the visual and data organization tool underpinning classification results links spatial and descriptive data and provides a digital data organization scheme which can be quickly incorporated into other GIS projects. For example, the groundwater system shown in Plate B1 can be overlain with underground storage tank locations, proposed pipeline routes, or vegetation surveys showing sensitive plant species dependant on shallow groundwater. The tabulated classification results can be included as attributes for each of the primary Ruby aquifers using ArcGIS software and easily shared with other GIS end users. GIS users can select aquifers and link to tabulated summaries of classification results. The GIS layers provide a powerful tool to integrate groundwater resource data into other natural resource planning efforts.
One key requirement for any classification system is that it must be reproducible by trained professionals. Other professionals applying the methodology described in Payne [14] and Payne and Woessner [15] may yield subtle differences in how specific aquifers are mapped, how local planning issues are addressed, and groundwater conditions are summarized. In addition, because the classification results can be at least partially based on modeling results, modeling variations of differing interpretations and experimenting with a range of simulations can also lead to subtle differences in how specific aquifers are mapped. However, the overall classification results should be similar as long as they are completed by trained groundwater professionals [14]. Along this same point, there is uncertainty when complex groundwater and surface water datasets are summarized on one map or developed from limited data coverage. These limitations will give rise to potential differences in mapping and scale-dependent uncertainty, and the information that is included on the maps. The classification maps summarize conditions and may require end users to review the detailed studies to understand groundwater conditions at smaller scales. To aid utility, the final maps were intended to balance the need for clarity, an appropriate scale, and utility. In addition the summary tables are brief to ensure they do not replace detailed studies but reference the detailed studies on Plates B1 and B2 allowing end users to review the datasets as necessary.
6. Conclusion
This case study describes the completion of an aquifer classification analyses in the lower Ruby Valley watershed. It provides an example of the methods, analysis, and data needed to classify aquifers in an intermontane watershed. Classification maps and tabular summaries provide a planning tool and mapping system watershed managers and land use planners can use to broadly and consistently compare physical properties and water quality of aquifers and hydraulic connections to surface water resources. Classification results include GIS layers which can be used to support planning and conservation efforts. Maps and tabular summaries developed for the lower Ruby Valley watershed are useful for supporting natural resource planning, development, stream management, conservation of aquatic resources, and hydrogeologic research.
7. Acknowledgements
Project funding for data collection and modeling were supported through grant funding from the Montana Department of Natural Resources and Conservation, the US Environmental Protection Agency, and Montana Department of Environmental Quality. The grants were awarded to the Ruby Valley Conservation District and Ruby Watershed Council. The authors greatly appreciate and thank the members and leadership of these organizations and the funding agencies.
REFERENCES
- C. Lee, R. T. Watson, M. C. Zinyowera and R. H. Moss, “The Regional Impacts of Climate Change: An Assessment of Vulnerability,” Intergovernmental Panel on Climate Change (IPCC), Cambridge University Press, 1998, 517 pages.
- H. A. Loáiciga, “Climate Change Impacts in RegionalScale Aquifers: Principlesand Field Application,” In: K. Sato and Y. Iwasa, Eds., Groundwater Updates, Springer, Tokyo, 2000, pp. 247-252. doi:10.1007/978-4-431-68442-8_41
- US Environmental Protection Agency, “Water Resources Impacts and Adaptation.” http://www.epa.gov/climatechange/impacts-adaptation/water.html
- W. M. Alley, R. W. Healy, J. W. La Baugh and T. E. Reilly, “Flow and Storage in Groundwater Systems,” Science, Vol. 296, No. 5575, 2002, pp. 1985-1990. doi:10.1126/science.1067123
- C. G. Daughton, “Groundwater Recharge and Chemical Contaminants: Challenges in Communicating the Connections and Collisions of Two Disparate Worlds,” Ground Water Monitoring & Remediation, Vol. 24, No. 2, 2004, pp. 127-138. doi:10.1111/j.1745-6592.2004.tb00721.x
- W. A. Jury and H. Vaux Jr., “The Role of Science in Solving the World’s Emerging Water Problems,” Proceedings of the National Academy of Sciences, Vol. 102, No. 44, 2005, pp. 15715-15720. doi:10.1073/pnas.0506467102
- C. B. Field, L. D. Mortsch, M. Brklacich, D. L. Forbes, P. Kovacs, J. A. Patz, S. W. Running and M. J. Scott, “North America. Climate Change 2007: Impacts, Adaptation and Vulnerability,” In: M. L. Parry, O. F. Canziani, J. P. Palutikof, P. J. van der Linden and C. E. Hanson, Eds., Contribution of Working Group II to the Fourth Assessment Report of the Intergovernmental Panel on Climate Change, Cambridge University Press, Cambridge, 2007, pp. 617- 652.
- E. Kendy, “The False Promise of Sustainable Pumping Rates-Technical Commentary for Groundwater,” Groundwater, Vol. 41, No. 1, 2003, pp. 2-4. doi:10.1111/j.1745-6584.2003.tb02559.x
- Z. W. Kundzewicz, L. J. Mata, N. W. Arnell, P. Döll, P. Kabat, B. Jiménez, K. A. Miller, T. Oki, Z. Sen and I. A. Shiklomanov, “Freshwater Resources and Their Management,” In: M. L. Parry, O. F. Canziani, J. P. Palutikof, P. J. van der Linden and C. E. Hanson, Eds., Climate Change 2007. Impacts, Adaptation and Vulnerability, Contribution of Working Group II to the Fourth Assessment Report of the Intergovernmental Panel on Climate Change, Cambridge University Press, Cambridge, 2007, pp. 173-210.
- S. B. van de Wetering, “Bridging the Goverance Gap: Strategies to Integrate Water and Land Use Planning,” Public Policy Research Institute, University of Montana, Missoula, 2007, 15 pages.
- R. Nelson, “Uncommon Innovation: Developments in Groundwater Management in California,” Working in the West Working Paper 1, Woods Institute for the Environment, The Bill Lane Center for the American West, Stanford University, 2011, p. 38.
- S. L. Yaffee, A. F. Phillips, I. C. Frentz, P. W. Hardy, S. M. Maleki and B. E. Thorpe, “Ecosystem Management in the United States: An Assessment of Current Experience,” Island Press, Washington DC, 1996, 351 pages.
- M. E. Covert, “A Call for Uniform Groundwater Classification. Environmental Protection,” 2010. http://eponline.com/articles/2010/01/14/a-call-for-uniformgroundwater-classification.aspx
- S. M. Payne, “Classification of Aquifers,” PhD Dissertation, University of Montana, 2010. http://www.kirkenr.com/index_files/ProjectLinks.html
- S. M. Payne and W. W. Woessner, “An Aquifer Classification System and GIS-based Analysis Tool for Watershed Managers in the Western US,” Journal of American Water Resources, Vol. 46, No. 5, 2010, pp. 1003-1023.
- S. M. Payne and I. A. Magruder, “Lower Ruby Valley Groundwater Management Plan and Water Resource Data Report, Volume I and II,” Ruby Valley Conservation District, KirK Environmental, LLC Sheridan, 2004, 45 pages.
- D. E. Prudic and M. E. Herman, “Ground-Water Flow and Simulated Effects of Development in Paradise Valley, a Basin Tributary to the Humboldt River, in Humboldt County, Nevada,” US Geological Survey, Denver, Professional Paper 1409-F, 1996.
- T. G. Rowe and K. K. Allender, “Surfaceand Groundwater Characteristics in the Upper Truckee River and Trout Creek Watersheds, South Lake Tahoe, California and Nevada, July-December 1996,” Water Resources Investigations Report 00-4001, USGS, Denver, 2000, 39 pages.
- C. E. Thodal, “Hydrogeology of the Lake Tahoe Basin California and Nevada, and Results of a Ground-water Quality Monitoring Network, Water Years 1990-92,” Water Resources Investigations Report 97-4072, USGS, Denver, 1997, 53 pages.
- J. Gibert, “Groundwater Systems and Their Boundaries; Conceptual Framework and Prospects in Groundwater Ecology,” Verhandlungen des Internationalen Verein Limnologie, Vol. 24, 1991, pp. 1605-1608.
- USGS, “Geologic Provinces of the United States: Basin and Range Province in Geologogy of National Parks,” 2004. http://geomaps.wr.usgs.gov/parks/province/basinrange.html
- E. T. Ruppel, J. M. O’Neill and D. A. Lopez, “Geologic Map of the Dillon 1 Degree by 2 Degree Quadrangle, Idaho and Montana,” USGS Miscellaneous Investigations Series Map I-1803-H, 1993. http://greenwood.cr.usgs.gov/pub/i-maps/i-1803-h
- Oregon Climate Service, “Montana Average Annual Precipitation, 1961-1990,” Oregon State University Corvallis, Oregon, 1998.
- WRCC, “1981-2010 NCDC Monthly Normals for Twin Bridges, MT, COOP ID 248430,” Western Regional Climate Center, 2012. http://www.wrcc.dri.edu/cgi-bin/cliMAIN.pl?mt8430
- I. A. Magruder, W. W. Woessner and S. W. Running, “Ecohydrologic Process Modeling of Mountain Block Groundwater Recharge,” Ground Water, Vol. 47, No. 6, 2008, pp. 774-785. doi:10.1111/j.1745-6584.2009.00615.x
- I. A. Magruder and S. M. Payne, “Ruby Groundwater/ Surface Water Interaction Modeling Project Report,” KirK Engineering & Natural Resources, Inc. Sheridan, 2008, 80 pages. http://www.kirkenr.com/index_files/ProjectLinks.html
- N. G. Vereiskii and E. A. Vostokova, “Guidebook for Determining the Lithological Composition of Surface Deposits and Depth of Occurance of Ground Waters,” State Geological Committee of the USSR, 1966, 247 pages.
- G. B. Maxey, “Hydrostratigraphic Units,” Journal of Hydrology, Vol. 2, No. 2, 1964, pp. 124-129. doi:10.1016/0022-1694(64)90023-X
- P. A. Domenico, “Concepts and Models in Groundwater Hydrology,” MaGraw-Hill, New York, 1972, 403 pages.
- R. Kreye, K. Ronneseth and M. Wei, “An Aquifer Classification System for Groundwater Management in British Columbia,” Ministry of Environment, Lands and Parks Water Management Division, Hydrology Branch, 1998. http://www.env.gov.bc.ca/wsd/plan_protect_sustain/groundwater/aquifers/Aq_Classification/Aq_Class.html
- J. Berardinucci and K. Ronneseth, “Guide to Using the BC Aquifer Classification Maps,” Ministry of Water, Land and Air Protection, 2002, p. 54.
- L. Aller, T. Bennett, J. Lehr, R. Petty and G. Hackett, “DRASTIC: A Standardized System for Evaluating Groundwater Pollution Potential Using Hydrogeologic Setting,” EPA/600/2-87/035, 1987, 622 pages.
- R. A. Freeze and J. A. Cherry, “Groundwater,” PrenticeHall, New Jersey, 1979, 397 pages.
- T. C. Winter, J. W. Harvey, O. L. Frankie and W. M. Alley, “Ground Water and Surface Water: A Single Resource,” USGS Circular 1139, 1998, pp. 1-53.
- T. C. Winter, “Relation of Streams, Lakes, and Wetlands to Groundwater Flow Systems,” Hydrogeology Journal, Vol. 7, No. 1, 1999, pp. 28-45. doi:10.1007/s100400050178
- D. Eamus and R. Froend, “Groundwater-Dependent Ecosystems: The Where, What and Why of GDEs,” Australian Journal of Botany, Vol. 54, 2006, pp. 91-96. doi:10.1071/BT06029
- M. Hayashi and D. O. Rosenberry, “Effects of Ground Water Exchange on the Hydrology and Ecology of Surface Water,” Ground Water, Vol. 40, No. 3, 2002, pp. 309-316. doi:10.1111/j.1745-6584.2002.tb02659.x
- P. J. Hancock, A. J. Boulton and W. F. Humphreys, “Aquifers and Hyporheic Zones: Towards an Ecological Understanding of Groundwater,” Hydrogeology Journal, Vol. 13, No. 1, 2005, pp. 98-111. doi:10.1007/s10040-004-0421-6
- F. G. Driscoll, “Groundwater and Wells,” 2nd Edition, Johnson Division, St Paul, 1986, p. 1089.
NOTES
*Corresponding author.