Journal of Water Resource and Protection
Vol.5 No.11(2013), Article ID:40064,9 pages DOI:10.4236/jwarp.2013.511107
Semiconductor Wastewater Treatment Using Tapioca Starch as a Natural Coagulant
1School of Civil Engineering, Universiti Sains Malaysia, Engineering Campus, Seri Ampangan, Pulau Pinang, Malaysia
2Environmental Technology Division, School of Industrial Technology, Universiti Sains Malaysia, Pulau Pinang, Malaysia
Email: fatehahomar@yahoo.com
Copyright © 2013 Mohd Omar Fatehah et al. This is an open access article distributed under the Creative Commons Attribution License, which permits unrestricted use, distribution, and reproduction in any medium, provided the original work is properly cited.
Received February 10, 2013; revised March 12, 2013; accepted April 15, 2013
Keywords: Chemical Oxygen Demand; Natural Coagulant; Response Surface Methodology; Semiconductor; Tapioca; Turbidity
ABSTRACT
The efficiency of using tapioca starch as a natural coagulant on semiconductor wastewater treatment was investigated. The silica content in the wastewater was pH dependent and it was found that the reduction of COD and turbidity occurred at pH between 12 and 14 with measurements below 100 mg/L and 100 NTU respectively. A three-level factorial design experiment in the Response Surface Methodology (RSM) was applied to determine the influence of retention time and dosage of the tapioca starch. The parameters studied were chemical oxygen demand (COD), turbidity and total suspended solids (TSS). The R2 for turbidity, COD and TSS were 0.92, 0.92 and 0.77 respectively. Results indicate that the dosage of the tapioca starch has a higher influence on COD and turbidity reduction. Tapioca starch as a natural coagulant has shown that the optimum turbidity reduction was 99% at a settling time of 30 minutes with dosage of 0.1 g/L. The COD reduction was achieved at 87% after 60 min of retention time and 0.1 g/L of dosage while higher coagulant dosages reduced the TSS concentration to 10.9 mg/L at retention time between 50 to 60 minutes.
1. Introduction
The semiconductor industry has emerged as one of the very important industries in Malaysia as well as in other countries [1-3]. Based on the Investment Performance Report in 2012 by the Malaysian Investment Development Authority (MIDA), the semiconductor sector has become one of the top eight new and emerging technologies in the manufacturing industries [4]. The semiconductor operation could account for as much as 40% of ultrapure water consumption in many highly complex and delicate processes that are involved in the factory [5,6]. This, in consequence, will generate equally large quantities of semiconductor wastewater from the final stage of washing and cleaning the wafer in the post-semiconductor processes.
Semiconductor wastewater is characterized as strongly dark in color, highly turbid, with high chemical oxygen demand (COD) concentration, low biodegradability, various solvents, acids, bases, salts, fine oxide particles and may contain the presence of inorganic and organic contaminants. In general, inorganic contaminants may include suspended solids (in the range of nanometers to micrometers of SiO2, Al2O3 or CeO2 with concentrations ranging from 50 to 500 mg/L whereas organic contaminants may include metal complexing agents, surfactants, stabilizers and rheology control agents [7-9]). Further detailed properties of semiconductor wastewater have been mentioned elsewhere [9-12]. Due to these characteristics, this low biodegradable wastewater can pose a considerable strain on the activated sludge in the biological wastewater treatment system and is not easily treatable with a single treatment approach [7,13].
Different treatment methods i.e. electrocoagulation [5, 9,14], air flotation [2,15], anaerobic degradation [6] have been applied to treat semiconductor wastewater. Other treatment such as membrane separation requires pre-coagulation because of the high concentration of Si in wastewater that can foul up the membrane and substantially shorten its lifespan [16]. Chemical coagulation either inorganic (e.g. aluminum sulfate and polyaluminium chloride) or PAC, synthetic organic polymers (e.g. polyacrylamide derivatives) were also used to treat semiconductor wastewater [7,10,13,17,18]. Though other environmental friendly treatments have been applied to treat semiconductor wastewater [9], to the best of our knowledge, few studies on the application of natural coagulants as a substitute to inorganic chemical coagulants for the same purpose have been tried i.e. sago and potato starch [11]. However, other studies have reported on using natural materials as coagulants including Moringa oleifera [19- 23], Nirmali seed and maize [24,25], mesquite bean and Cactus latifaria [26,27], Cassia angustifolia seed [28] and different leguminose species [29,30] to treat drinking water and wastewater generated from palm oil mill effluent (POME), paper mill, dyes and textiles. Natural coagulants have several advantages as they are available in abundance, cost-effective, environmental friendly, and biodegradable in nature [31].
In this study, subsequent to our previous studies [11, 32], we have applied tapioca starch as a natural coagulant to treat semiconductor wastewater. The objective was to investigate the effectiveness of tapioca starch as a natural coagulant to remove COD, turbidity and total suspended solids (TSS). The effects of the settling time were also investigated.
2. Materials and Methods
2.1. Coagulation Jar Test
The semiconductor wastewater was collected from a multinational semiconductor plant located in Bayan Lepas Industrial Zone, Penang, Malaysia. The samples collected were labeled and stored at 4˚C for preservation. COD, TSS, pH and turbidity of the semiconductor wastewater were measured. The COD was determined using the spectrophotometer (Model-HACH, DR/2010) while turbidity (in terms of NTU) was determined using the turbidimeter (HACH-2100P). The TSS was calculated according to section 2540A and section 2540D [33]. The structure of silica particles in the semiconductor wastewater was observed at different magnifications using scanning electron microscope (SEM) image and energy dispersed X-ray spectrum (Model-JOEL).
The wastewater were adjusted to different pHs using the pH meter Model HACH sensION. Analytical grade NaOH pellets and HCl were used for pH adjustment. At each adjusted pH, the wastewater was allowed to settle over a period of 225 minutes where aliquots of the aqueous solution were extracted for COD, TSS and turbidity measured. Coagulation investigation was conducted using a jar test apparatus (JLT6, VELP, SCIENTIFICA) consisting of six 500 mL glass jars. Each jar was equipped with a stirrer to rotate between 10 and 300 rpm. Tapioca flour was employed as the natural coagulant in the jar test. Five hundred milliliters of the raw silica wastewater were poured in each jar and the pH was adjusted to pH 12. The desired amount of coagulant was added with reference to the design of experiment in the response surface methodology (RSM). Then, the stirrer was turned on and set at 100 rpm with a mixing time of 5 minutes. The stirrer speed was then slowed to 10 rpm and continued mixing for another 15 minutes. The treated silica wastewater was finally allowed to settle according to the RSM design of experiment. Aliquots of the supernatant were extracted for COD, TSS and turbidity analysis.
2.2. Response Surface Methodology
A Three Level Factorial design in the RSM software was applied in the jar test coagulation study. In this study, the variables selected were retention time (minutes) as X1 and dosage of coagulants (g/L) as X2. The responses observed were turbidity, COD and TSS. A second degree quadratic polynomial equation was used in Equation (1):
 (1)
(1)
where, Y is the predicted response, B is the linear coefficient, X1 and X2 are input variables (viz., settling time and dosage). The low, middle and high levels of each variable, namely settling time and dosage, were coded as −1, 0, +1 respectively and given in Table 1. Based on Equation (1), a total of 13 runs were necessary in order to optimize the COD and turbidity removal that involved two independent variables, viz., settling time and dosage. The design experiments were carried out using the software Design Expert (Courtesy: Stat-Ease Inc., Statistics Made Easy, Minneapolis, MN, USA. Version 6.0.10.2003).
3. Results and Discussion
3.1. Semiconductor Wastewater Characterization
Table 2 presents the semiconductor wastewater characteristics. The parameters determined were pH, temperature, total solids (TS), COD, TSS and turbidity.
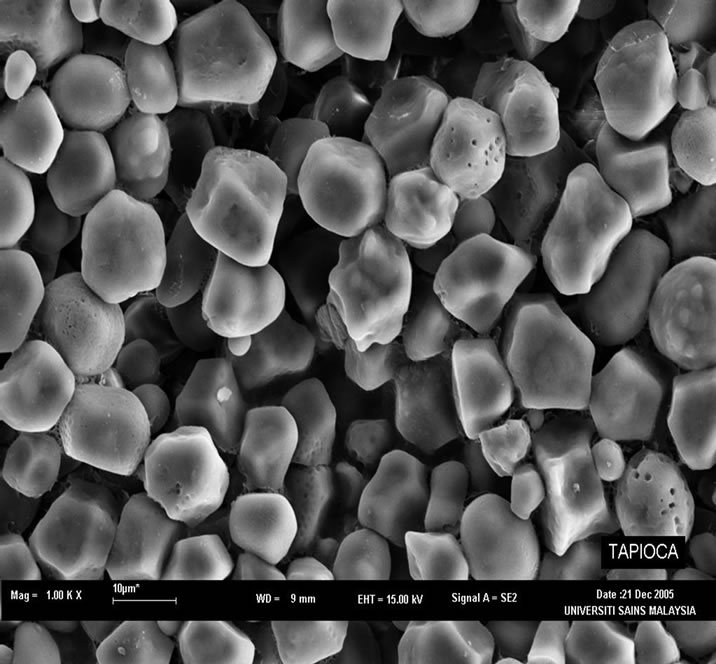
The pH and turbidity values of the semiconductor wastewater were found to be pH 5.1 and 4246 NTU respectively whereas the COD and TSS concentrations were found at 1752 mg/L and 188 mg/L respectively, higher than the standard limits (100 mg/L) set by the Environmental Quality Act, 1974, Malaysia [34]. This generally reflects that the semiconductor wastewater contains contaminants in the waste slurry and small particulates such as suspensions of fine oxides (SiO2, Al2O3, or CeO2) and oxidizing agents (such as HNO3, Fe(NO3)3, etc.) from the wafer surface. Figure 1(a) shows the structure of the silica particles in the semi
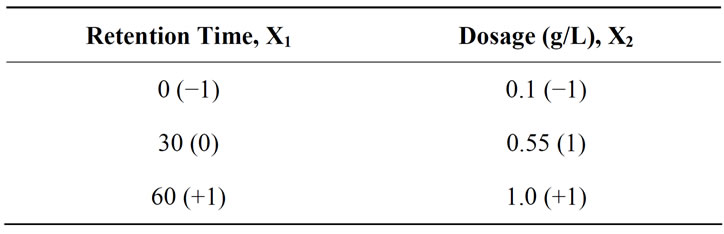
Table 1. The level of variables chosen for factorial design of analysis.
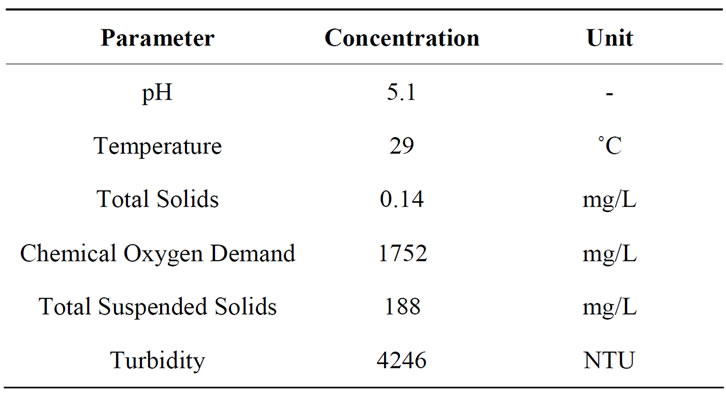
Table 2. Characterization of semiconductor wastewater.
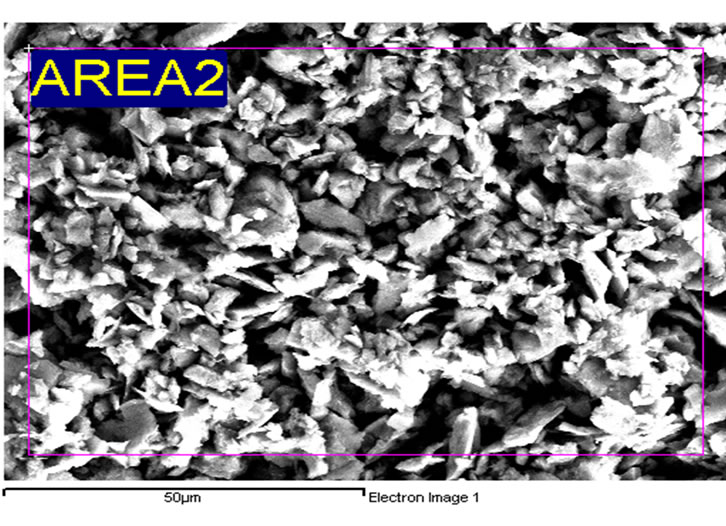
conductor wastewater in the form of geometrical crystals. It was observed that the silica particles were stable and remained in suspension and dispersed like colloidal silica with a size distribution between 1 to 500 nm. Figure 1(b) displays the EDX spectrum band of the elemental composition of silica particles. From the spectrum band, it was determined that the particles were silicon dioxide (silica, SiO2).
3.2. pH Effect on COD and Turbidity Reduction
Figure 2 represents the values of turbidity and COD at different pHs within the full pH range of 1 to 14 after one hour of settling time. The initial values of COD and turbidity at unadjusted pH were 1700 mg/L and 3800 NTU respectively. With reference to the z-axis that represents turbidity values, it was found that the turbidity concentration reduced when the pH was adjusted to both acidic and alkali conditions. The highest reduction was observed at 97% when the pH was between 12 and 14. At pH 10, the turbidity was about 100 NTU with a 73% reduction. For pH values between 3 and 9, the reduction of turbidity was insignificant. The reduction of turbidity might be due to the silica solubility which is observed to be highly influenced by pH. As the silica solubility increases, the turbidity of the wastewater decreases. Generally, silica forms Si(OH)4 due to the dissolution with water. At lower pH levels between 1 and 3, the turbidity reduction could be due to the reaction of Si(OH)4 with acid.
As the pH increases, the degree of ionization of Si(OH)4 decreases, hence silica solubility decreases. However, the formation of silicate ion in addition to Si(OH)4 in solution at higher pH regions (≥10) enhances
 (a)
(a)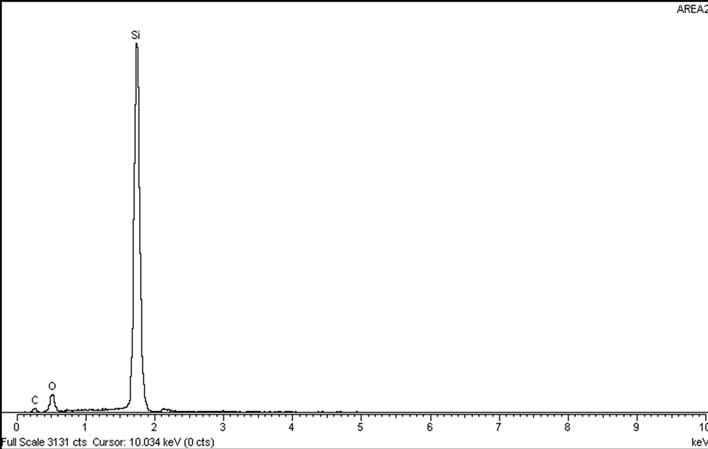 (b)
(b)
Figure 1. (a) SEM image of silica particles and (b) Energy dispersive X-ray (EDX) spectrum in raw semiconductor wastewater. It was observed that the silica particles were in the form of geometrical crystals which remained in suspension and dispersed.
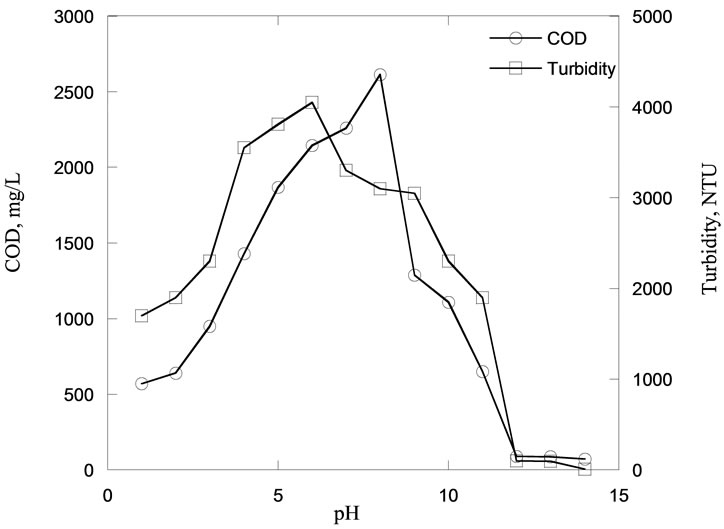
Figure 2. COD and turbidity concentration profiles with a function of pH within 1 hour of settling time.
the silica solubility, which significantly reduces the turbidity of wastewater [35].
On the y-axis that represents the COD concentration, it was found to decrease at higher acidic and alkaline conditions, at ranges of pH 1 - 3 and pH 12 - 14, respectively. At pH 1, the COD concentration was about 570 mg/L. It was observed that COD concentration increased with increasing inducing pH of the semiconductor wastewater up to pH 8. The reduction of COD concentration might be due to the silica solubility in semiconductor wastewater, as the silica solubility increased, the COD concentration decreased in the semiconductor wastewater. It was observed during the pH adjustment that the fine suspended silica particles seemed to dissolve and disappear at higher alkaline pH region. It is reported that the silica solubility in the semiconductor wastewater increases proportionately with increasing the alkaline pH [35]. However, COD concentration was found higher compared to initial COD concentration of semiconductor wastewater, which could be due to the release of the outer layer of the silica particles which remained as unsettleable particles into the solution.
In Figure 3, the reduction of COD concentration was observed within a pH range of 1 and 4 at different retention times. For pH 1 and 2, it was observed that the COD concentrations reduced to about 600 and 700 mg/L almost instantly at minute-0, respectively. At the same pHs, with longer retention of 200 minutes, the lowest COD concentration of about 200 mg/L was obtained. In the case of pH 3 and 4, the COD concentration decreased to about 900 and 1400 mg/L at minute-0, respectively. In compare to the pH ranges above, pH 12 was finally determined as the optimum pH for further investigation.
3.3. Removal of COD, Turbidity and TSS with Tapioca Starch
Figure 4(a) shows the SEM image of the wastewater sludge from tapioca starch. The tapioca starches are made of spherical granules, having a 5 to 35 µm diameter, compact with small spaces between the particles. This is
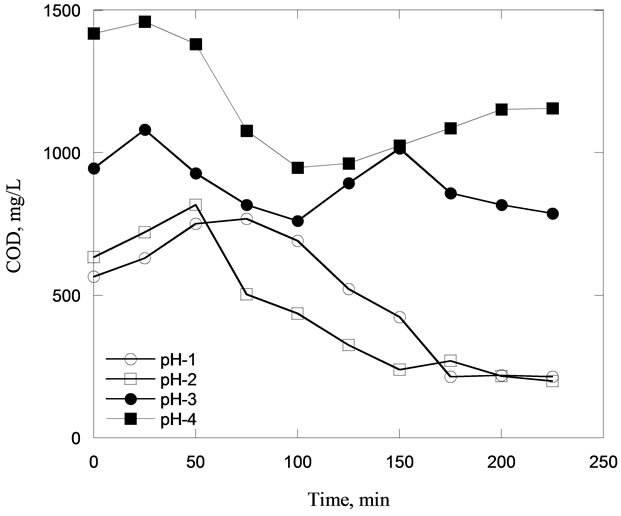
Figure 3. COD profile concentration at pH 1 to 4 with a function of time (minutes).
 (a)
(a)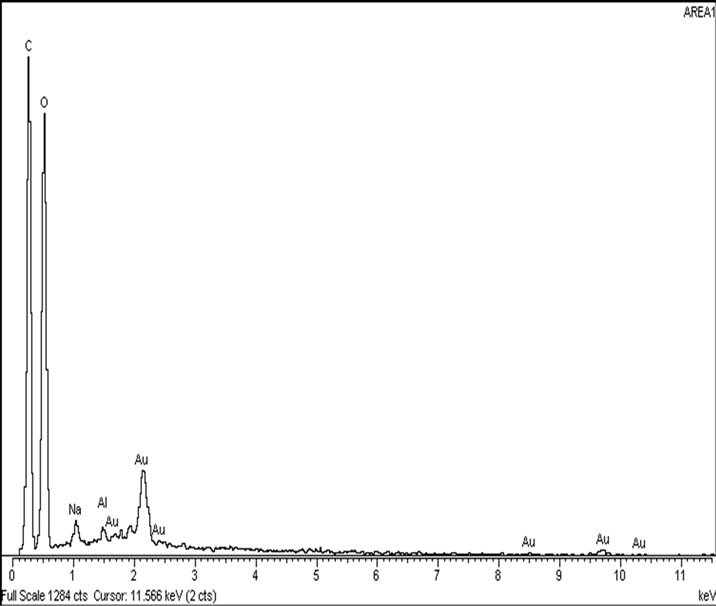 (b)
(b)
Figure 4. (a) SEM image of the surface of the sludge using tapioca starch (b) EDX analysis of the tapioca-silica sludge.
in agreement with other studies which state that the structure of [36] tapioca starch granules is truncated, round or oval with a measurement of 15 µm in diameter. In Figure 4(b), the EDX spectrum of the tapioca starch shows the presence of sodium and aluminium. Starches contain relatively small quantities (<0.4%) of minerals (calcium, magnesium, phosphorus, potassium and sodium) which are, with the exception of phosphorus, of little functional significance. Tapioca starch is less starchy due to the lower presence of lipid and proteins and has a higher degree of polymerization of amylose molecules than maize and wheat starch. Tapioca starch also has higher solubilization compared to cereal starch and is less stringy and cohesive compared to potato starch as well as being translucent, clear and transparent [36].
3.3.1. Turbidity Removal
The turbidity reduction in the semiconductor wastewater with different coagulant concentrations and settling times is shown in Table 3. The initial turbidity was 2200 NTU. At low coagulant dosages with long settling times the turbidity concentration decreased significantly. However, the optimum turbidity reduction was about 99% with a settling time of 30 minutes using 0.1 g/L of tapioca starch.
The turbidity successfully reduced to 51.62 NTU, achieving 98.0% reduction using 0.1 - 0.33 g/L of dosage and retention time between 30 - 60 minutes. However, it was observed that with increasing dosages of tapioca starch, the turbidity reduction decreases. The optimum turbidity reduction was achieved at 0.1 g/L and retention time of 30 minutes. The R2 was 0. 922 and the model was described using a second order quadratic model on the reduction of turbidity can be represented by following equation:
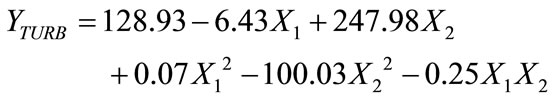 (2)
(2)
Figure 5(b) represents the close to fit in the experimental values with the predicted data on turbidity reduction in semiconductor wastewater. From Equation (1), the accuracy of prediction was 92% and the contributing factor was mainly the coagulant dosage. Hence, the effect of the tapioca starch concentration on turbidity reduction was prominent. The value of the turbidity could be predicted based on the controlled values of the independent variables of dosage and settling time up to an accuracy of 92%. Table 4 shows the analysis of variance with the Model F-value of 16.52 that implies the model was significant and according to the ANOVA interpretation. There was only 0.09% chance that a “Model F-value” this large could occur due to interference. Further, the ANOVA interpretation, indicated that the “Prob > F” is 0.0009 and accordingly, values of “Prob > F” less than 0.05 indicate model terms X1, X2 and X12 were significant.
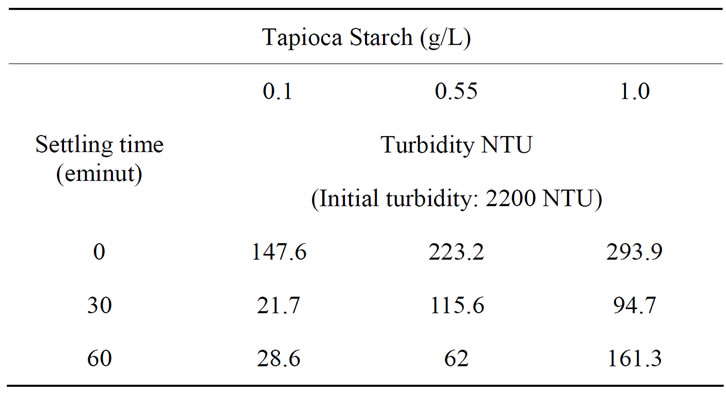
Table 3. The reduction of turbidity on settling time using tapioca starch.
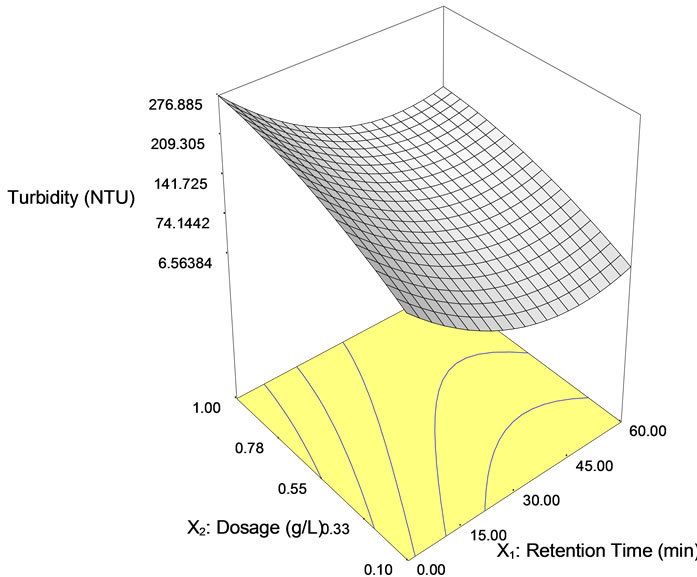 (a)
(a)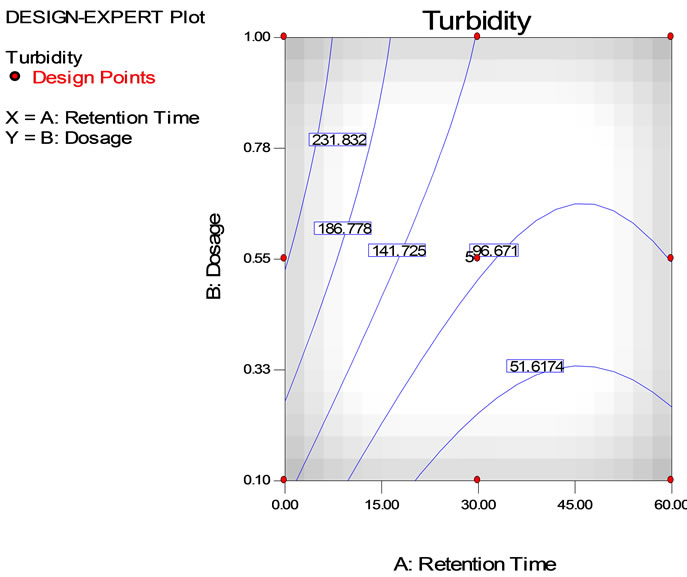 (b)
(b)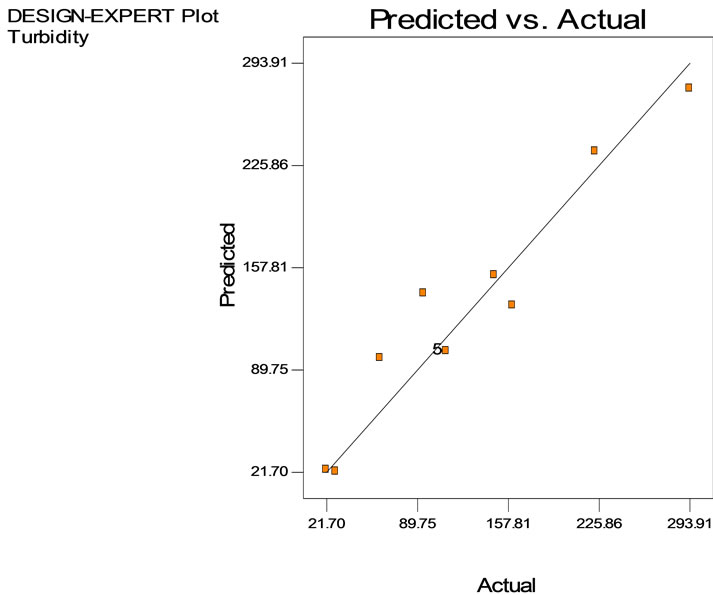 (c)
(c)
Figure 5. Reduction of turbidity in semiconductor wastewater using tapioca starch as function of retention time. (a), Surface plot and (b), contour plot; (c) Predicted vs. actual values.
3.3.2. COD Removal
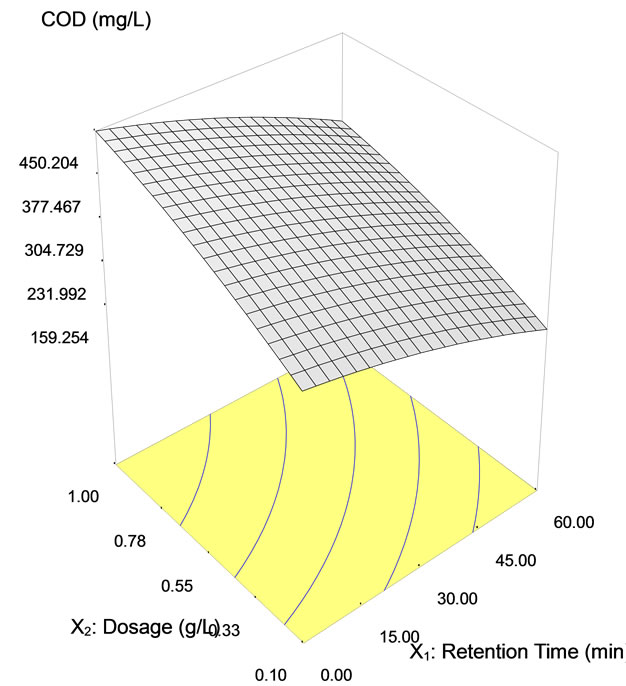
The COD reduction using tapioca starch with varying settling time is depicted in Table 5. Data show that the highest COD removal was achieved at 87% with a settling time of 60 min using 0.1 g/L of tapioca starch. However, the COD removal found to decrease the dosages of the tapioca starch increased. Figure 6 shows the three dimensional response surface and contour plots on the removal of COD using tapioca starch as a natural coagulant. As can be seen on the surface plot (Figure 6(a)), the COD value reduces at 256.24 mg/L using tapioca starch dosage range of 0.1 to 0.6 g/L at retention time between 20 to 60 minutes. However, the measurable difference COD reduction was obtained at the tapioca starch dosage of 0.55 g/L, the COD value started off at 374 mg/L, subsequently fall down to 353.22 mg/L at retention time of 17 minutes, 304.7 mg/L at 40 minutes and eventually to 256.2 mg/L at retention time of 60 minutes. Figure 6(c) shows the predicted vs. actual values on measurement in semiconductor wastewater using tapioca starch as a natural coagulant. It is found that most of the points are located quite close to the line giving an impression of closeness of fit and if judged from the regression coefficient.
The proposed model was adequate, possessing no significant lack of fit and very satisfactory value of R2 at 0.919 of 91.9% accurate. The closer the R2 value to unity, the better the empirical formula fits the actual data. The regression analysis is meant to predict the value of a dependent variable based on the controlled values of inde-
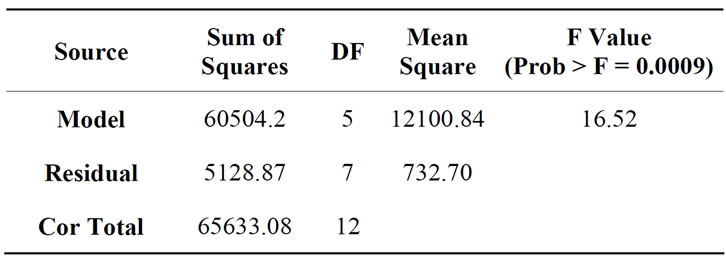
Table 4. Analysis of variance for turbidity after addition of tapioca starch during the coagulation treatment of semiconductor wastewater.
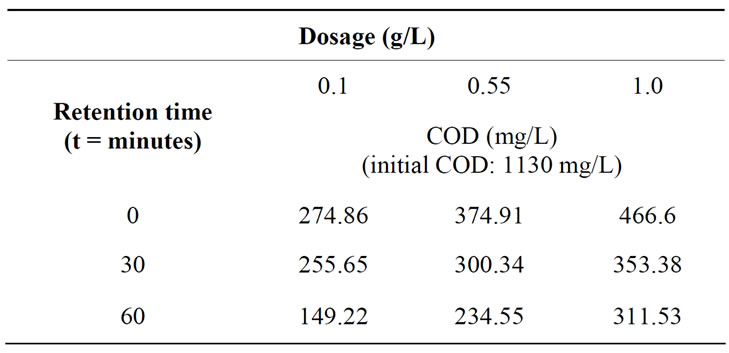
Table 5. COD of the semiconductor wastewater after tapioca starch treatment at various dosages and retention time.
 (a)
(a)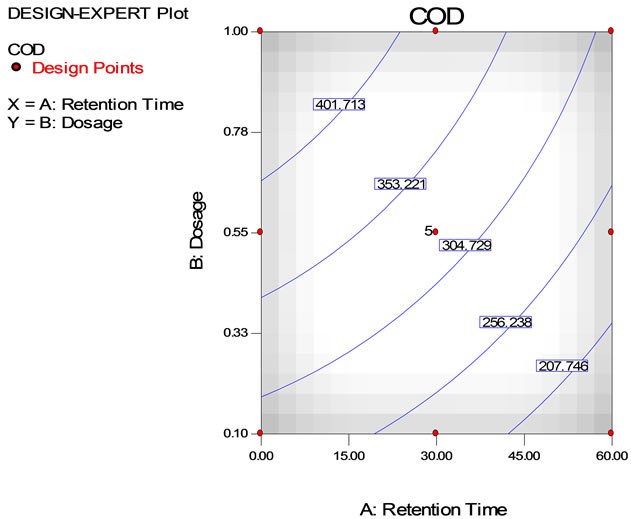 (b)
(b)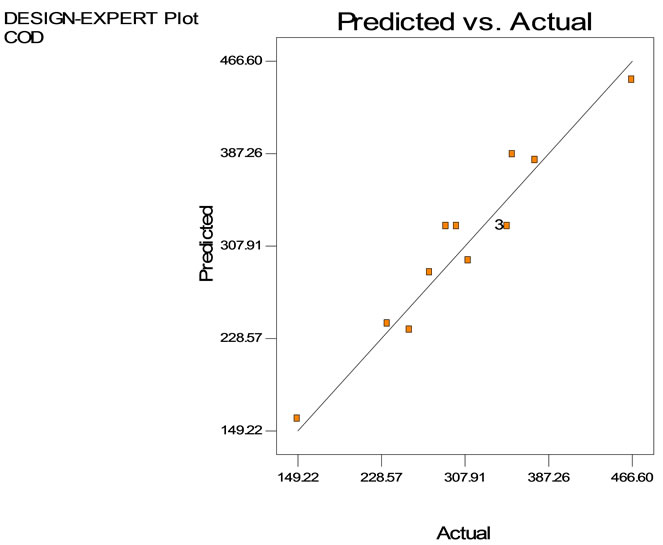 (c)
(c)
Figure 6. COD removal using tapioca starch as a natural coagulant with dosage ranging from 0.1 to 1.0 g/L and at retention time from 0 to 60 minutes (a) Surface plot, (b) contour plot, (c) Predicted vs. actual values.
pendent variables. The R2 was 0.919 and the model description used was a second order quadratic model represented by following equation:
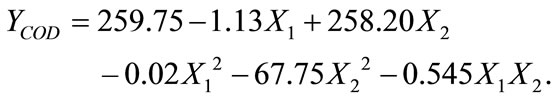 (3)
(3)
Based on the Equation (3), the COD removal was highly depended on the dosages rather than retention time. The analysis of variance of COD removal in semiconductor wastewater using the tapioca starch as a natural coagulant is given in Table 6" target="_self"> Table 6. The “Model F-value” of 15.93 implies the model is significant. From the ANOVA, there was only a 0.11% chance that a “Model F-value’ could be due to interference. Value of Prob > F in this case is 0.011 and is less than 0.05 which indicates that the model terms X1 and X2 are significant.
3.3.3. TSS Removal
Table 7 shows the TSS concentration of the semiconductor wastewater using tapioca starch at various retention times. It is found that the TSS concentration increased considerably from the initial concentration of 73.7 mg/L with the addition of tapioca starch.
However, the TSS concentration found to be reduced immensely with dosages 0.55 g/L and 1.0 g/L at retention time of 0 and 30 minutes, respectively. The sudden increase indicated that starch particles remained suspended for a period of time before it eventually settled out. Figure 7 shows the surface and contour plots of the TSS removal using tapioca starch with a function of retention time. Employing higher dosages, between 0.8 to 1.0 g/L,
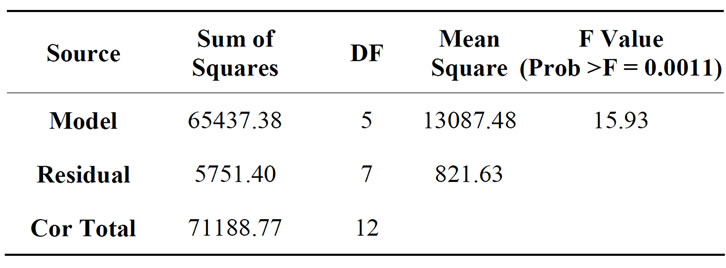
Table 6. Analysis of variance on COD removal using tapioca starch during coagulation treatment of semiconductor wastewater.
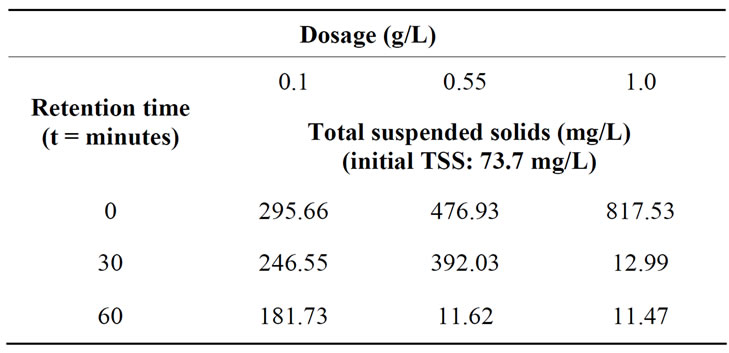
Table 7. Removal of TSS of the semiconductor wastewater after tapioca starch treatment at various dosages and retention times.
reduced the TSS concentration to 10.9 mg/L at retention time between 50 to 60 minutes. However, TSS removal was 564.3 mg/L at retention about 7 minutes, 10.8 mg/L at retention time of 50 minutes using 1.0 g/L tapioca starch. In contrast, using 0.55 g/L tapioca starch the TSS concentration is 425.9 mg/L at 20 minute retention time, was reduced to 149.2 mg/L at 60 minutes retention time. The model description representing the TSS analysis is a second order quadratic model equation as shown in Equation (4). The coefficient of determination, R2 was 0.768, indicating the accuracy about 78%.
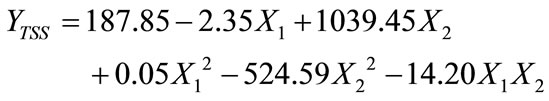 (4)
(4)
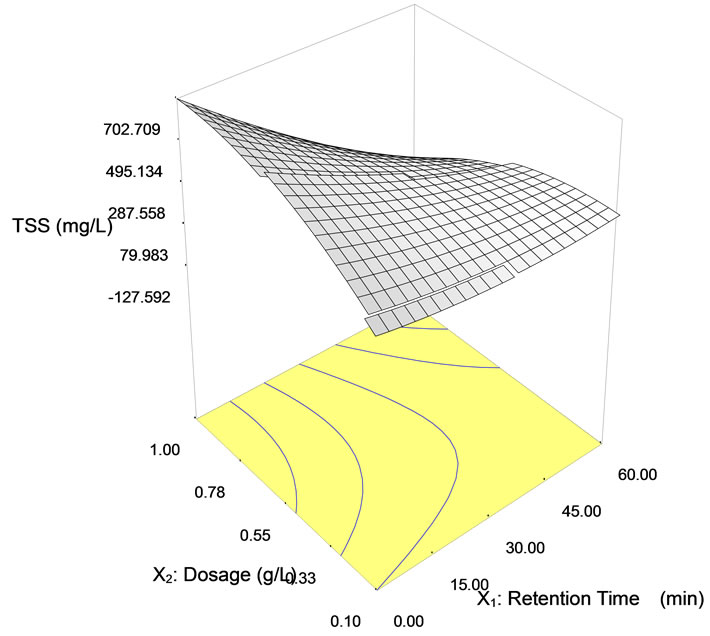 (a)
(a)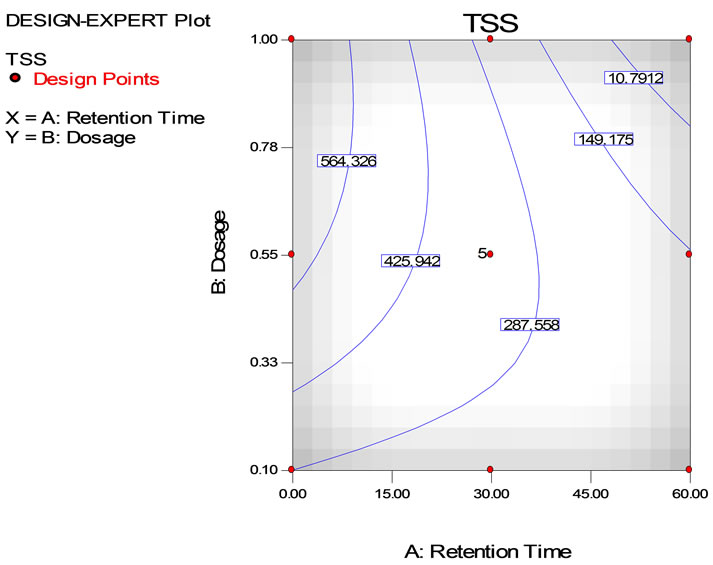 (b)
(b)
Figure 7. Surface (a) and contour (b) plots on TSS removal from semiconductor wastewater using tapioca starch as natural coagulant with dosage ranging from 0.1 to 1.0 g/l and retention time from 0 to 60 minutes.
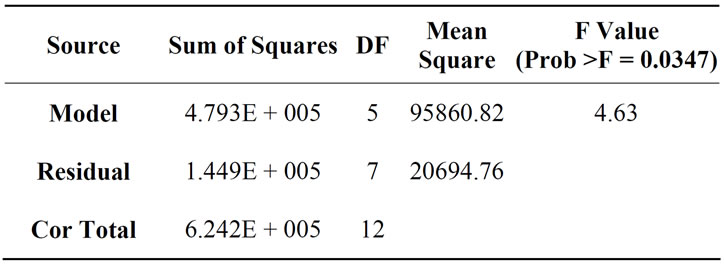
Table 8. Analysis of variance for TSS reduction after addition of tapioca starch during the coagulation treatment of semiconductor wastewater.
The Model F-value for the analysis of variance indicated a value of 4.63, as presented in Table 8. From the interpretation of the analysis, there was only a 3.47% chance that a “Model F-value” this large could occur due to interference. The Prob > F value is 0.0347 which is less than 0.05 and this demonstrates that the model terms were significant. In this case, X1, and X1X2 were significant model terms.
4. Conclusion
Treatment of semiconductor wastewater from a multinational semiconductor manufacturer was investigated using tapioca starch as a natural coagulant. The characteristics of the semiconductor wastewater were determined with TSS at 188 mg/L, turbidity at 4246 NTU and COD at 1752 mg/L. The silica solubility in the wastewater was pH dependent. Turbidity reduction was achieved with the highest value of about 97% whereas the COD concentration was found below 100 mg/L within the pH range 12 - 14. Tapioca starch as a natural coagulant has shown that the optimum turbidity reduction was 99% at a settling time of 30 minutes with dosage of 0.1 g/L. The COD reduction was achieved at 87% after 60 min of retention time and 0.1 g/L of dosage. With higher coagulant dosages, the TSS concentration reduced to 10.9 mg/L at retention time between 50 to 60 minutes. Overall, the findings were significant with R2 for turbidity, COD and TSS were 0.92, 0.92 and 0.77 respectively.
5. Acknowledgements
The authors are grateful to International Foundation for Science (W/5334-1) and Advanced Micro Devices (M) Sdn. Bhd. (304/PJJAU V650309.Al06) for the financial support of this work. One of the authors gratefully acknowledges the Institute for Post Graduate Studies, Universiti Sains Malaysia for providing post graduate research fellowship as a financial support.
REFERENCES
- S.-H. You, D.-H. Tseng and G.-L. Guo, “A Case Study on the Wastewater Reclamation and Reuse in the Semiconductor Industry,” Resources, Conservation and Recycling, Vol. 32, No. 1, 2001, pp. 73-81. http://dx.doi.org/10.1016/S0921-3449(00)00096-3
- C. Y. Lien and T. C. Liu, “Treatment of Polishing Wastewater from Semiconductor Manufacturer by Dispersed Air Flotation,” Journal of Environmental Engineering, Vol. 132, 2006, pp. 51-57. http://dx.doi.org/10.1061/(ASCE)0733-9372(2006)132:1(51)
- S.-C. Hsu, H.-L. Hsieh, C.-P. Chen, C.-M. Tseng, S.-C. Huang, C.-H. Huang, Y.-T. Huang, V. Radashevsky and S.-H. Lin, “Tungsten and Other Heavy Metal Contamination in Aquatic Environments Receiving Wastewater from Semiconductor Manufacturing,” Journal of Hazardous Materials, Vol. 189, 2011, pp. 193-202. http://dx.doi.org/10.1016/j.jhazmat.2011.02.020
- http://168.63.254.255/env3/uploads/PerformanceReport/2012/MediaStatement.pdf
- C. L. Lai and S. H. Lin, “Electrocoagulation of Chemical Mechanical Polishing (CMP) Wastewater from Semiconductor Fabrication,” Chemical Engineering Journal, Vol. 95, No. 1-3, 2003, pp. 205-211. http://dx.doi.org/10.1016/S1385-8947(03)00106-2
- J. Hollingsworth, R. Sierra-Alvarez, M. Zhou, K. L. Ogden and J. A. Field, “Anaerobic Biodegradability and Methanogenic Toxicity of Key Constituents in Copper Chemical Mechanical Planarization Effluents of the Semiconductor Industry,” Chemosphere, Vol. 59, 2005, pp. 1219- 1228. http://dx.doi.org/10.1016/j.chemosphere.2004.11.067
- S. H. Lin and C. D. Jiang, “Fenton Oxidation and Sequencing Batch Reactor (SBR) Treatments Of High-Strength Semiconductor Wastewater,” Desalination, Vol. 154, No. 2, 2003, pp. 107-116. http://dx.doi.org/10.1016/S0011-9164(03)80011-5
- S. H. Lin and C. R. Yang, “Chemical and Physical Treatments of Chemical Mechanical Polishing Wastewater from Semiconductor Fabrication,” Journal of Hazardous Materials, Vol. 108, No. 1-2, 2004, pp. 103-109. http://dx.doi.org/10.1016/j.jhazmat.2004.01.014
- C.-T. Wang, W.-L. Chou, L.-S. Chen and S.-Y. Chang, “Silica Particles Settling Characteristics and Removal Performances of Oxide Chemical Mechanical Polishing Wastewater Treated by Electrocoagulation Technology,” Journal of Hazardous Materials, Vol. 161, No. 1, 2009, pp. 344-350. http://dx.doi.org/10.1016/j.jhazmat.2008.03.099
- C. J. Huang, B. M. Yang, K. S. Chen, C. C. Chang and C. M. Kao, “Application of Membrane Technology on Semiconductor Wastewater Reclamation: A Pilot-Scale Study,” Desalination, Vol. 278, No. 1-3, 2011, pp. 203-210. http://dx.doi.org/10.1016/j.desal.2011.05.032
- F. M. Omar, N. N. N. A. Rahman and A. Ahmad, “COD Reduction in Semiconductor Wastewater by Natural and Commercialized Coagulants using Response Surface Methodology,” Water Air Soil Pollution, Vol. 195, 2008, pp. 345-352. http://dx.doi.org/10.1007/s11270-008-9751-7
- H.-D. Ryu, D. Kim and S.-I. Lee, “Application of Struvite Precipitation in Treating Ammonium Nitrogen from Semiconductor Wastewater,” Journal of Hazardous Materials, Vol. 156, No. 1-3, 2008, pp. 163-169. http://dx.doi.org/10.1016/j.jhazmat.2007.12.010
- S. H. Lin and C. D. Kiang, “Combined Physical, Chemical and Biological Treatments of Wastewater Containing Organics from a Semiconductor Plant,” Journal of Hazardous Materials, Vol. 97, No. 1-3, 2003, pp. 159-171. http://dx.doi.org/10.1016/S0304-3894(02)00257-1
- W.-L. Chou, C.-T. Wang and S.-Y. Chang, “Study of COD and Turbidity Removal from Real Oxide-CMP Wastewater by Iron Electrocoagulation and the Evaluation of Specific energy Consumption,” Journal of Hazardous Materials, Vol. 168, No. 2-3, 2009, pp. 1200-1207. http://dx.doi.org/10.1016/j.jhazmat.2009.02.163
- T.-C. Chuang, C. J. Huang and J. C. Liu, “Treatment of Semiconductor Wastewater by Dissolved Air Flotation,” Journal of Environmental Engineering, Vol. 128, No. 10, pp. 974-980. http://dx.doi.org/10.1061/(ASCE)0733-9372(2002)128:10(974)
- R. Sheikholeslami, I. S. Al-Mutaz, S. Tan and S. D. Tan, “Some Aspects of Silica Polymerization and Fouling and its Pretreatment By Sodium Aluminate, Lime and Soda Ash,” Desalination, Vol. 150, No. 1, 2002, pp. 85-92. http://dx.doi.org/10.1016/S0011-9164(02)00932-3
- M. F. Chang and J. C. Liu, “Precipitation Removal of Fluoride from Semiconductor Wastewater,” Journal of Environmental Engineering, Vol. 133, No. 4, 2007, pp. 419- 425. http://dx.doi.org/10.1061/(ASCE)0733-9372(2007)133:4(419)
- M. D. G. De Luna, Warmadewanthi and J. C. Liu, “Combined Treatment of Polishing Wastewater and FluorideContaining Wastewater from a Semiconductor Manufacturer,” Colloids and Surfaces A: Physicochemical and Engineering Aspects, Vol. 347, No. 1-3, 2009, pp. 64-68. http://dx.doi.org/10.1016/j.colsurfa.2008.12.006
- A. Ndabigengesere and K. S. Narasiah, “Influence of Operating Parameters on Turbidity Removal by Coagulation with Moringa Oleifera Seeds,” Environmental Technology, Vol. 17, No. 10, 1999, pp. 1103-1112. http://dx.doi.org/10.1080/09593331708616479
- S. Bhatia, Z. Othman and A. L. Ahmad, “Pretreatment of Palm Oil Mill Effluent (POME) Using Moringa oleifera Seeds as Natural Coagulant,” Journal of Hazardous Materials, Vol. 145, 2007, pp. 120-126. http://dx.doi.org/10.1016/j.jhazmat.2006.11.003
- H. A. Gamila, B. E. Hegazy, A. F. Hanan and M. E. Rehab, “Comparative Study on Natural Products Used for Pollutants Removal from Water,” Journal of Applied Sciences Research, Vol. 5, No. 8, 2008, pp. 1020-1029.
- J. Beltrán-Heredia and J. Sánchez-Martín, “Improvement of Water Treatment Pilot Plant with Moringa Oleifera Extract as Flocculant Agent,” Environmental Technology, Vol. 30, No. 6, pp. 525-534. http://dx.doi.org/10.1080/09593330902831176
- J. Beltrán-Heredia, J. Sánchez-Martín, A. Delgado-Regalado and C. Jurado-Bustos, “Removal of Alizarin Violet 3R (Anthraquinonic Dye) from Aqueous Solutions by Natural Coagulants,” Journal of Hazardous Materials, Vol. 170, No. 1, 2009, pp. 43-50. http://dx.doi.org/10.1016/j.jhazmat.2009.04.131
- P. K. Raghuwanshi, M. Mandloi, A. J. Sharma, H. S. Malviya and S. Chaudhari, “Improving Filtrate Quality Using Agrobased Materials as Coagulant Aids,” Water Quality Research Journal Canada, Vol. 37, 2002, pp. 745-756.
- M. Mandloi, S. Chaudhari and G. K. Folkard, “Evaluation of Natural Coagulants for Direct Filtration,” Environmental Technology, Vol. 25, 2004, pp. 481-489. http://dx.doi.org/10.1080/09593332508618457
- J. Zhang, F. Zhang, Y. Luo and H. Yang, “A Preliminary Study on Cactus as Coagulant in Water Treatment,” Process Biochemistry, Vol. 41, No. 3, 2006, pp. 730-733. http://dx.doi.org/10.1016/j.procbio.2005.08.016
- A. Diaz, N. Rincon, A. Escorihuela, N. Fernandez, E. Chacin and C. F. Forster, “A Preliminary Evaluation of Turbidity Removal by Natural Coagulants Indigenous to Venezuela,” Process Biochemistry, Vol. 35, No. 3-4, 1999, pp. 391-395. http://dx.doi.org/10.1016/S0032-9592(99)00085-0
- R. Sanghi, B. Bhatttacharya and V. Singh, “Cassia Angustifolia Seed Gum as an Effective Natural Coagulant for Decolourisation of Dye Solutions,” Green Chemistry, Vol. 4, 2002, pp. 252-254. http://dx.doi.org/10.1039/b200067a
- M. Sciban, M. Klasnja and J. Stojimirovic, “Investigation of Coagulation Activity of Natural Coagulants from Seeds of Different Leguminose Species,” Acta Periodica Technologica, Vol. 36, 2005, pp. 81-87. http://dx.doi.org/10.2298/APT0536081S
- M. Sciban, M. Klašnja, M. Antov and B. Škrbić, “Removal of Water Turbidity by Natural Coagulants Obtained from Chestnut and Acorn,” Bioresource Technology, Vol. 100, No. 24, 2009, pp. 6639-6643. http://dx.doi.org/10.1016/j.biortech.2009.06.047
- G.-X. Xing, S.-F. Zhang, B.-Z. Ju and J.-Z. Yang, “Recent Advances in Modified Starch as Flocculant,” The Proceedings of the 3rd International Conference on Functional Molecules, Dalian, 8-11 September 2005.
- M. O. Fatehah, M. S. Hossain and T. T. Teng, “Comparative Study on Natural and Commercial Coagulants: Treatment of Semiconductor Wastewater in Sludge Production and Removal of Heavy Metals,” International Journal of Science and Modern Engineering, in press.
- APHA, “Standard Methods for the Examination of Water and Wastewater,” 17th Edition, American Public Health Association, Washington DC, 1992.
- EQA, “Environmental Quality Act and Its Subsidiary Legislations 1974, Amendment 2006,” MDC Publishers Sdn Bhd, Kuala Lumpur, 2006.
- W.-H. Kuan and C.-Y. Hu, “Chemicals Evidences for the Optimal Coagulant Dosage and pH Adjustment of Silica Removal from Chemical Mechanical Polishing (CMP) Wastewater,” Colloids and Surfaces A: Physicochemical and Engineering Aspects, Vol. 342, 2009, pp. 1-7. http://dx.doi.org/10.1016/j.colsurfa.2009.03.019
- J. J. M. Swinkels and Veendam, “Composition and Properties of Commercial Native Starches,” Starch, Vol. 37, No. 1, 1985, pp. 1-5. http://dx.doi.org/10.1002/star.19850370102