Journal of Water Resource and Protection
Vol.5 No.6(2013), Article ID:33041,6 pages DOI:10.4236/jwarp.2013.56059
Study on Spatial Distribution of OM, N, P in Surface Soil around Lake Chaohu
1College of Environmental Sciences and Engineering, Liaoning Technical University, Fuxin, China
2Chinese Research Academy of Environmental Sciences, Beijing, China
3Anqing Normal College, Anqing, China
Email: *chuzs@craes.org.cn, fanronggui@163.com
Copyright © 2013 Ronggui Fan et al. This is an open access article distributed under the Creative Commons Attribution License, which permits unrestricted use, distribution, and reproduction in any medium, provided the original work is properly cited.
Received March 22, 2013; revised April 21, 2013; accepted May 15, 2013
Keywords: Chaohu Lake; Soil; Total Nitrogen; Total Phosphorus; Organic Material; Spatial Distribution
ABSTRACT
The concentration of total nitrogen (TN), total phosphorus (TP) and organic material (OM) at sixty grid division in Lake Chaohu basin around the lake was studied, in order to investigate their spatial distribution characteristics. The results showed that the average concentrations of TN, TP and OM were 1027 mg/kg, 483 mg/kg, 1.95%, and their concentrations ranged from 253 mg/kg to 2273 mg/kg, 223 mg/kg to 1173 mg/kg and 0.291% to 5.48%, respectively. The high concentration areas were located at the basins of Tuogao river and Zhao river while the low concentration areas were located at basins of Pai river, Nanfei river and Dianpu river. The concentrations of TN and OM were higher in East part than in West part. The spatial distribution of TN, TP and OM concentrations of the surface soil showed inconsistent with those of the water quality of the inflow rivers and the lake and the TN and TP of lake sediment studied.
1. Introduction
The nitrogen, phosphorus and other various nutrients were mainly stored in soil in terrestrial ecosystems. The basin soil and soil nutrient loss not only affect agricultural production, it is also an important source of the water environment pollution now [1-3]. Lake Chaohu is one of the five largest freshwater lakes in China. Because of the effect of unreasonable human activities for a long time, the basin of Lake Chaohu faced with severe environmental pollution and water eutrophication. It has affected the basin sustainable development of the social economy. In recent years, the authorities spent a great deal of manpower, material and financial resources to manage the basin pollution and water eutrophication. With the deepening of the basin of Lake Chaohu point source pollution control, agricultural non-point source pollution problem has become increasingly prominent [4,5]. The nitrogen (N), phosphorus (P) and organic material (OM) in the soil are the mainly effect factors of the watershed non-point source pollution. This survey of research is carried out in the Lake Chaohu surrounding area. The purpose of this research is to investigate the spatial distribution characteristics of the N, P and OM concentrations of the surface soil.
2. Materials and Methods
2.1. Study on the Regional General Situation
The basin of Lake Chaohu was located between Yangtze River and Huai River in the middle of the two rivers in Anhui Province. The lake body belonged to the Yangtze River downstream left bank river system, and its drainage area was about 13,349 km2. The whole topography was long from west to east, narrow from north to south, high in west part, low in east part, and low-lying and flat in the middle part. This kind of topography formed the basin of Lake Chaohu. Low mountains, low hilly hills and hilly mounds in the basin’s area were 2617 km2, but the obvious soil erosion was about 1500 km2. Low mountains and hilly mounds were the main source of soil erosion [6]. The basin river system assumed radiated, and the network of rivers and lakes density was high. The whole basin had a total of 33 rivers, and they belonged to Hangpu river, Fengle river, Pai river, Nanfei river, Dianpu river, Tuogao river, Baishitian river and Yuxi river, etc. 7 river systems respectively.
2.2. Research Methods
According to the 7 major river systems of Lake Chaohu region division, we maked a sample survey of the surface soil of Lake Chaohu basin around 3000 km2 in September, 2008. Taking 6 km × 6 km as the sampling unit, we gathered 5 surface soil type (20 cm) form sampling unit nearness center position and periphery 1 - 2 km place, and used the quartering mixes uniform. We together got 60 mixture samples from 7 river systems and distribution of sampling sites around Lake Chaohu (Table 1). After the collection, the samples should be stored by nature airing, crushed, and through 100 mesh screen. The TN, TP, and OM were measured using the Hybrid Catalysis K2SO4-CuSO4-Se [7], SMT Protocol Method [8], Potassium Bichromate Capacity Method-External Heating Method [9], respectively. We should use the SPASS17.0 Regression Analysis to make relevant analysis.
3. Results and Analysis
3.1. Spatial Distribution Characteristics of Soil Total Nitrogen
There was a large change in variation of total nitrogen of surface soil around Lake Chaohu (Figures 1 and 2). The average concentrations of TN were 1027 mg/kg and its concentrations ranged from 253 mg/kg to 2273 mg/kg and 46.3%, respectively.
From the result of the basin of 7 major river systems, we can make a conclusion that the average concentrations of TN were Tuogao river (1477 mg/kg), Yuxi river (1288 mg/kg), Zhao river (1156 mg/kg), Baishitian river (808 mg/kg), Nanfei river, Dianpu river (744 mg/kg), Hangpu river, Fengle river (619 mg/kg), and Pai river (520 mg/kg) from high to low. It showed that the variation of concentrations of TN of the basin of Hangpu river, Fengle river were the highest in this area, they were lower in the basin of Zhao river, and the basin of Tuogao river was the lowest one. Their variation coefficients were 60.3%, 59.6%, and 29.3%, respectively. The high concentration areas were located at the basins of Tuogao river, Zhao river and the east of Yuxi river while the low concentration areas were located at basins of Hangpu river, Fengle river, Pai river, Nanfei river and Dianpu river. The highest concentration area was located at the basins of Tuogao river while the lowest concentration area was located at basins of Pai river. In the point of view from the regional division, the east of Lake Chaohu, Tuogao river, Yuxi river, Zhao river belonged to East part, while the west of Lake Chaohu, Nanfei river, Pai river, Hangpu river, Fengle river, Baitianshi river belonged to West part. The average concentrations of TN of the surface soil were higher in East part than in West
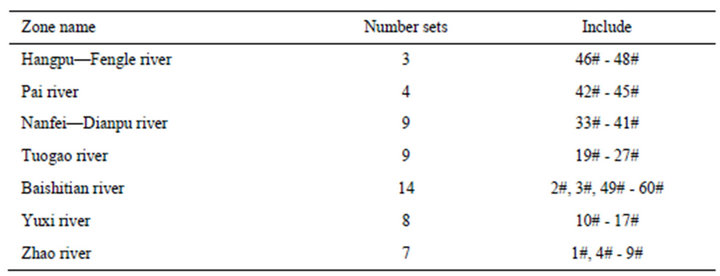
Table 1. Seven rivers and distribution of sampling sites around Lake Chaohu.
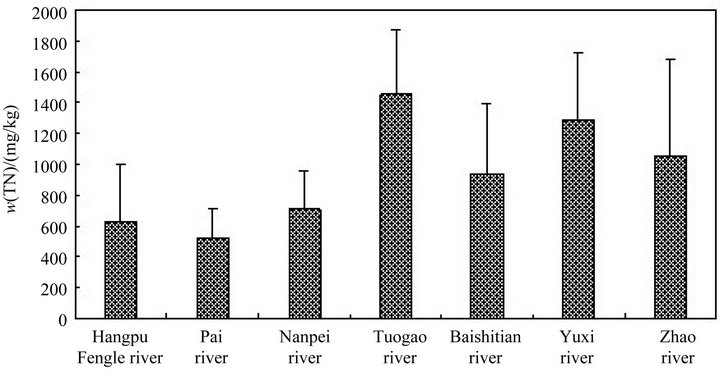
Figure 1. Variation of total nitrogen content of surface soil around Lake Chaohu.
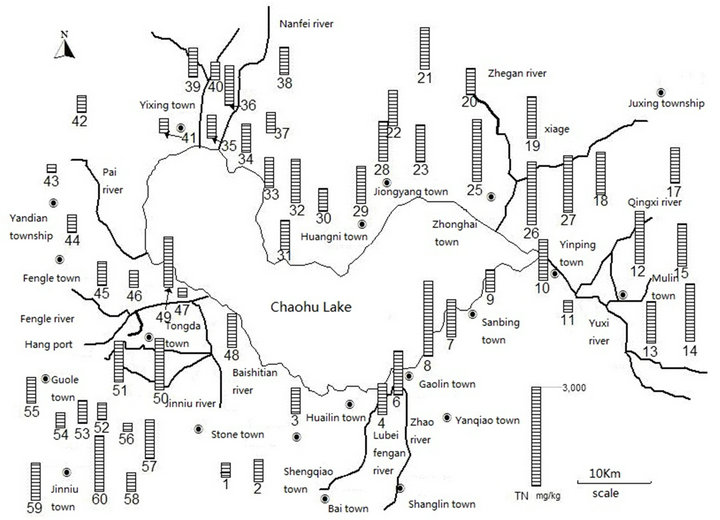
Figure 2. Distribution of total nitrogen concentration of surface soil around Lake Chaohu.
part (1307 mg/kg > 673 mg/kg).
3.2. The Spatial Distribution Characteristics of the Soil Total Phosphorus
There was a large change in variation of total phosphorus of surface soil around Lake Chaohu (Figures 3 and 4). The average concentrations of TP were 483 mg/kg, and their concentrations ranged from 223 mg/kg to 1173 mg/ kg, and 34.1%, respectively.
From the result of the basin of 7 major river systems, we can make a conclusion that the average concentrations of TP were Tuogao river (586 mg/kg), Yuxi river (458 mg/kg), Hangpu river, Fengle river (573 mg/kg), Baishitian river (504 mg/kg), Zhao river (486 mg/kg), Nanfei river, Dianpu river (420 mg/kg), and Pai river (382 mg/kg) from high to low. It showed that the variation of concentrations of TP of the basin of Baishitian river were the highest in this area, they were lower in the basin of Zhao river, and the basin of Pai river was the lowest one. Their variation coefficients were 48.6%, 35.5%, and 10.6%, respectively. The high concentration areas were located at the basins of Tuogao river, Zhao river, Baishitian river and Hangpu, Fengle river while the low concentration areas were located at basins of Pai river, Nanfei, Dianpu river and Yuxi river. The highest concentration area was located at the basins of Tuogao river while the lowest concentration area was located at basins of Pai river. The highest and lowest areas of TP were similar to the area of TN. While in the point of view from the regional division, the average concentrations of TP of the surface soil in East part (477 mg/kg) were similar to those in West part (470 mg/kg). There was no significant difference between them.
3.3. The Spatial Distribution Characteristics of the Soil Organic Material
There was a large change in variation of Organic Material of surface soil around Lake Chaohu (Figures 5 and 6). The average concentrations of OM were 1.95%, and its concentrations ranged from 0.291% to 5.48%, and the coefficient of variation was 34.1%.
From the result of the basin of 7 major river systems, we can make a conclusion that the average concentrations of OM were Tuogao river (2.94%), Yuxi river (2.43%), Hangpu river, Fengle river (1.94%), Zhao river (1.92%), Nanfei river, Dianpu river (1.76%), Baishitian river (1.58%), and Pai river (1.08%) from high to low. It showed that the variation of concentrations of OM of the basin of Baishitian river were the highest in this area, they were lower in the basin of Pai river, and the basin of Hangpu river, Fengle river were the lowest. Their variation coefficients were 61.3%, 54.6%, and 8.7%, respectively. The high concentration areas were located at the basins of Tuogao river, Yuxi river, Hangpu river, Fengle river, and Zhao river while the low concentration areas were located at basins of Pai river, Nanfei river, Dianpu river, and Baishitian river. The highest concentration area was located at the basins of Tuogao river while the lowest concentration area was located at basins of Pai river. The spatial distribution characteristics of Organic Material content of surface soil were related to the content of TN strikingly (w(OM) =14.483·w (TN) + 5815.1, R2 = 0.88, P < 0.05). The spatial distribution of the OM showed consistent with the spatial distribution of the TN. In the point of view from the regional division, the average concentrations of TN of the surface soil were higher in East part than in West part (2.43% > 1.59%).
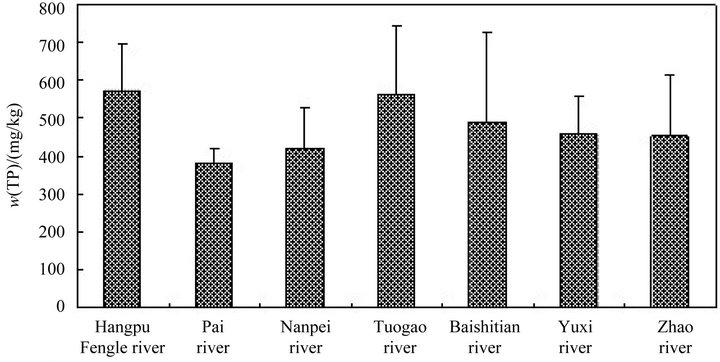
Figure 3. Variation of total phosphorus content of surface soil around Lake Chaohu.
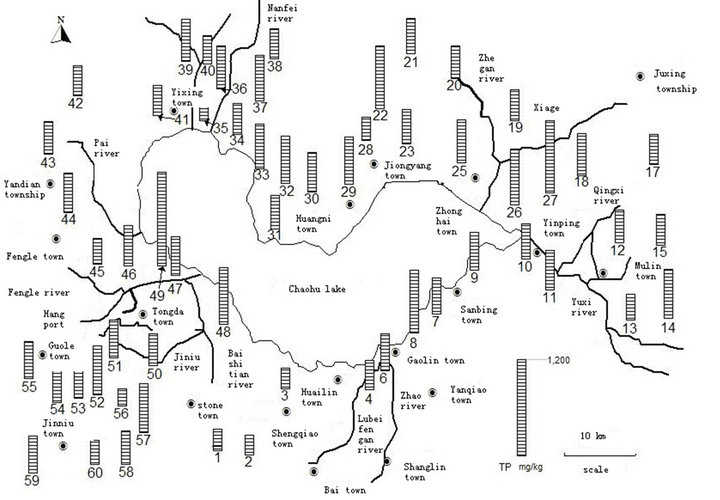
Figure 4. Distribution of total phosphorus concentration of surface soil around Lake Chaohu.
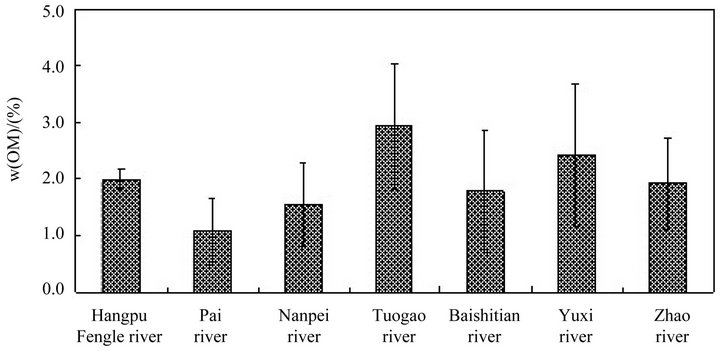
Figure 5. Variation of organic material content of surface soil in Chaohu Lake.
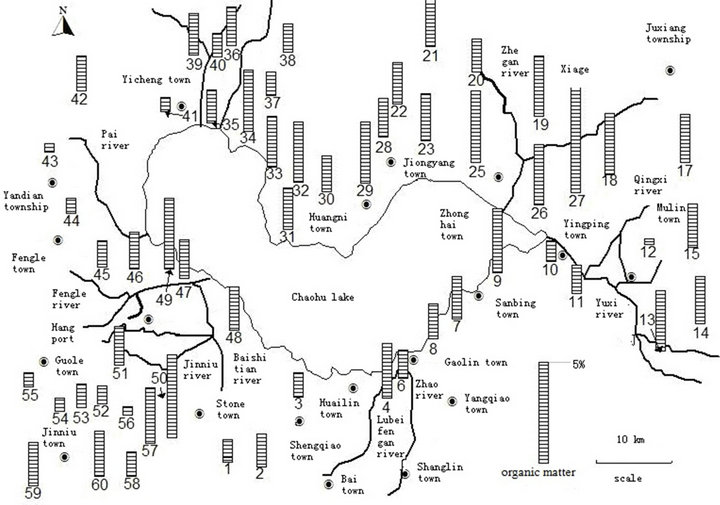
Figure 6. Distribution of organic material concentration of surface soil in Chaohu Lake.
There was a large difference between the two parts.
4. Discussion
4.1. The Spatial Distribution of Variation of TN, TP and OM Content of Surface Soil
The spatial distribution in Lake Chaohu basin around the lake of the TN, TP and OM concentrations of the surface soil showed obvious region change. From the result of the basin of 7 major river systems, we can see the high concentration areas were located at the East part basins of Tuogao river and Zhao river while the low concentration areas were located at the West part basins of Pai river, Nanfei river and Dianpu river. Zhou Huiping’s study of the spatial distribution of the TP in Lake Chaohu basin around in 2003 [10], and Hu Hongxiang [11-13] and other person’s study of the spatial distribution of the TN, and TP of the basin of Ma Anshan in Lake Chaohu in 2006,and 2007 were also displayed the similar rules. In the surrounding area of Lake Chaohu, the basin of Nanfei river, Dianpu river, and Pai river located near the developed industry place of He Fei etc., the capacity of soil cultivation was low while the basin of Hangpu river, Fengle river, and Baishitian river cultivated a large scale agricultural crops. Therefore, such as the place capacity of soil cultivation was very high. The capacity of soil cultivation may be the most significant effect factor of the Nitrogen, Phosphorus, and Organic Material. In addition, the high background value of TP in the basin of Lake Chaohu was also a significant effect factor for the regional distribution difference [14]. From the type of land planted, the main types of crops were Vegetable Field, Double-season Rice, Rice-rape Rotation, Cotton Field, Wasteland, and so on. The soil of Vegetable Field contained the highest concentrations of Nitrogen, Phosphorus, and Organic Material. While in the Rice Paddy, Rice-rape Rotation and Cotton Field, the contents of TN, TP, and OM were closely (see Table 2).
4.2. The Effect of Water Quality and Sediment in Surface Soil around Chaohu Lake
The low concentrations of TN, and TP areas were located at basins of Nanfei river, Dianpu river, Pai river, Hangpu river, and Fengle river. However, except the Hangpu river, and Fengle river, other rivers annual average of water quality were all in inferior V class. While the high concentrations of TN, and TP areas were located at basins of Tuogao river, Zhao river. The river water quality was much better than other rivers. Their annual averages of water quality were in III class and IV class respectively. From this we can see that the spatial distribution of the TN, and TP concentrations of the surface soil around Lake Chaohu showed inconsistent with those of the water quality of the inflow rivers and the lake. The water quality of Lake Chaohu in West part was inferior to the East part [15]. This characteristic also showed inconsistent with those of the spatial distribution of the Nitrogen, and Phosphorus concentrations of the surface soil around Lake Chaohu. From the distribution of sediments in Lake Chaohu, Lake Chaohu sediments of TN, and TP high concentration areas were located at the entrance of 4 major river systems in Nanfei river, Dianpu river, Pai river, Hangpu river, and Fengle river. While the low concentration areas were located at the entrance of 4 major river systems in Yuxi river, Zhao river, Tuogao
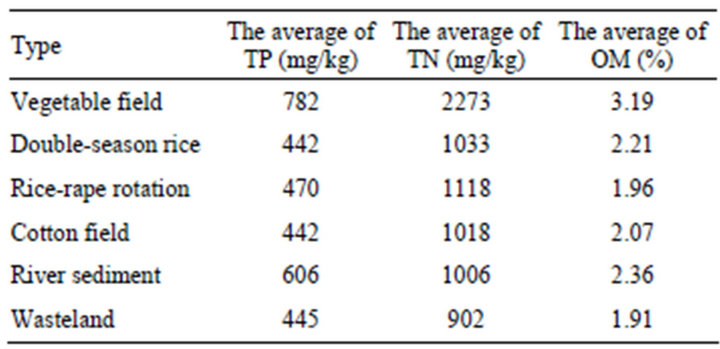
Table 2. Contents of total nitrogen, total phosphorus and organic material in soil for different using ways.
river [15]. It is thus clear that this characteristic also showed inconsistent with those of the spatial distribution of the TN, and TP concentrations of the soil of Lake Chaohu and the surface soil around Lake Chaohu.
5. Conclusion
The results showed that the average concentrations of TN, TP and OM were 1027 mg/kg, 483 mg/kg, 1.95%, and their concentrations ranged from 253 mg/kg to 2273 mg/kg, 223 mg/kg to 1173 mg/kg and 0.291% to 5.48%, respectively. The spatial distribution characteristics of Organic Material content of surface soil were related to the content of TN strikingly (w (OM) = 14.483·w (TN) + 5815.1, R2 = 0.88, P < 0.05). The high concentration areas were located at the basins of Tuogao river and Zhao river while the low concentration areas were located at the basins of Pai river, Nanfei river and Dianpu river. The concentrations of TN and OM were higher in East part than in West part. The spatial distribution of the TN, TP and OM concentrations of the surface soil showed inconsistent with those of the water quality of the inflow rivers and the lake and the TN and TP of lake sediment studied.
REFERENCES
- A. N. Sharpley, S. C. Chapra, R. Wedepohl, et al., “Managing Agricultural Phosphorus for Protection of Surface Waters: Issues and Options,” Journal of Environmental Quality, Vol. 23, No. 3, 1994, pp. 437-451. doi:10.2134/jeq1994.00472425002300030006x
- Z. F. Dai, J. Z. Wang and J. Cheng, “Soil Phosphorus of Non-Point Source Pollution and Its Impact on the Environment of Research,” Journal of Agro-Environment Science, Vol. 25, No. S1, 2006, pp. 323-327.
- T. C. Daniel, A. N. Sharpley and J. L. Lemunyon, “Agricultural Phosphorus and Eutrophication: Asymposium Overview,” Journal of Environmental Quality, Vol. 27, No. 2, 1998, pp. 251-257. doi:10.2134/jeq1998.00472425002700020002x
- X. C. Jin, S. K. Liu and Z. S. Zhang, “Chinese Lake Environment (II) [M],” Ocean Press, Beijing, 1995, pp. 167- 183.
- R. Z. Li and T. Q. Hong, “Basin of Lake Chaohu Agriculture Nonpoint Source Contamination Control Countermeasure Research,” Journal of Hefei University of Technology (Social Science), Vol. 20, No. 1, 2006, pp. 105-110.
- W. J. Yan and F. X. Chen, “The Research of Surface Run-Off Pollution Characteristics in Different Land Use Types in the Basin of Lake Chaohu,” Resources and Environment in the Yangtze Basin, Vol. 8, No. 3, 1998, pp. 275-277.
- R. K. Lu, “Analytical Methods of Soil Agrochemistry,” Chinese Agriculture Science and Technology Press, Beijing, 1999.
- V. Ruban, S. Brigault and D. Demare, “An Investigation of the Origin and Mobility of Phosphorus in Freshwater Sediments from Bort-Les-Orgues Reservoir, France,” Journal of Environmental Monitoring, Vol. 1, No. 4, 1999, pp. 403-407. doi:10.1039/a902269d
- S. D. Bao, “Analysis of Soil Agrochemical (Ⅲ) [M],” China Agriculture Press, Beijing, 2000, pp. 30-34.
- H. P. Zhou, C. Gao, B. Sun Bo, et al., “Lake Chaohu Basin Soil of TP Content Spatial Variation Characteristic and Influence Factor,” Agro-Environmental Science, Vol. 26, No. 6, 2007, pp. 2112-2117.
- H. X. Hu, T. Q. Hong and L. L. Fan, “Study on Changes of Soil OM, N, P in Ma Anshan Lake Chaohu,” Soil and Water Conservation in China, Vol. 11, 2006, pp. 26-28.
- H. X. Hu, T. Q. Hong, M. Huang, et al., “The Research of Ma Anshan Lake Chaohu in North-West Slope Erosion and Its Temporal Variation of N, P,” Journal of Soil and Water Conservation, Vol. 21, No. 5, 2007, pp. 30-34.
- C. W. Wang, X. Y. Wang, Y. Feng, et al., “Distribution of Total Phosphorus in the Sediments of Lake Chaohu and Its Geological Origin,” Journal of Anhui Normal University (JCR Science Edition), Vol. 30, No. 4, 2007, pp. 496- 499.
- R. Wang, “Lake Chaohu Basin Water Environment Quality Appraisal and Water Quality Forecast Model Research,” Hefei University of Master’s Thesis, 2009, pp. 15-34.
- Environmental Protection Department of Pollution Preventing and Controlling Division, “Lake Chaohu Ecological Security Investigation and Evaluation,” 2009, pp. 41-50.
NOTES
*Corresponding author.