Journal of Water Resource and Protection
Vol.5 No.2(2013), Article ID:27682,9 pages DOI:10.4236/jwarp.2013.52015
Developments of Rill Networks: An Experimental Plot Scale Study
1Department of Geography & Environment Management, Vidyasagar University, Medinipur, India
2Senior Research Fellow (ICMR), Rajendra Memorial Research Institutes of Medical Sciences (ICMR), Bihar, India
Email: *pravatgeo2007@gmail.com
Received November 4, 2012; revised December 8, 2012; accepted December 24, 2012
Keywords: Rill Network; Slope Gradient; Rainfall Simulation; Sediment Yield
ABSTRACT
Enumerating the relative proportions of soil losses due to rill erosion processes during monsoon and post-monsoon season is a significant factor in predicting total soil losses and sediment transport and deposition. Present study evaluated the rill network with simulated experiment of treatments on varying slope and rainfall intensity to find out the rill erosion processes and sediment discharge in relation to slope and rainfall intensity. Results showed a significant relationship between the rainfall intensity and sediment yield (r = 0.75). Our results illustrated that due to increase in rainfall intensity represent the development of efficient rill network while, no rill was found with a slope of 20˚ and a rainfall intensity of 60 mm∙h−1. The highest rill length was observed in plot E with 20˚ slope and 120 mm∙h−1 rainfall intensity at 360 minutes. Positive and strong correlation (R2 = 0.734, P < 0.001) was observed between the cumulative rainfall intensity and sediment discharge. A longitudinal profile was delineated and showed that the depth and numbers of depressions amplified with time and were more prominent for escalating rainfall intensity for its steeper slopes. Information derived from the study could be applied to estimate longer-term erosion stirring over larger areas possessing parallel landforms.
1. Introduction
Rainfall simulation is widely used by hydrologists [1-4], geomorphologists [5-7] and soil scientists [8,9] are involved in theoretical research and its applications to field problems, providing some possibility for control of a critical variation. It permits precise replication of storm events and sequences which recur naturally only over a prolonged period. Simulators have evolved in response to precise research requirements and to local technical, financial or logistic conditions [10]. Simulation Rainfall is needed to understand the basic processes and mechanisms of rill formation, rill density, rill networks, rill distribution, and the magnitude of flow rate and associated transport capacity, rill erosion and development [10- 14]. However, several laboratory studies have been documented by the earlier workers on river and rill networks [15-18].
Alternatively, flume experiments have added great attention to our understanding of the complex dynamics of the fluvial system [19]. Although flume experiments are no substitute for field studies, field work often cannot easily address questions of how landforms within the fluvial system evolve and interact through time, particularly at large scales. The processes acting in a flume may be different from those of larger basins. However, the model basins in large flumes suggest that the natural and large model basins are at least qualitatively similar [16, 19-21]. In the present study, we focused on two objectives such as: 1) to evaluate the rill network with simulated experiment of treatments on varying slope and rainfall intensity and 2) to determine the rill erosion processes and sediment discharge in relation to slope and rainfall intensity.
2. Experimental Set-Up and Procedures
2.1. Flume and Soil Preparation
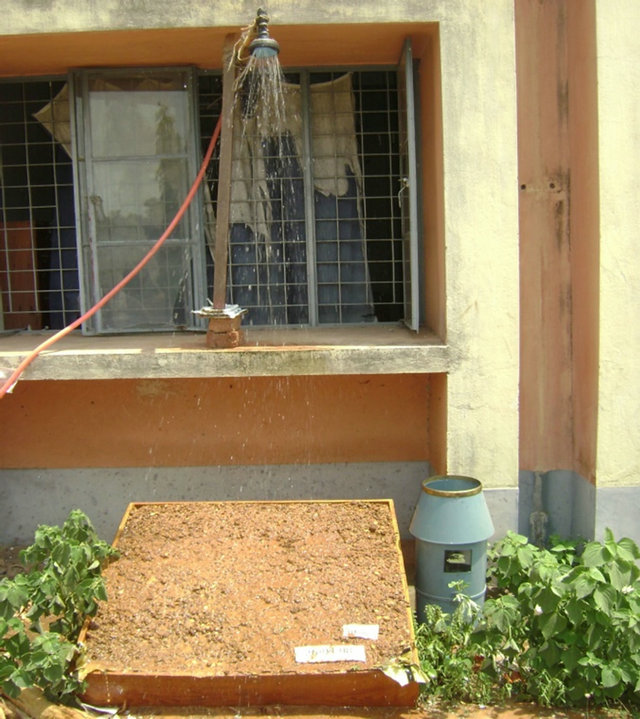
The experiment was conducted in the Laboratory of Geography and Environment Management, Vidyasagar University, West Bengal, India. A small runoff plots (1 × 1.5 × 0.30 m) was used with a rainfall simulator (Figure 1). The soil material was used in the laboratory experiments consisted of 18% clay, 22% silt and 60% sand, as defined by the United States Department of Agriculture (USDA) classification system. The soil samples were collected from Rangamati gullies affect area, located on
 (a)
(a)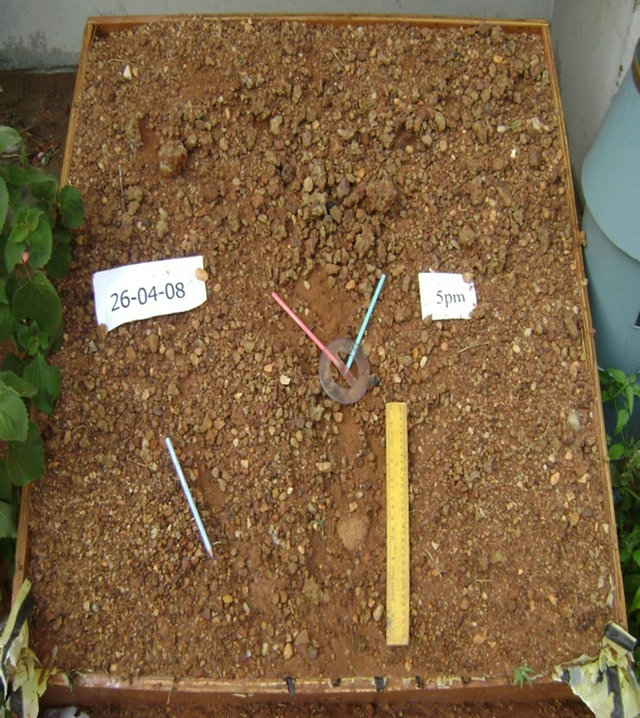 (b)
(b)
Figure 1. (a) Rainfall simulators; (b) Measurements of each rill during the experiment by ruler and protector.
the left bank of Kasai River in the city of Medinipur, West Bengal. The soil samples were packed in the plot, with a bulk density of 1.13 to 1.15 g∙cm−3. During the packing process, a static weight method was used to pack the soil uniformly in the box; the packed soil surface was smoothed manually with a rake. After the initial rainfall, the packed soil was saturated and allowed to equilibrate for the least 48 hours, while the plot remained in a horizontal position to ensure a uniform and homogeneous soil moisture contents close to field capacity.
2.2. Rainfall Simulator
A tripod mounted Guelph Rainfall Simulator followed by Tossell et al., [22]; Mandal et al., [23]; Yao et al., [24]; and Berger et al., [9] was used to generate rill develop and soil loss over time (Figure 1(a)). The rainfall simulation system provided rainfall intensities ranging from 20 to 150 mm∙h−1 over an affective simulation area of 2.5 × 2.5 meter. The nozzle height of 3 m ensured that the raindrops would reach terminal velocity of the highest point of the plot. Rainfall intensity was verified with two rain gauges distributed evenly within the rainfall simulation area.
2.3. Treatments
The treatments were carried out on three different slopes (e.g., 26.79˚, 36.40˚ and 46.63˚), each with three varying levels of rainfall intensity (e.g., 60, 90, and 120 mm∙h−1) (Table 1). However, the slope and rainfall intensity were selected to cover the storm and field condition observed naturally in the western part of West Bengal in India.
2.4. Measurements
Each test was carried out after 7.00 hours of the initial rainfall and pre-wetting subsequent the soil grounding. The opening time of the simulated rainfall, the time when runoff reached the outlet of the plot, and the time when rill initiation occurred were documented from the experimental plot (Table 2). During each rainfall simulation runoff samples were taken at the flume outlet at 1 hour interval from the moment when runoff was started. Discharge was measured in every 1 hour by collecting the runoff from the outlet gutter at the lower end of the plot in a bucket. Runoff volumes were determined by weighing each bucket. To separate the suspended sediments from water in the samples, the runoff samples containing buckets were allowed to settle overnight. The
Table 1. Slope steepness values and rainfall intensities for each treatment.

buckets were weight before and after decant of water. The remaining water and sediment were transferred into containers that were dried in ovens at 105˚C for at least 24 hours, or until the samples were completely dry. The mass of the sediment was then measured and used to calculate the sediment concentration.
The observations were made during and after the experiment including photographs, the rill formation and video-recording the change in rill morphology followed by Yao et al., [24]. The plane patterns of rill were recorded photographically at specified time intervals of 1 hour after developing and producing enlargements from this film. We also reproduced the plane patterns of rill by tracing the edge of rill drainage on the tracing paper, and input the plane co-ordinates along the rill boundary (x, y) to a personal computer using heads-up digitizing. The variation of sectional patterns over time was also measured by collecting photographs via measuring bars. Several measurements were performed of each rill during the experiment by ruler and protector (Figure 1(b)).
3. Experimental Results
3.1. Role of Slope and Rainfall Intensity on Erosion
The rainfall intensity was detained constant during the test and sediment and runoff samples were collected at the outlet of the discharge panel sheet every minute during the first 60 minutes. Variation in rainfall intensity and associated runoff affect the soil detachment and sediment concentration.
Mean total runoff did not vary significantly between the different treatment (F-test p < 0.000), both with regard to slope and rainfall intensity. However, important dissimilarities between three groups of experiments were recognized when applying the same test to mean total sediment yield. By varying slope at steady rainfall intensity of 90 mm∙h−1, cumulative sediment yield after 210 mm was appreciably diverse for the treatment with 15˚ slope (Table 3). The treatment with 20˚ and 25˚ slope illustrated inconsequential difference (p < 0.40). However, in our study, there is a significant relationship was found between the rainfall intensity and sediment yield (r = 0.75; p < 0.002). By contrasting both the treatment series, the treatment with lowest rainfall intensity (e.g., 20˚ slopes with rainfall intensity of 60 mm∙h−1) and slope (e.g., 15˚ slope with rainfall intensity of 90 mm) formed part of the group with smallest mean total sediment yield after 210 mm rainfall. Therefore, variations of slope from 15˚ to 25˚ slope have a positive and significant effect on the sediment yield (r = 0.54, p < 0.05). Additionally, discrepancies of rainfall intensity from 60 mm∙h−1 to 120 mm∙h−1 showed strong and significant correlation (r = 0.75, p < 0.000). The group with the highest total sedi-
Table 2. Experimental data at point of rill initiation.
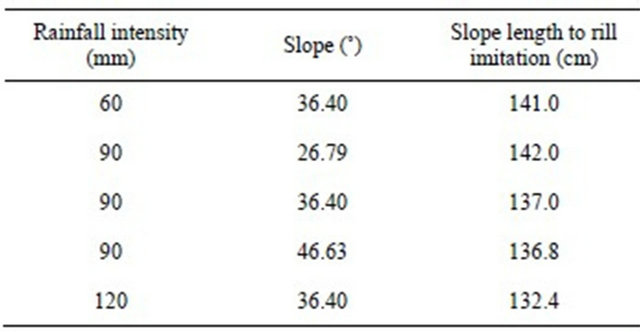
Table 3. Role of runoff and rainfall intensity in sediment yield.
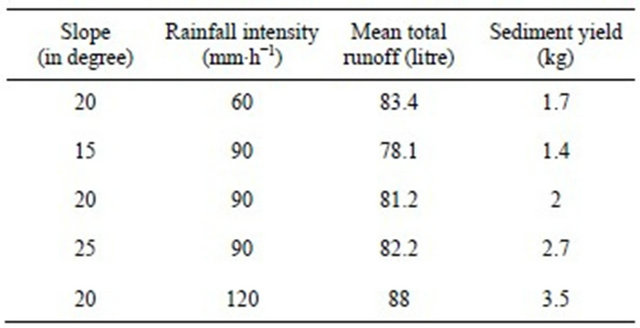
ment yield consisted of the experiment with 120 mm∙h−1 and 20˚ slope. Moreover, our results also indicated that rainfall intensity had a stronger effect in sediment yield than the amends in slope for the given treatments. This study is also corroborated with the previous study conducted by Favis-Mortlock et al. [13] and Berger et al., [9].
Additionally, a scatter plot has been drawn to estimate the relationship of cumulative sediment yield after 90 minutes experimental time increased exponentially with cumulative runoff when the rainfall intensity increased (Figure 2). The result showed that larger the rainfall intensity the larger was the sediment concentration in the runoff. A similar observation was also described for field experiments by Chaplot and Le Bissonnais [25].
3.2. Observation of Erosion Processes
An observation has been made for 7 hours period in five experimental plots and in different slopes to understand the rill erosion process in each experimental plot. In the early stage of the experiment, seepage lines begin to appear on the lower part of slope within one hour. It also found that the splash of soil particles was predominant by the raindrop impact on the slope. Subsequently, as the surface flow began to generate at the lower part of slope, the seepage line gradually moved up, and the sheet erosion and rill erosion was started by transported sand silt and clay through the surface flow and channels (Figure 3).
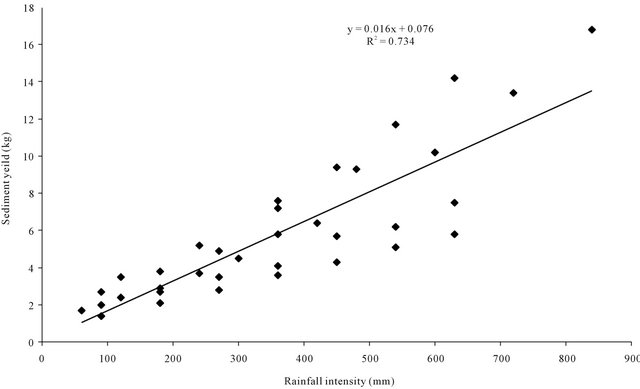
Figure 2. Relationship between cumulative rainfall intensity and sediment yield in the experimental plot.
3.3. Rill Network Development
As the sheet erosion continued, many small rills appeared on the lower part of the slope. Some of the them increased in size, and grow into small channels or first stage of rill by concentrated flow. These rills generally spared upward to the slope through spreading their plan size, branching and bifurcation. Rills growth was very unstable became a channel sometimes jointed another one, or a rill which had been just formed was buried by the sediment yield, and the time at which rill generally began, depends on the rainfall intensity and slope gradient (Figure 3). However, the analysis of our results also showed that due to the less intensity of rainfall in the experimental plot, no rill has been developed with a slope of 20˚ and a rainfall intensity of 60 mm∙h−1, and afterwards few rills have been developed. Conversely, due to increase in rainfall intensity represent the development of efficient rill network. The strong persuade of high-intensity phases in the initial stages of a storm on rill development was mentioned by earlier researchers [26,27]. This particular treatment chop below a threshold possibly persuaded by the cohesion of the soil where no change was demonstrable, meaning that no rill network could develop. Moreover, slope is also played an important role in rill development. The result of our study also illustrated that maximum rills have been recorded in the 20˚ and 25˚ in respect to 15˚ slope.
3.4. Rill Density and Its Effect on Erosion
Rill density is the number of rills per unit width. Hansen et al., [28] reported that rill density varies with a number of factors such as slope steepness and length, runoff rate, soil texture, soil erodibility and the amount of rainfall. For each experimental plot rill length, width, depth and areal coverage were recorded accordingly (Table 4). The highest rill length (e.g., 9 cm) was observed in plot E with a slope of 20˚ and a rainfall intensity of 120 mm∙h−1 at 360 minutes. Among the experimental plots, the average length of rill was maximum in plot E, while the average low length was recorded from the plot B (slope of 15˚ and a rainfall intensity of 90 mm∙h−1). Similarly, the average rill width is also maximum in the plot E (35.47 cm), whereas the average minimum density was documented in plot B (27.245 cm). Largest rill depths occurred at high rainfall intensity and steep slopes. Our results also illustrated that the average rill depth of plot A is minimum among the experimental plot (1.68 cm), and the highest depth is evidenced in the plot E (3.70 cm). In the experimental series with 20˚ slope and a rainfall intensity of 60 mm∙h−1, and a slope of 15˚ and a rainfall intensity of 90 mm∙h−1 (Figure 3), slight surface change could be noticed and low sediment yields were calculated. These two tests smudge the experiments with the minimum rainfall intensity and slope, respectively. As such, the observations during the experiments it was presumed

Figure 3. Five series of growth plane patterns of rill network development.
Table 4. Rill development characteristics in different experimental plots.
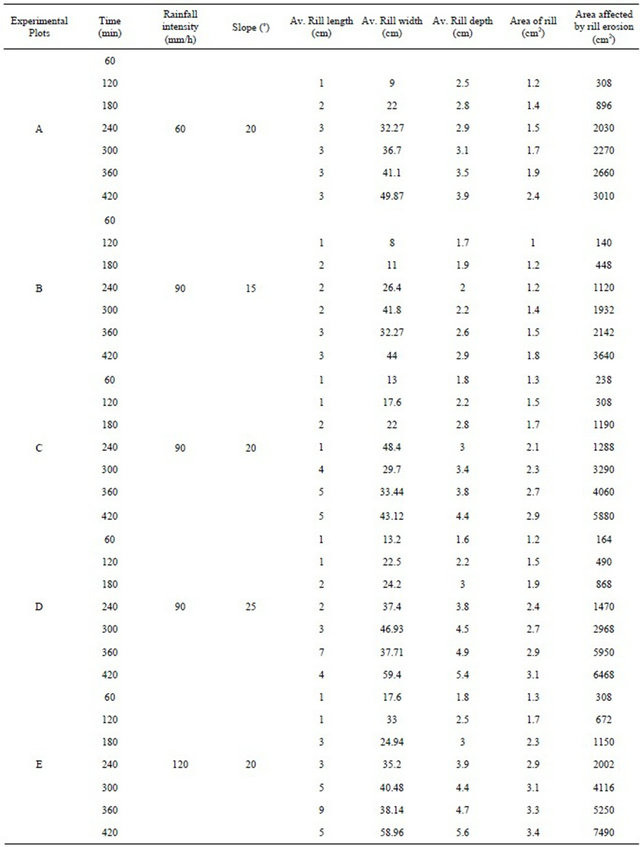
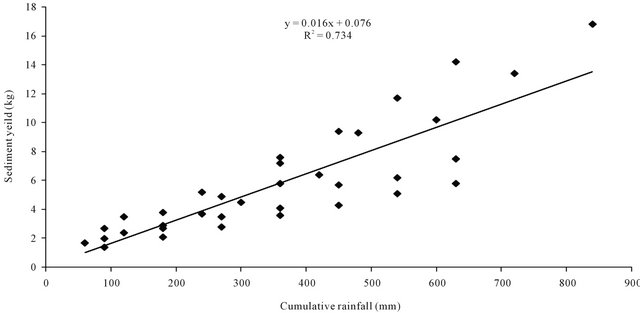
Figure 4. Relation between cumulative rainfall (mm) and sediment yield (kg).
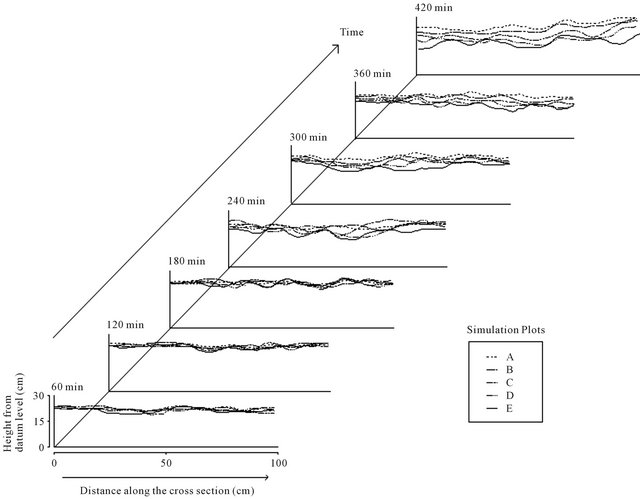
Figure 5. Changes in the plane patterns of rill over time of different experimental plots.
that sheet and splash erosion were accountable for the bulk of erosion mostly for the low-intensity treatment. However, a simple correlation was calculated between the cumulative rainfall intensity and sediment discharge (Figure 4), and the result showed highly positive and strong correlation (R2 = 0.734, P < 0.001). Similar study conducted by Favis-Mortlock et al., [13] and Gómez et al., [26] reported that temporal and spatial sequence and dominance of progressions as in other experiments and soil erosion models.
3.5. Changes in the Plane Patterns over Time
A longitudinal profile was delineated to illustrate the changes in plane pattern of rill over time of experimental plots (Figure 5). Results of our study showed depth and numbers of depressions amplified with time and were more prominent for escalating rainfall intensity for its steeper slopes. In the early stage, the rills were broad and thin; however, the notched was found with increase of time and adequate runoff into the soil by back-cutting and side erosion. Back-cutting was initiated at a local erosion basis and advanced upwards, developing rills with steep walls and depths up to a certain time (e.g., 180 minutes); and afterwards, the channel width increased progressively with the increase of time
4. Conclusion
Five experiments were conducted on three slope gradients and three rainfall intensity using experimental methodologies. The results of this study challenge the assumption often used in hydrologic and erosion models for better prediction of sheet erosion or actives rill erosion. This result illustrated here the interactions of slope gradient, rainfall intensity, erosion in the formation of rills and network. Rills often act as sediment sources and the dominant sediment and water transport mechanism of upland slopes. It was found that during simulated rainstorms, the measured amount of interrill erosion in the sediment progressively declined as that of rill erosion increased. Since rill erosion sources comparatively greater soil loss than interrill erosion, the outcome of the study might be useful to determine when rill erosion becomes a significant contributor to overall soil losses and aids to take the necessary action for its control.
REFERENCES
- M. C. Slattery and R. B. Bryan, “Hydraulic Conditions for Rill Incision under Simulated Rainfall: A Laboratory Experiment,” Earth Surface Processes and Landforms, Vol. 17, No. 2, 1992, pp. 127-146. doi:10.1002/esp.3290170203
- G. Govers, “Relationship between Discharge, Velocity and Flow Area for Rills Eroding Loose, Non-Layered Materials,” Earth Surface Processes and Landforms, Vol. 17, No. 5, 1992, pp. 515-528. doi:10.1002/esp.3290170510
- T. W. Lei, M. A. Nearing, K. Haghighi and V. F. Bralts, “Rill Erosion and Morphological Evolution: A Simulation Model,” Water Resources Research, Vol. 34, No. 11, 1998, pp. 3157-3168. doi:10.1029/98WR02162
- M. A. Nearing, L. D. Norton, D. A. Bulgakov and G. A. Larionov, “Hydraulics and Erosion in Eroding Rills,” Water Resources Research, Vol. 33, No. 4, 1997, pp. 865-876. doi:10.1029/97WR00013
- D. T. Favis-Mortlock, “An Evolutionary, Approach to the Simulation of Rill Initiation and Development,” In: R. H. Abrahart, Ed., Proceedings of the 1st International Conference on GeoComputation, University of Leeds, Leeds, Vol. 1, 1996, pp. 248-281.
- D. T. Favis-Mortlock, “A Self-Orgnizing Dynamic System Approach to the Simulation of Rill Development on Hillslopes,” Computers and Geosciences, Vol. 24, No. 4, 1998, pp. 353-372. doi:10.1016/S0098-3004(97)00116-7
- J. Peosen, J. Ngehtergaele, G. Verstraeten and C. Valentin, “Gully Erosion and Environmental Change: Importance and Research Needs,” Catena, Vol. 50, No. 2-4, 2003, pp. 91-133. doi:10.1016/S0341-8162(02)00143-1
- G. A. Mancilla, S. Chen and D. K. McCool, “Rill Density Prediction and Flow Velocity Distributions on Agricultural Areas in the Pacific Northwest,” Soil & Tillage Research, Vol. 84, No. 1, 2005, pp. 54-66. doi:10.1016/j.still.2004.10.002
- C. Berger, M. Schulze, D. Rieke-Zapp and F. Schlunegger, “Rill Development and Soil Erosion: A Laboratory Study of Slope and Rainfall Intensity,” Earth Surface Processes and Landforms, Vol. 35, No. 12, 2010, pp. 1456-1467.
- R. B. Bryan, “Soil Erosion under Simulated Rainfall in the Field and Laboratory: Variability of Erosion under Controlled Conditions,” In: Tacconi, Eds., Erosion and Sediment Transport Measurement, Walling, IAHS Press, Wallingford, pp. 391-404.
- G. A. Mancilla, S. Chen and D. K. McCool, “Rill Density Prediction and Flow Velocity Distribution on Agricultural Areas in the Pacific Northwest,” Soil and Tillage Research, Vol. 84, No. 1, 2005, pp. 54-66. doi:10.1016/j.still.2004.10.002
- G. Govers, “Rill Erosion on Arable Land in Central Belgium. Rates, Controls and Predictability,” Catena, Vol. 18, No. 2, 1991, pp. 133-155. doi:10.1016/0341-8162(91)90013-N
- D. T. Favis-Mortlock, J. Boardman, A. J. Parsons and B. Lascelles, “Emergence and Erosion: A Model for Rill Initiation and Development,” Hydrological Processes, Vol. 14, No. 11-12, 2000, pp. 2173-2205. doi:10.1002/1099-1085(20000815/30)14:11/12<2173::AID-HYP61>3.0.CO;2-6
- J. Poesen, J. Nachtergaele, G. Verstraeten and C. Valentina, “Gully Erosion and Environmental Change: Importance and Research Needs,” Catena, Vol. 50, No. 2-4. 2003, pp. 91-133. doi:10.1016/S0341-8162(02)00143-1
- M. P. Mosley, “Experimental Study of Rill Erosion,” Transactions of the American Society of Agricultural Engineers, Vol. 17, No. 5, 1974, pp. 909-916.
- R. S. Parker, “Experimental Study of Drainage Basin Evolution and Its Hydrologic Implications,” Ph.D. Dissertation, Colorado State University, Fort Collins, 1977.
- A. Ogunlela, B. N. Wilson, C. T. Rice and G. Couger, “Rill Network Development and Analysis under Simulated Rainfall,” American Society of Agricultural Engineers Paper No. 892112, Quebec City, 1989.
- B. N. Wilson and D. E. Storm, “Fractal Analysis of Surface Drainage Networks for Small Upland Areas,” Transactions of the American Society of Agricultural Engineers, Vol. 36, No. 5, 1993, pp. 1319-1326.
- S. A. Schumm, M. P. Mosley and W. E. Weaver, “Experimental Fluvial Geomorphology,” Wiley Interscience, New York, 1987.
- A. Capra, C. Di Stefano, V. Ferro and B. Scicolone, “Similarity between Morphological Characteristics of Rills and Ephemeral Gullies in Sicily, Italy,” Hydrological Processes, Vol. 23, No. 23, 2009, pp. 3334-3341. doi:10.1002/hyp.7437
- J. D. Pelletier, “Drainage Basin Evolution in the Rainfall Erosion Facility: Dependence on Initial Conditions,” Geomorphology, Vol. 53, No. 1-2, 2003, pp. 183-196. doi:10.1016/S0169-555X(02)00353-7
- R. W. Tossell, W. T. Dickinson, R. P. Rudra and G. J. Wall, “A Portable Rainfall Simulator,” Canadian Agricultural Engineering, Vol. 29, No. 2, 1987, pp. 155-162.
- U. K. Mandal, K. V. Rao, P. K. Mishra, K. P. R. Vittal, K. L. Sharma and B. Narsimlu, “Soil Infiltration, Runoff and Sediment Yield from a Shallow Soil with Varied Stone Cover and Intensity of Rain,” European Journal of Soil Science, Vol. 56, No. 4, 2005, pp. 435-443. doi:10.1111/j.1365-2389.2004.00687.x
- C. Yao, T. Lei, W. J. Elliot, D. K. McColl, J. Zhao and S. Chen, “Critical Condition for Rill Initiation,” Transactions of the ASABE, Vol. 51, No. 1, 2008, pp. 107-114.
- V. A. M. Chaplot and Y. Le Bissonnais, “Runoff Features for Interrill Erosion at Different Rainfall Intensities, Slope Lengths and Gradients in an Agricultural Loessial Hillslope,” Soil Science Society of America Journal, Vol. 67, No. 3, 2003, pp. 844-851. doi:10.2136/sssaj2003.0844
- J. A. Gomez, F. Darboux and M. A. Nearing, “Development and Evolution of Rill Networks under Simulated Rainfall,” Water Resources Research, Vol. 39, No. 6, 2003, pp. 1-14. doi:10.1029/2002WR001437
- M. A. Nearing, “Potential Changes in Rainfall Erosivity in the US with Climate Change during the 21st Century,” Journal of Soil and Water Conservation, Vol. 56, No. 3, 2001, pp. 229-232.
- B. Hansen, P. Reich, P. S. Lake and T. Cavagnaro, “Minimum Width Requirements for Riparian Zones to Protect Flowing Waters and to Conserve Biodiversity: A Review and Recommendations,” Monash University, Melbourne, 2010. http://www.ccmaknowledgebase.vic.gov.au/resources-/RiparianBuffers_Report_Hansenetal2010.pdf
NOTES
*Corresponding author.