Journal of Water Resource and Protection
Vol.4 No.9(2012), Article ID:22469,8 pages DOI:10.4236/jwarp.2012.49082
Spatio-Temporal Variations in Water Quality of the Chao Phraya River, Thailand, between 1991 and 2008
1Faculty of Agriculture, Ubon Ratchathani University, Ubon Ratchathani, Thailand
2Mahidol University, Nakhon Sawan Campus, Nakhon Sawan, Thailand
Email: napiyathap@mahidol.ac.th, *tjuta@agri.ubu.ac.th
Received July 5, 2012; revised August 8, 2012; accepted August 19, 2012
Keywords: Surface Water; Self Organizing Maps; Anthropogenic Stresses; Temperature
ABSTRACT
Spatio-temporal variations in the water quality of the Chao Phraya River, Thailand, were examined, on average-yearly basis, between 1999 and 2008, from 32 surface water stations from the river origin to the delta. Five water quality parameters viz., DO, BOD, TCB, FCB, NH3-N and water temperature were used in the analysis. Analysis was performed by using the Self Organizing Maps. Four distinct spatially approached clusters were classified, according to the similarity of water quality parameters, while temporal variations of most of the surface water stations were not obviously observed. The worst water quality condition was at the stations near the river delta and highly related to anthropogenic stresses. Result from the correspondence analysis showed that, except for the cluster of the worst water quality, the stations of the remaining three clusters were overlapped. There was no statistical difference in water temperature among clusters but the expected effects from climate change should be a precautionary focus since the will eventually affect the water quality.
1. Introduction
The livelihoods of riparian people depend to some extent on the goods and services of water resources and water quality is among the key factors affecting the environmental health of the river system [1]. Meanwhile, anthropogenic stresses as well as changes in environment during recent decades are the key issues that severely degrade the water quality in river systems elsewhere [2,3]. However, recovery of the river system from eutrophication and poor water quality conditions is feasible through rigid control on the pollution sources [1,2]. Establishment of a monitoring program on water quality is, therefore, highlighted for the purpose of determining the state of pollution in any particular site in the rivers [1,2,4]. The general trends of either decreasing or increasing water quality at any monitored site indicate which areas are stepped to a good, moderate or vulnerable condition [2, 3,5].
Besides the anthropogenic stressors, the condition of water quality in the river is related to hydrological properties [4,6]. The global warming influences on higher air and water temperatures and changes in the timing, intensity and duration of precipitation affect the hydrological characteristics of the river, especially in terms of flow and flood, which eventually affect the water temperature and water quality of the river [6], for example the higher temperature reduces dissolved oxygen and extends thermal stratification, which increases the potential for anoxia. Increases in frequency and intensity of rainfall during the rainy season will produce more turbid conditions, meanwhile drought during the dry season would allow saline water to intrude into the river [7]. Moreover, changes in stream water quality, in terms of eutrophication and nutrient transport, are very dependent on changes in stream flow [8] and a long drought period has a noticeable effect on water quality, e.g. temperature, DO, BOD,  , and chloride concentration [8,9].
The Chao Phraya Basin, the largest river basin in central Thailand, covers an area of approximately 160,000 km2 representing 30 percent of the country’s total area and is home to 40% of the country’s population [10]. The Chao Phraya Basin is divided into 2 parts (Figure 1). The upper par, is mountainous alternating with lowland areas along the river, while the Lower Chao Phraya Basin is a vast floodplain area and covers 55,290 km2, i.e. 35% the total basin area [10]. The Chao Phraya River per se begins at the junction of four major rivers in the Upper basin, in Nakhon Sawan Province. The total length of river is about 380 km and drains into the Gulf of Thailand. It supplies water and supports many activities such as municipal uses, agriculture, fisheries, light and heavy industries, recreation and navigation [10,11]. The river, therefore, receives the discharge of wastewater from many sources, especially those from household, industrial and agricultural activities, and makes the water polluted. The major sources of pollutants in the upper portion were from agricultural waste and form communities and industries in the lower part of the river course [12]. Due to the importance of the river and the significant number of stressors along it, this paper aims to investigate the water quality as well as water temperature along the Chao Phraya River in terms of spatio-temporal approach by using multivariate techniques.
2. Materials and Methods
2.1. Source of the Data
The data is from the Pollution Control Department of Thailand (PCD, available at www.pcd.go.th). There are 32 surface water stations, i.e., CH1-CH32 (Figure 1) along the Chao Phraya river course. We used the time series data of water quality between 1999 and 2008, i.e. 10 years. The water quality parameters used in the analysis were DO, BOD, TCB, FCB, NH3-N and water temperature. The reason why these parameters were selected is because they are input parameters for water quality index (WQI), developed by PCD, which attempts to provide a simple and understandable tool to evaluate the quality of any given water bodies [13].
2.2. Data Analyses
To perform statistical analysis, the annual average of each selected variable was used. The dataset was performed as rows of the observation (i.e., surface water station ´ year, for example, CH7_03 is the observation from station 7 in year 2003) and columns of water quality parameters (i.e., 6 variables). There were 327 observations in total for the analysis, after data cleaning by selecting the observations that had the data for all parameters. The state-of-the art multivariate analysis, Self Organizing Maps (SOM), was employed to evaluate the spatio-temporal variations of the data matrix. A SOM is an unsupervised algorithm of an artificial neural network model (ANN), proposed by Prof. T. Kohonen of Helsinki University during 1980s [14]. The basic idea of SOM is to display a high-dimensional signal manifold onto a much lower dimensional network in an orderly fashion [5]. Since 2000, SOM has been widely applied for solving problems is capability of clustering and classification in the studies of water resources and aquatic ecology [15, 16].
The SOM consists of two layers viz. the input and output layers, which are connected with the weight vectors, and the output layer is displayed as a hexagonal lattice [5,
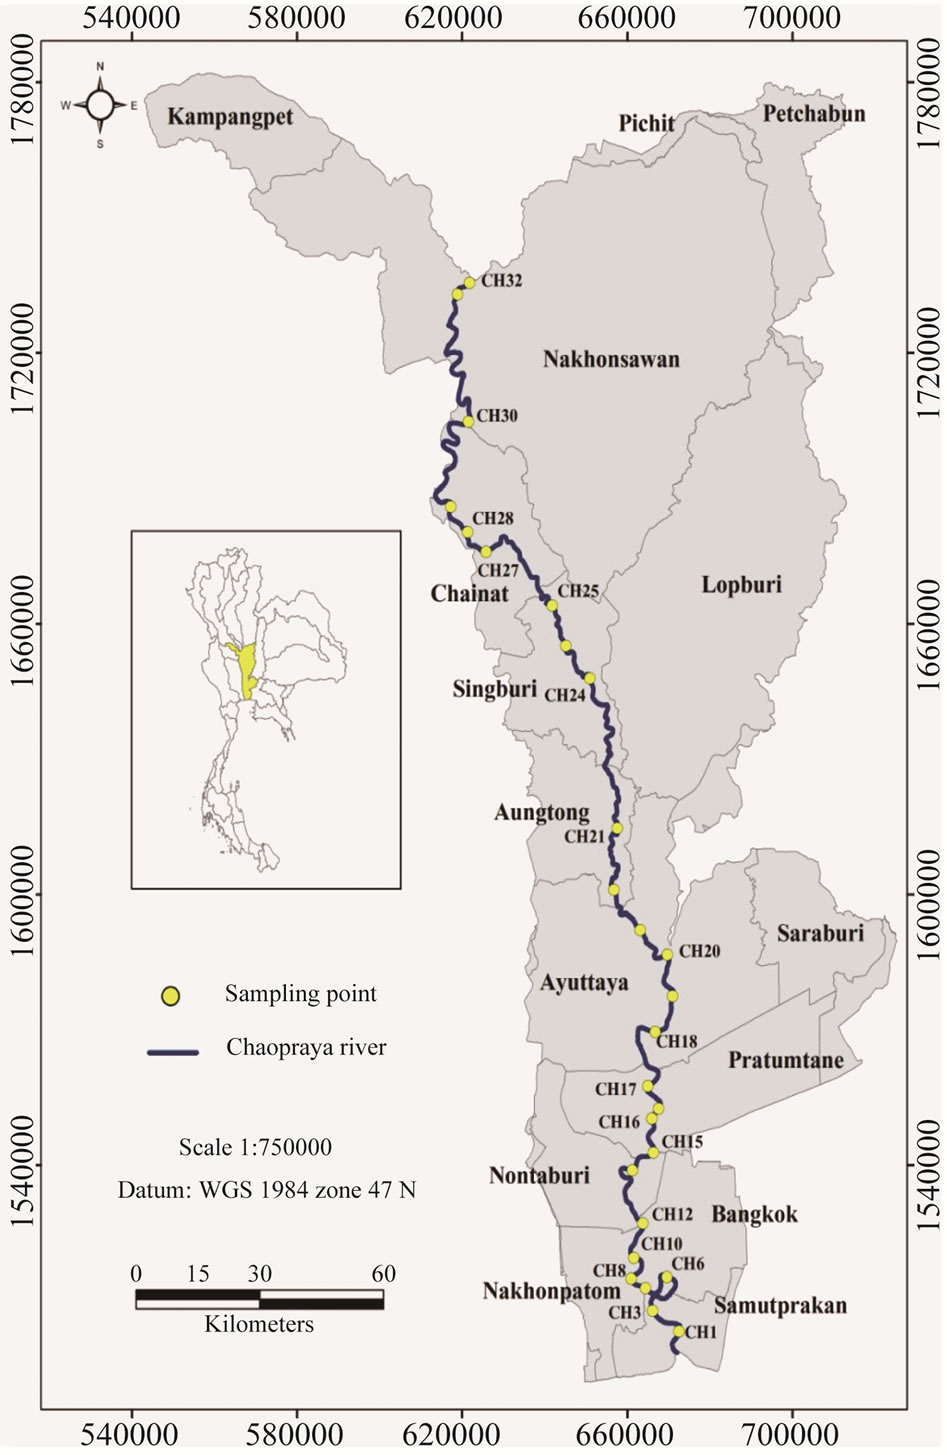
Figure 1. Location and map of the Chao Phraya River with the surface water stations.
15,16]. The principle of SOM analysis is to classify the sample vectors (SVs), described by a set of descriptors on the map according to the similarities between the descriptors (i.e. water quality parameters). During the learning process, two SVs that are similar (from the descriptor point of view) are classified in the same or neighboring cells, whereas two different SVs are classified in separated cells that could be distant from each other and vice versa [2,16]. The sequential algorithm used and the protocol for SOMs are widely described [14-16]. In this study, the input layer comprised 6 neuron connected to 327 observations (327 SVs). The output layer comprised 90 neurons organized in an array with 10 rows and 9 columns. This number of neurons was defined according to the formula 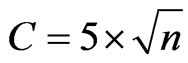 proposed by the laboratory of Computer and Information Science (CIS), Helsinki University, where C is the number of cells and n is the number of sample (i.e. observation) vectors [2,16]. This SOM map size was chosen because of its minimal topographic and quantization error as well as clear classification [14-16]. Meanwhile, the hierarchical cluster analysis (Ward linkage, Euclidean distance), was applied to help in the decision of making the clusters [2,16].
The analysis of similarity (ANOSIM) was used to test for significant difference among clusters by using occurrence probability, which is approximately estimated from the connection intensity of the SOM during the learning process. Statistical difference of each individual parameter was tested by means of analysis of variance (ANOVA) and Duncan’s post-test for multiple comparisons. The correspondence analysis (CoA), the best method to examine the interrelationship between environmental variables and sampling units, was used to determine that interrelationship between the clusters and water quality parameters [17]. The significance of the results was tested by a Monte-Carlo method with 1000 random permutations. The SOM was simulated and the cluster analysis was performed by MATLAB®, by using SOMtoolbox, which is developed by CIS [2]. Other statistical analyses were performed by Program R [18].
3. Results
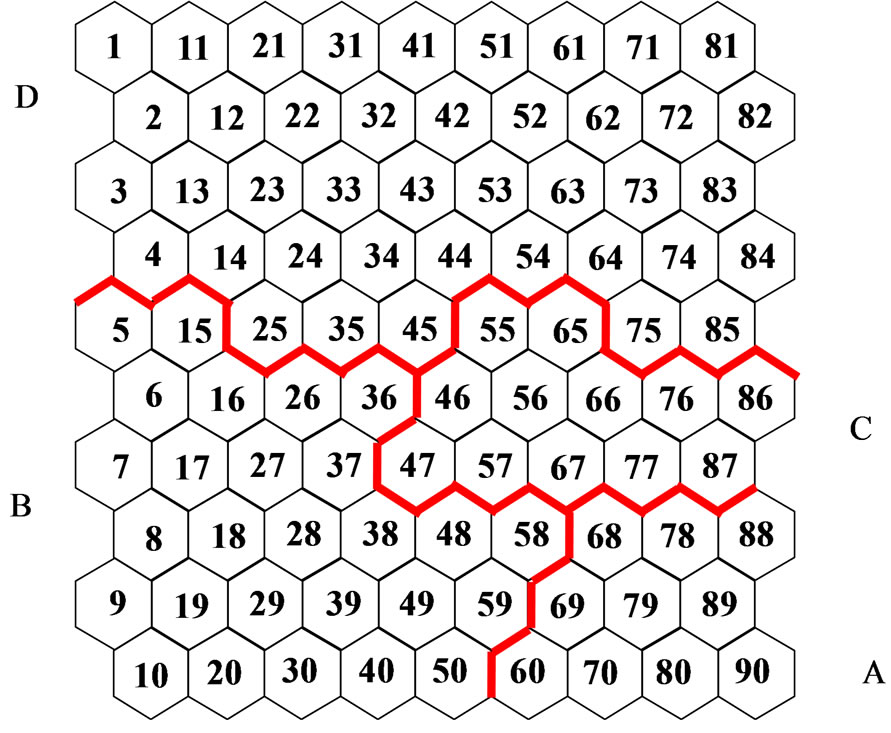
The observations were classified on the SOM-map according to similarity of water quality parameters presented in each observation and thus, similar observations were mapped close together and the dissimilar were mapped apart. It can be seen that the distribution of the observations on the map were scattered but visibly clustered according to the the hierarchical cluster analysis with Ward linkage method (Figure 2(a)), The outcomes of SOM were partitioned into four clusters (Figure 2(b)). From the clustering, it was obviously seen that clusters B and C were closed, meanwhile cluster A and D were clearly separated. The ANOSIM testing showed significant differences between clusters, i.e. similarity within clusters are more similar than between clusters (R = 0.41, P < 0.001, based on 1000 permutations).
It is found that the four clusters were clearly separated from each other as spatially approached, i.e. sectioned along the longitudinal gradient (Table 1). Ranges and average (±sd) of each water quality parameter in each cluster are presented in Table 2 and it is observed that, except for temperature, other water quality parameters in each cluster are statistically different. Cluster A belonged to the lower portion of the River connected to the river delta and contained almost all observations of stations CH1 to CH10 of the whole period of the dataset. The cluster was characterized by the significantly lowest DO and highest in BOD and NH3-N (P < 0.05) compared to the other clusters. Observations belonging to Cluster B, were spatially ubiquitous and showed a complex pattern along the whole river-course and also varied temporally. This cluster was highlighted by significantly high values of TCB and FCB (P < 0.05). Cluster C included most of the observations of the stations located in the upstream parts of the lower portion of Chao Phraya River, i.e. stations in CH12-CH18. The water quality condition in this cluster was slightly better than cluster A, as judged by the levels of DO, BOD and NH3-N but still worse than the other remaining 2 clusters. However, the TCB and FCB levels in this cluster were lower than cluster B. Cluster D was mostly the observations of the surface water stations from station 16 and further north up to the source of the Chao Phraya River, i.e. station CH32. This cluster can be regarded as having the best water quality condition, when compared to the other clusters, with the highest level of DO and the lowest levels of BOD, TCB, FCB and NH3-N. In summary, it can be said that the observations in cluster A showed the worst in water quality condition and then the improving conditions were shown in the clusters B, C and D, respectively.
 (a)
(a)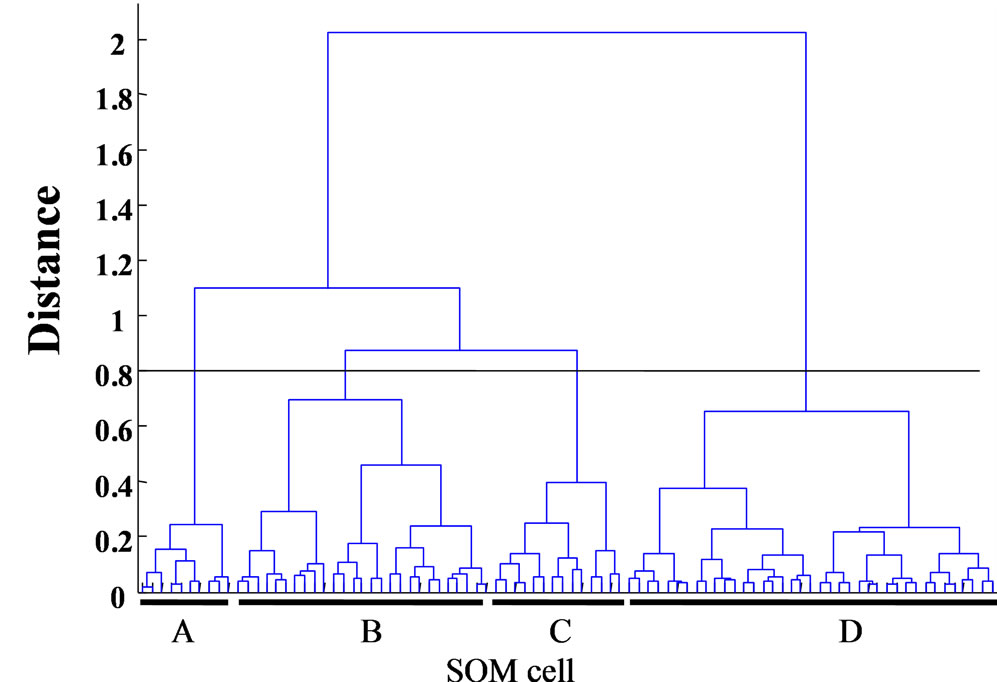 (b)
(b)
Figure 2. Results of SOM analysis. (a) Classification of observations on SOM using water quality data (see also Table 1) and (b) Dendrogram of the SOM output, showing groups of similarity of cells on SOM.
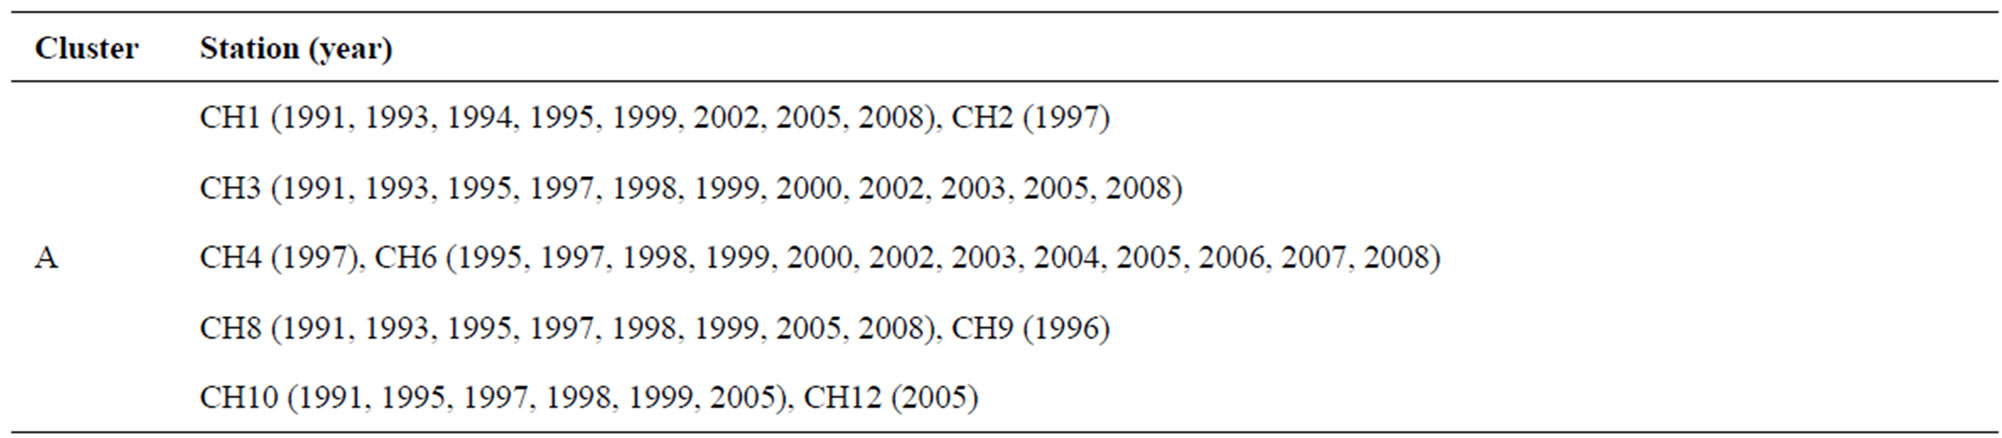
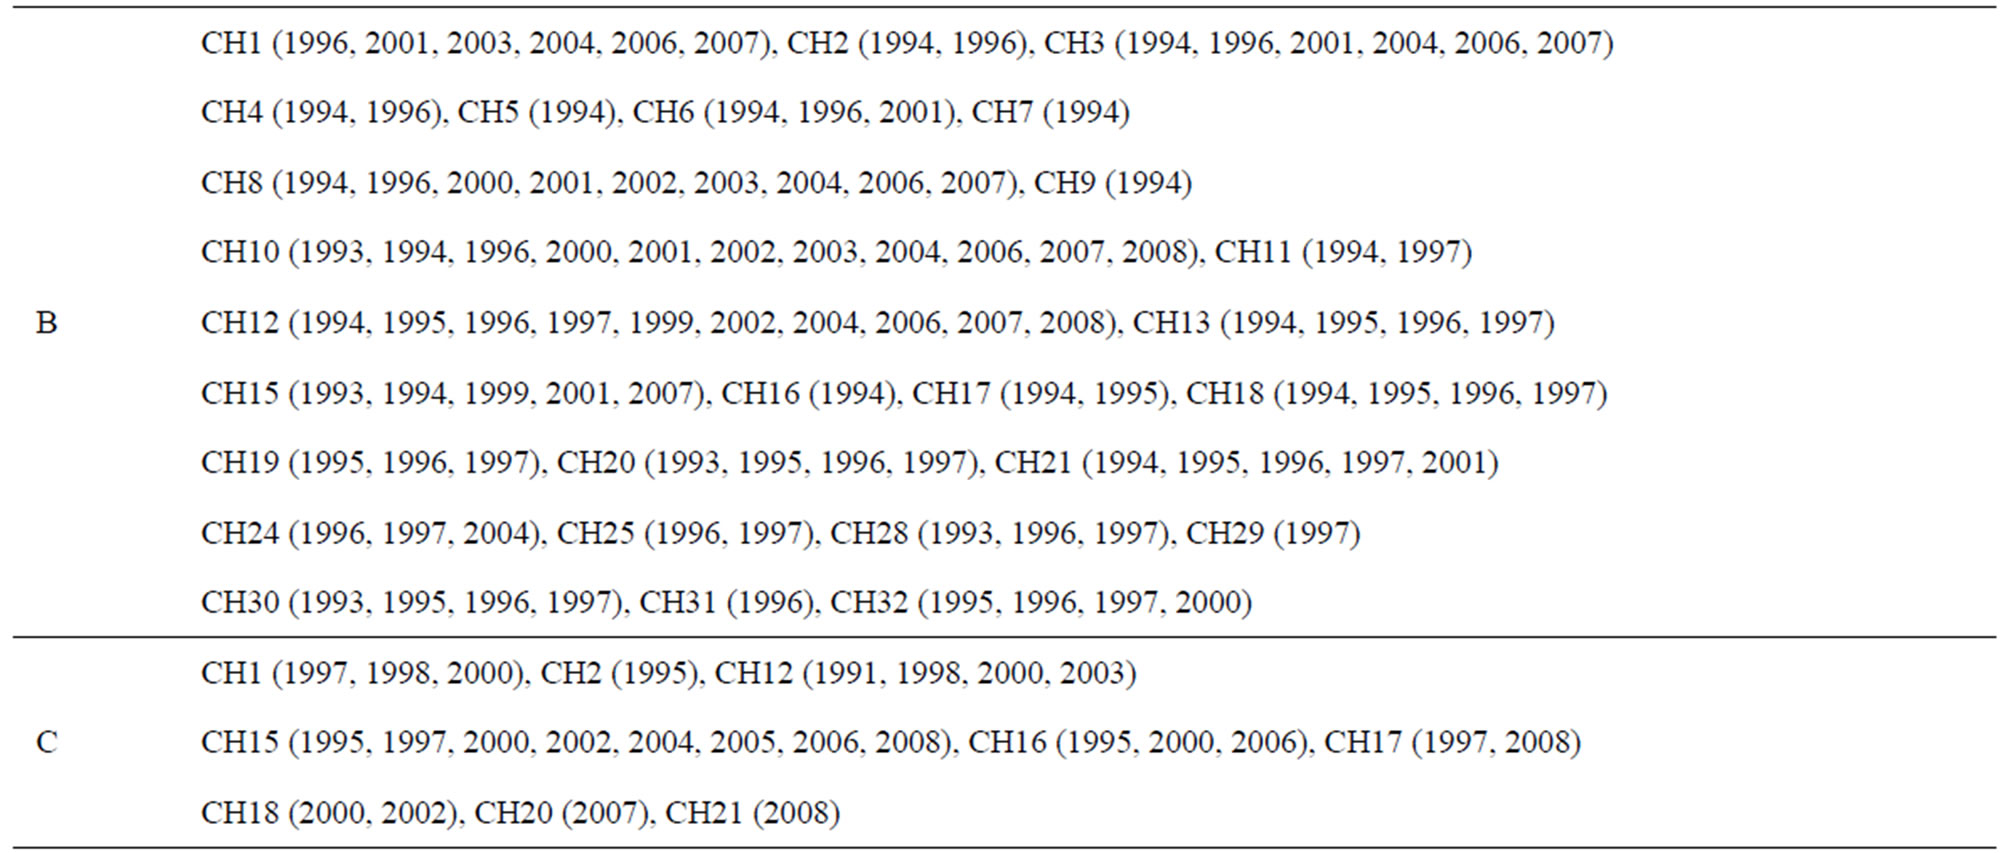
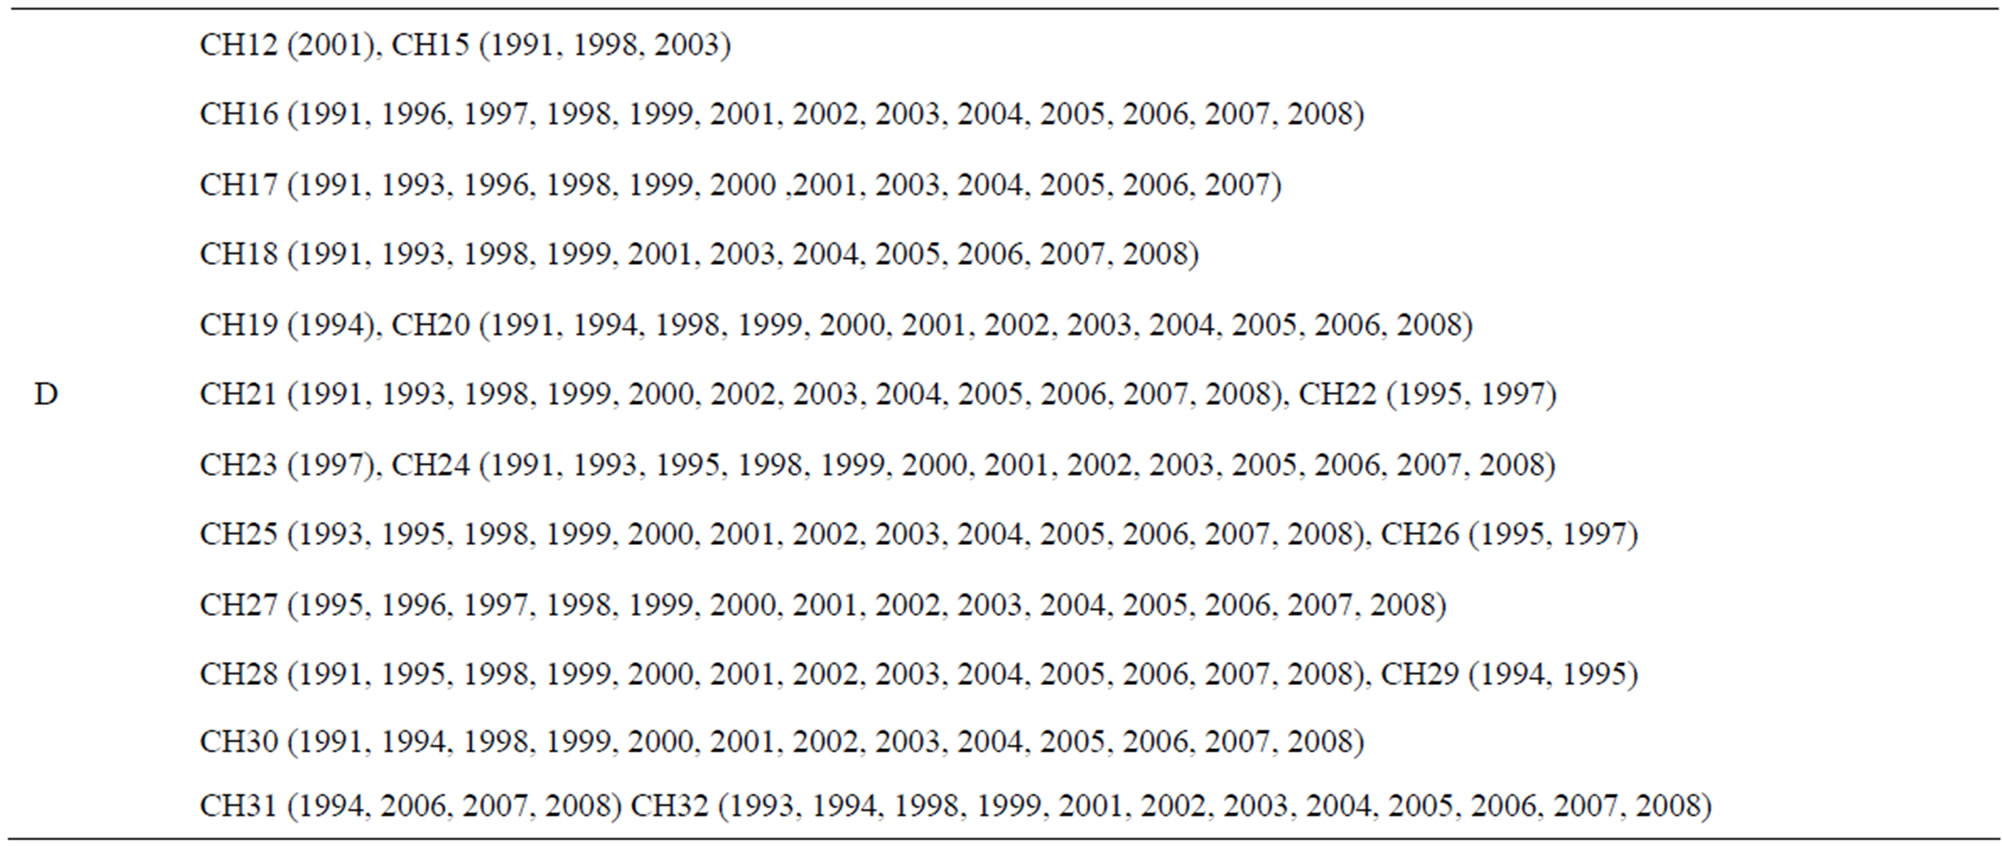
Table 1. Observations (station × year), belonged to each cluster, after SOM analysis.
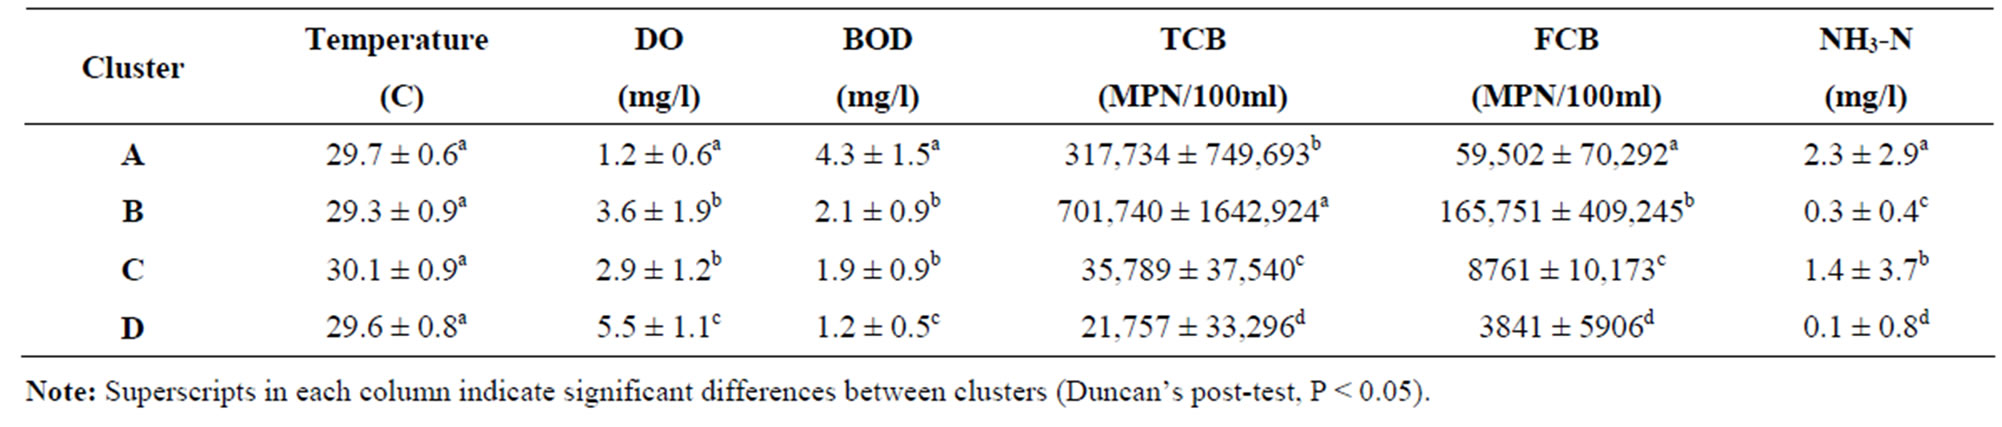
Table 2. Mean value (±SD) of the six selected water quality parameters in each cluster.
In terms of temporal approach, some particular stations showed a trend of better conditions, such as station CH30 (Figure 3(a)), or vice versa, such as station CH15 (Figure 3(b)). However, most of the surface water stations were stuck to one particular cluster, i.e. no trend to better or worse in water quality of the station, during the whole monitoring period (Table 1). The Monte Carlo test revealed significant relations among the water quality parameters (Monte-Carlo testing, 1000 permutations, P < 0.001), when applying CoA. The ordination by CoA showed that only the observations belonging to cluster A were obviously separated, while the observations of the remaining three clusters were overlapped to some degree (Figure 4). This implies that the water quality of the “very poor condition” surface stations was highly separated from the others. The “short-arm” length of temperature compared to the other water quality parameters, implies low fluctuations in annual average water temperature during the study period. Cluster A showed the most fluctuation in terms of average temperature, however the differences were less than ±2˚C in each cluster during the whole study period (Figure 5).
4. Discussion
Different rates of anthropogenic stress along the river course result in different water quality conditions in any particular site and period. The results of this study reveal a clear spatial variation in water quality along the Chao Phraya River. The analyses were conducted by means of multivariate procedures, which have been proved to be more suitable for the complicated nature of pollutioninduced ecological disturbances [2,16,17,19] and they have been successfully applied in environmental quality assessment and management [15,16,19]. Moreover, applying the univariate approach (e.g. WQI) for water quality monitoring always have low interpreting value for decision makers [5,19], because they want to know which water quality parameter should be of the most concern in any particular site.
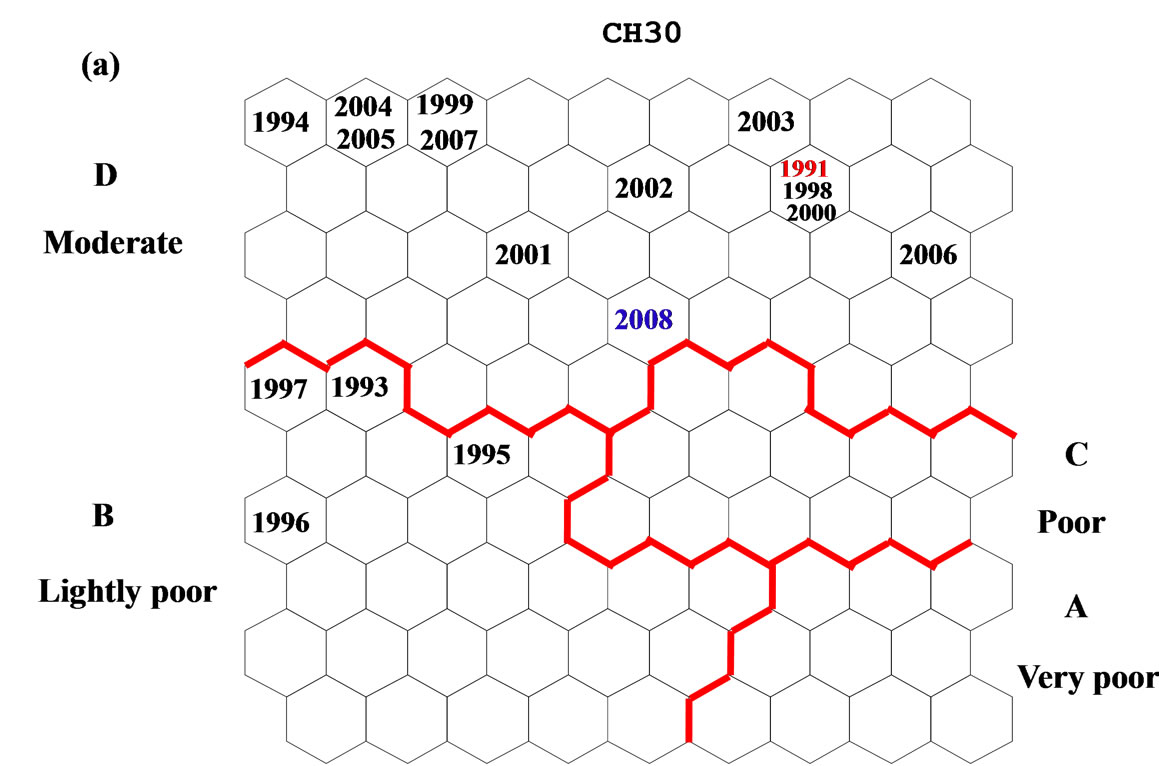
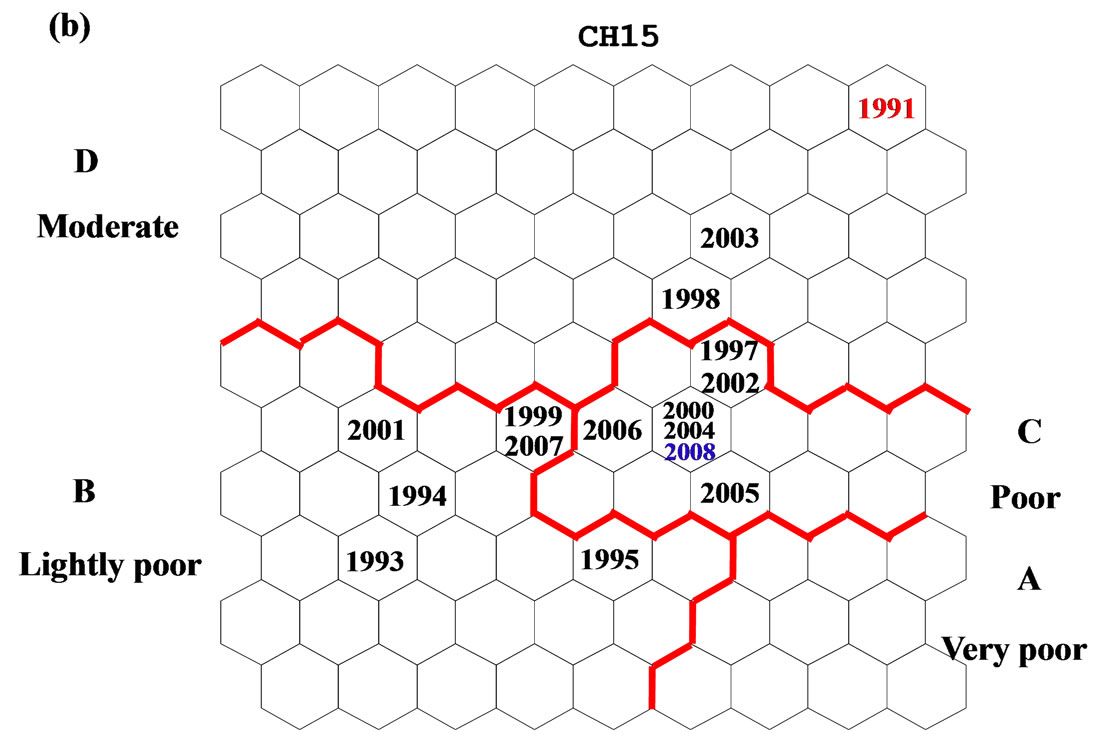
Figure 3. Temporal representation of the example stations shift in the SOM map between 1991 and 2008 (a) CH30, from lightly poor to moderate and (b) CH15 from moderate to poor.
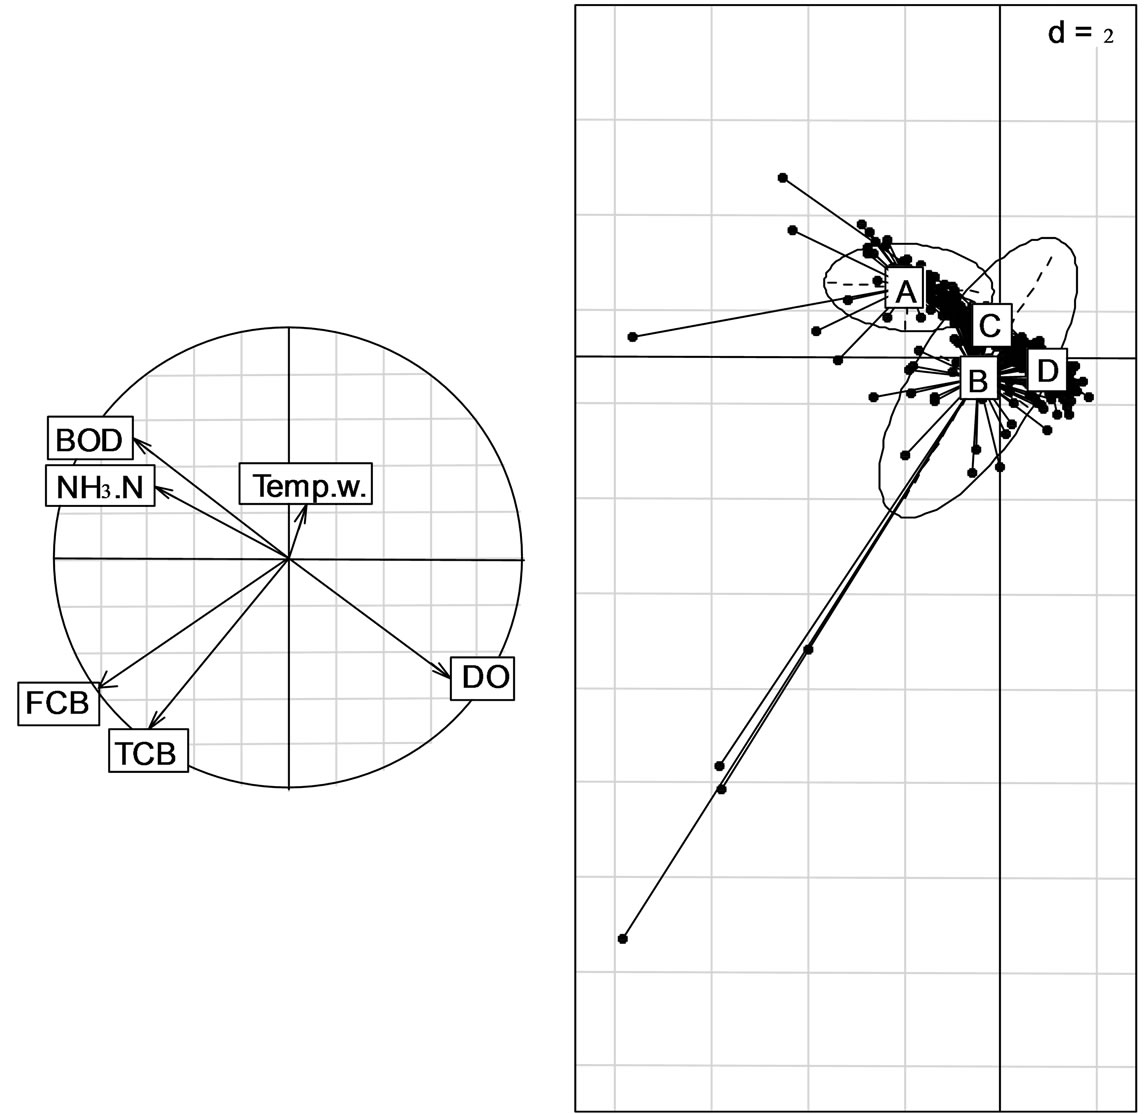
Figure 4. Result from CoA showed the gradients of 6 selected water quality parameters to the observations of each cluster.
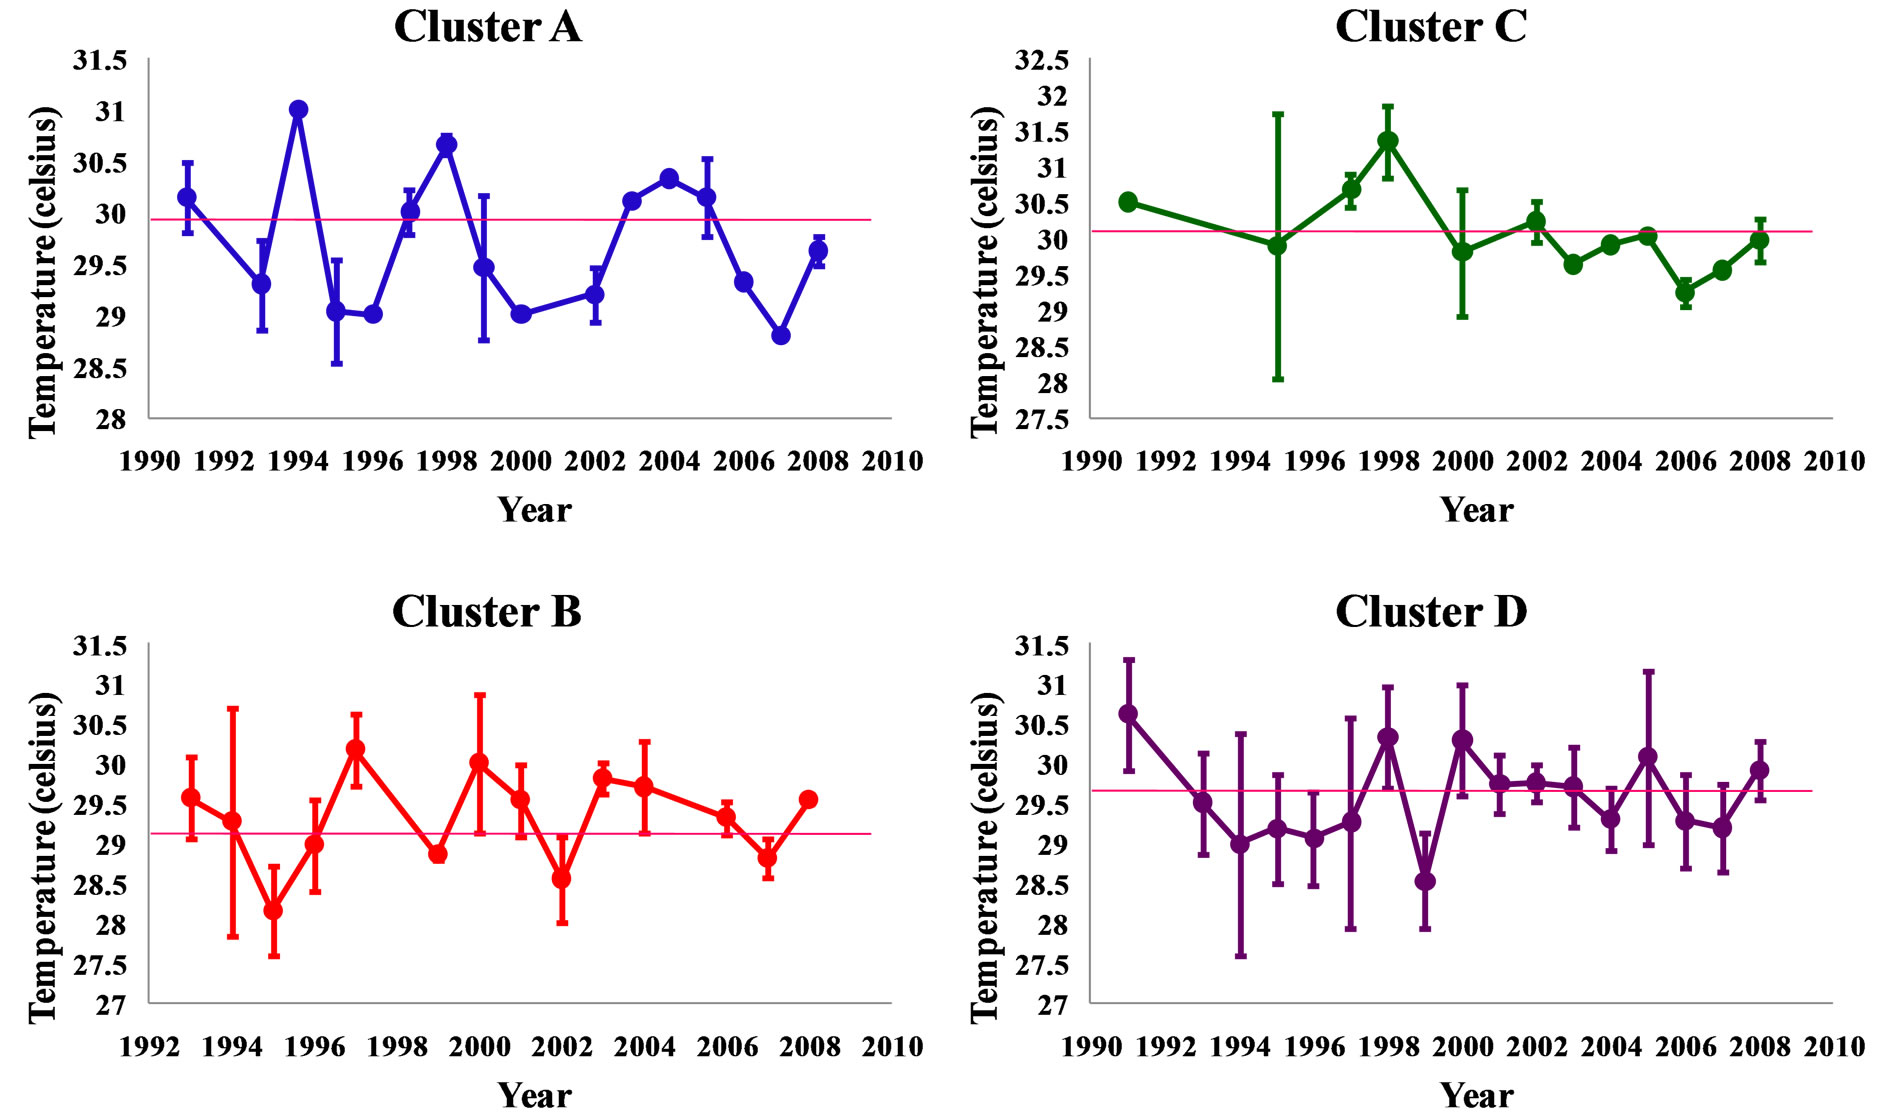
Figure 5. Fluctuations of the annual average water temperature in each cluster between 1991 and 2008.
Because of the dense population in the lowland of the Central plain [12], poor water quality condition in the lower portion of the river is common and found not only in Chao Phraya River (i.e. cluster A) but also the other rivers in the region, i.e. Bangpakong [13], Mae Klong [20] and Tha Chin [21], in which all selected parameters, except temperature, were below the national standard of surface water quality of Thailand at the lowest level, i.e. fairly clean used [22]. Municipal wastes and untreated industrial effluents are the main sources in decreasing the DO level and increasing BOD level. Moreover, contaminants from the industries (e.g. chemical agents and heavy metal) also caused a reduction in DO and are increase in BOD in the lower Chao Phrya River [23,24]. Meanwhile, high NH3-N and derivatives are commonly loaded from surrounding agricultural land uses [20,21].
FCB and TCB are commonly used indicators of sanitary quality of the water, especially wastes from human and warm-blooded animals [25]. Apart from cluster A, FCB and TCB in cluster B were very far beyond the criteria for “fairly clean used” water quality standard in Thailand i.e. 4000 and 20,000 MPN/100 ml, respectively [22]. The extensive scattering of the observations from cluster B imply the tremendous increase of coliform bacteria along the Chao Phraya river course compared to the data during 1980s, where the high values of FCB and TCB were limited to the lower portion [26].
Reduction in DO along the river course (i.e., from clusters D to A) is also related to the flow condition in the river and seasonal effects [27,28]. The high influx of freshwater during the monsoon season may have led to marked dilution of the stream resulting in a significant increase in DO levels while the reverse occurred in the dry season [28]. The natural river flow system in the Chao Phraya is likely to be changed in the near future according to the plan for flood protection in the central plain of the country after the big flood in 2011 [29]. Good condition of water quality in cluster D, in which all parameters were in the range of the “very clean used” criteria [22] related to the fact that the land uses of the upper portion are still sparsely urbanized [12,22] and also due to dilution from the mass of water from the four upper tributaries [12].
Although the low fluctuation in average water temperature was observed, this parameter must be approached cautiously and closely monitored. Climate change is also expected to have some effects with increasing temperatures and changed rainfall patterns. The average maximum daily temperature in the central plain of the country in 2030 is estimated at 40˚C, with the baseline about 35˚C [30]. Meanwhile the precipitation rates are expected to be higher but also more intense falling in a shorter time [30]. An increase in air temperature resulted in an increase in biological oxygen demand, coliform bacteria and suspended solids, and a decrease in dissolved oxygen, which eventually has a deteriorating effect on water quality in the river [31,32] then eventually aquatic biota and human.
5. Conclusion
Distinct spatial differences in water quality along the Chao Phraya River were clearly identified and highly related to anthropogenic stresses. However, there was no clear temporal trend for most of surface water stations, either positive or negative. Nonetheless, as the purpose to provide a big picture, the results were still insufficient to provide the detail in terms of inter-annual variation in water quality of the river. Thus, further studies on the inter-annual variation of water quality of the Chao Phraya River should be focused in the next step.
6. Acknowledgements
The authors wish to thank Pollution Control Department of Thailand for providing the data. P. Avakul would like to thank the Faculty of Agriculture, Ubon Ratchathani University for granting him a Ph.D. Research grant. The authors also thank Mr. Norman Mangnall, Faculty of Agriculture, Ubon Ratchathani University, for editing the English of the manuscript.
REFERENCES
- Mekong River Commission, “An Assessment of Water Quality in the Lower Mekong Basin,” MRC Technical Paper No.19, Mekong River Commission, Vientiane, 2008.
- L. Tudesque, M. Gevrey, G. Grenouillet and S. Lek, “Long-Term Changes in Water Physicochemistry in the Adour-Garonne Hydrographic Network during the Last Three Decades,” Water Research, Vol. 42, No. 3, 2008, pp. 732-742. doi:10.1016/j.watres.2007.08.001
- O. Altansukh and G. Davaa, “Application of Index Analysis to Evaluate the Water Quality of the Tuul River in Mongolia,” Journal of Water Resource and Protection, Vol. 3, No. 6, 2011, pp. 398-414. doi:10.4236/jwarp.2011.36050
- A. M. Rabee, B. M. Abdul-Kareem and A. S. Al-Dhamin, “Seasonal Variations of Some Ecological Parameters in Tigris River Water at Baghdad Region, Iraq,” Journal of Water Resource and Protection, Vol. 3, No. 4, 2011, pp. 262-267. doi:10.4236/jwarp.2011.32011
- V. Simeonov, P. Simeonova, S. Tsakovski and V. Lovchinov, “Lake Water Monitoring Data Assessment by Multivariate Statistics,” Journal of Water Resource and Protection, Vol. 2, No. 4, 2010, pp. 353-361. doi:10.4236/jwarp.2010.24041
- N. Ozaki, T. Fukushima, H. Harasawa, T. Kojiri, K. Kawashima and M. Ono, “Statistical Analyses on the Effects of Air Temperature Fluctuations on River Water Qualities,” Hydrological Processes, Vol. 17, No. 14, 2003, pp. 2837-2853. doi:10.1002/hyp.1437
- P. K. Naik and D. A. Jay, “Distinguishing Human and Climate Influences on the Columbia River: Changes in Mean Flow and Sediment Transport,” Journal of Hydrology, Vol. 404, No. 3-4, 2011, pp. 259-277. doi:10.1016/j.jhydrol.2011.04.035
- L. Prathumratana, S. Sthiannopkao and K. W. Kim, “The Relationship of Climatic and Hydrological Parameters to Surface Water Quality in the Lower Mekong River,” Environment International, Vol. 34, No. 6, 2008, pp. 860- 866. doi:10.1016/j.envint.2007.10.011
- H. A. J. Senhorst and J. J. G. Zwolsman, “Climate Change and Effects on Water Quality a First Impression,” Water Science and Technology, Vol. 51, No. 5, 2005, pp. 9-53.
- Office of Natural Water Resources Committee of Thailand, “Chapter 16—Chao Phraya River Basin, Thailand,” the 1st UN World Water Development Report, Water for People, Water for Life, UNESCO, Paris, 2003, pp. 1-16.
- A. Suvarnaraksha, “Biology of Two Keystone Fishes, the Modeling Approaches and Fish Assemblage Patterns in Tropical River Basin: Case Study of Ping River Basin, Thailand,” Ph.D. Thesis, Ubon Ratchathani University, Ubon Ratchathani, 2011.
- W. Simachaya, P. Watanamahart, V. Kaewkrajang and A. Yenpiem, “Water Quality Situation in the Chao Phraya Delta,” In: The Chao Phraya Delta, Historical Development, Dynamics and Challenges of Thailand’s Rice Bowl, Bangkok, 12-15 December 2000, pp. 1-21.
- A. A. Bordalo, W. Nilsumranchit and K. Chalermwat, “Water Quality and Uses of the Bangpakong River (Eastern Thailand),” Water Research, Vol. 35, No. 15, 2001, pp. 3635-3642. doi:10.1016/S0043-1354(01)00079-3
- T. Kohonen, “Self-Organized Formation of Topologically Correct Feature Maps,” Biological Cybernetics, Vol. 43, No. 1, 1982, pp. 59-69.
- A. M. Kalteh, P. Hjorth and R. Berndtsson, “Review of the Self Organizing Map (SOM) Approach in Water Resources: Analysis, Modeling and Application,” Environmental Modelling & Software, Vol. 23, No. 7, 2008, pp. 835-845. doi:10.1016/j.envsoft.2007.10.001
- S. Lek and J. F. Guegan, “Artificial Neural Networks: Application to Ecology and Evolution,” Springer Verlag, Berlin, 2000.
- Y. Li, L. Xu and S. Li, “Water Quality Analysis of the Songhua River Basin Using Multivariate Techniques,” Journal of Water Resource and Protection, Vol. 2, No. 8, 2009, pp. 110-121. doi:10.4236/jwarp.2009.12015
- R Development Core Team, “R: A Language and Environment for Statistical Computing,” R Foundation for Statistical Computing, Vienna, 2009.
- P. A. Aguilera, A. G. Frenich, J. A. Torres, H. Castro, J. L. Martinez Vidal and M. Canton, “Application of the Kohonen Neural Network in Coastal Water Management: Methodological Development for the Assessment and Prediction of Water Quality,” Water Research, Vol. 35, No. 17, 2001, pp. 4053-4062. doi:10.1016/S0043-1354(01)00151-8
- B. Thongdonphum, S. Meksumpun and C. Meksumpun, “Nutrient Loads and Their Impacts on Chlorophyll a in the Mae Klong River and Estuarine Ecosystem: An Approach for Nutrient Criteria Development,” Water Science & Technology, Vol. 64, No. 1, 2011, pp. 178-188. doi:10.2166/wst.2011.515
- S. Meksumpun and C. Meksumpun, “Integration of Aquatic Ecology and Biological Oceanographic Knowledge for Development of Area-Based Eutrophication Assessment Criteria Leading to Water Resource Remediation and Utilization Management: A Case Study in Tha Chin, the Most Eutrophic River of Thailand,” Water Science & Technology, Vol. 58, No. 12, 2008, pp. 2303- 2311. doi:10.2166/wst.2008.929
- W. Simachaya, “Water Quality Management in Thailand,” Workshop on Environmentally Sound Technology on Water Quality Management UNEP, Mekong River Commission, November 2000.
- C. Pholprasert, “Heavy Metal Pollution in the Chao Phraya River Estuary, Thailand,” Water Research, Vol. 16, No. 6, 1982, pp. 775-784. doi:10.1016/0043-1354(82)90004-5
- C. Kunacheva, S. Tanaka, S. Fujii, S. Boontanon, C. Musirat and T. Wongwattana, “Determination of Perfluorinated Compounds (PFCs) in Solid and Liquid Phase River Water Samples in Chao Phraya River, Thailand,” Water Science & Technology, Vol. 64, No. 3, 2011, pp. 684-692. doi:10.2166/wst.2011.686
- C. J. A. Campos and R. A. Cachola, “Faecal Coliforms in Bivalve Harvesting Areas of the Alvor Lagoon (Southern Portugal): Influence of Seasonal Variability and Urban Development,” Environmental Monitoring and Assessment, Vol. 133, 2007, pp. 31-41. doi:10.1007/s10661-006-9557-2
- S. Mimamara and C. L. Sales, “Water Quality Management of the Chao Phraya River (a Case Study),” Environmental Technology, Vol. 15, No. 6, 1994, pp. 501-516. doi:10.1080/09593339409385457
- D. Voutsa, E. Manoli, C. Samara, M. Sofoniou and I. Stratis, “A Study of Surface Water Quality in Macedonia, Greece: Speciation of Nitrogen and Phosphorus,” Water Air and Soil Pollution, Vol. 129, 2001, pp. 13-32. doi:10.1023/A:1010315608905
- A. Qadir, R. N. Malik and S. Z. Husain, “Spatio-Temporal Variations in Water Quality of Nullah Aik-Tributary of the River Chenab, Pakistan,” Environmental Monitoring and Assessment, Vol. 140, 2008, pp. 43-59. doi:10.1007/s10661-007-9846-4
- K. Auynirundronkool, N. Chen, C. Peng, C. Yang, J. Gong and C. Silapathong, “Flood Detection and Mapping of the Thailand Central Plain Using RADARSAT and MODIS under a Sensor Web Environment,” International Journal of Applied Earth Observation and Geoinformation, Vol. 14, No. 1, 2012, pp. 245-255. doi:10.1016/j.jag.2011.09.017
- K. Boonprakrob and S. Hattirat, “Crisis or Opportunity: Climate Change Impacts and Thailand,” Greenpeace Southeast Asia, 2006.
- N. Ozaki, T. Fukushima, H. Harasawa, T. Kojiri, K. Kawashima and M. Ono, “Statistical Analyses on the Effects of Air Temperature Fluctuations on River Water Qualities,” Hydrological Processes, Vol. 17, No. 4, 2003, pp. 2837-2853. doi:10.1002/hyp.1437
- M. M. Al-Jebouri and M. H. Edham, “An Assessment of Biological Pollution in Certain Sector of Lower AL-Zab and River Tigris Waters Using Bacterial Indicators and Related Factors in Iraq,” Journal of Water Resource and Protection, Vol. 4, No. 1, 2012, pp. 32-38. doi:10.4236/jwarp.2012.41005
NOTES
*Corresponding author.