Journal of Water Resource and Protection
Vol.4 No.2(2012), Article ID:17424,6 pages DOI:10.4236/jwarp.2012.42009
Heavy Metal Distributions in Water of the Aras River, Ardabil, Iran
1Department of Environment and Energy, Science and Research Branch, Islamic Azad University, Tehran, Iran
2Department Agronomy and Plant Breeding, Islamic Azad University, Ardabil Branch, Ardabil, Iran
Email: {*f.nasehi, monavarism, a.b.karbassi}@yahoo.com, {ahhassani, aa.imani}@gmail.com, Khorasan@ut.ac.ir
Received November 1, 2011; revised December 3, 2011; accepted January 7, 2012
Keywords: Aras; Distribution; Heavy; Iran; Metals; River; Water
ABSTRACT
Aras (situated on the frontier river) is one of Iran’s important rivers which is situated on the west North of the country. The concentration of heavy metals in this river was studied around Ardabil province during the 1389 in all four seasons (spring, summer, autumn, winter). The cluster analysis technique with the help of the results gained from density of metals like (Zn, Cu, Fe, Hg, Ni, Pb, Cd) was used in the water of Aras river for classifying quality of the river. According to the gained results from the cluster analysis, the stations were divided into three groups with high pollution (HP), medium pollution (MP) and low pollution (LP). In general, S3, S5 stations with high pollution, S2, S4 stations with medium pollution and S1 station with low pollutions are classified in the water of Aras River.
1. Introduction
About 60 km of Aras River is situated in north part of Ardabil province, between Aslandouz to Tazeh kand in Parsabad.
Creating deviation band of Mill Moghan and following that establishing irrigation networks in Moghan has caused this region to be one of the main agricultural poles of the country.
So every kind of agricultural activity is done in this area. In general, nowadays, the most important pollution sources, overlooking Aras river is in Ardabil, including: agriculture, city and village waste waters, rubbish, Industrial waste water (industrial town of parsabad) and marine nourishment that have been situated at different parts of this wide area. In recent years, with everyday development of human activities in the countries around Aras river, the probability of ecosystem changes is not an odd idea [1,2]. Interring chemical damages into area are often because of a mixture of natural and anthropogenic matters [3]. Industrial and agricultural waste water, city waste water, mines and extra materials of heavy metals are evacuated into rivers and seas at last. A part of metal as solution, apart as suspended sediment and a part as river—bed, is carried and entered the area [4]. The metals in the first two phases, are available and before being as sediment are moved easily and enter the food web. If high dose of a heavy metal enter the food web, a live creatures can react to the availability of it in different ways [5-7]. Because of this point, concentration of some of heavy metals in Greenland, sea creatures has been studied and the results showed that the density of these elements in sea creatures is more than the density of land ecosystem and more important that they found density of (Hg, Fe, Cd) in higher food levels increases, it means biological accumulation happens [8]. Also, According to these results, the relation between diseases wide spreading and density of heavy metals has been studied [1,9].
Since, Aras River is one of the rare and various habitat of the country. Any kind of pollution in it will affect the existent variety of the river. On the other hand, this river water is used for agriculturing and norishing the fish of the province [10]. Thus, for estimating the amount of heavy metals entrance to the river and finally to the water of seas and lakes, measuring and estimating heavy metals concentration in the water of river is essential. In this point, for studying the condition of river pollution and spotting the affect of polluting sources an it, the amount of heavy metals in the Aras water in different stations around Ardabil province, (from the entrance to the province to its exit) was studied. In this research, seven heavy metals (Hg, Cd, Zn, Cu, Fe, Pb) have been studied in the water of Aras river.
2. The Study Region
Aras River is a frontier river with the length of 1072 km, which 460 km of it is at the common borderline of Iran and Armenia and Azerbaijan [11]. Aras is as the vital river of the region and the main source for Moghan irrigation. From the slope of Bina Gul Dagh Mountains, Turkey source, and the total water shed is 100,220 square km.
In normal years, the maximum of the measured debi in Aras is about 1100 cub meter per second in dam which is used as a tank (north of Makou) and 2600 cub meter per second in deviant dam of Mill and Moghan, that these numbers in dry years, change respectively to 32 and 180 cub meter per second.
3. The Method
For choosing a situation for sampling, besides providing topography and geology maps, the most important sources of pollutions and the exit ways of their waste water that are ending to Aras River, has been studied. Regarding the above mentioned cases and thinking of the ways to the river (For its being a frontier river) five stations were chosen for sampling. The station 1, Mill Moghan dam (the entrance of Aras into Ardabil), station 2 after Darre roud joining to Aras, Station 3 after Gouri chay joining to Aras, station 4 (Oltan) Parsabad industrial town shoal and station 5 (Tazeh kand village) the exit of Aras from Iran (Figure 1).
Water sample were chosen from the depth of 20 cm under water and were put in polyetilen dishes [12]. Immediately after collecting water sample, the suspended materials were separated by using special filters which one good for separating articles bigger than 45 percent micrometer, because the suspended and colloidal articles affect the chemical analysis results of water [2].
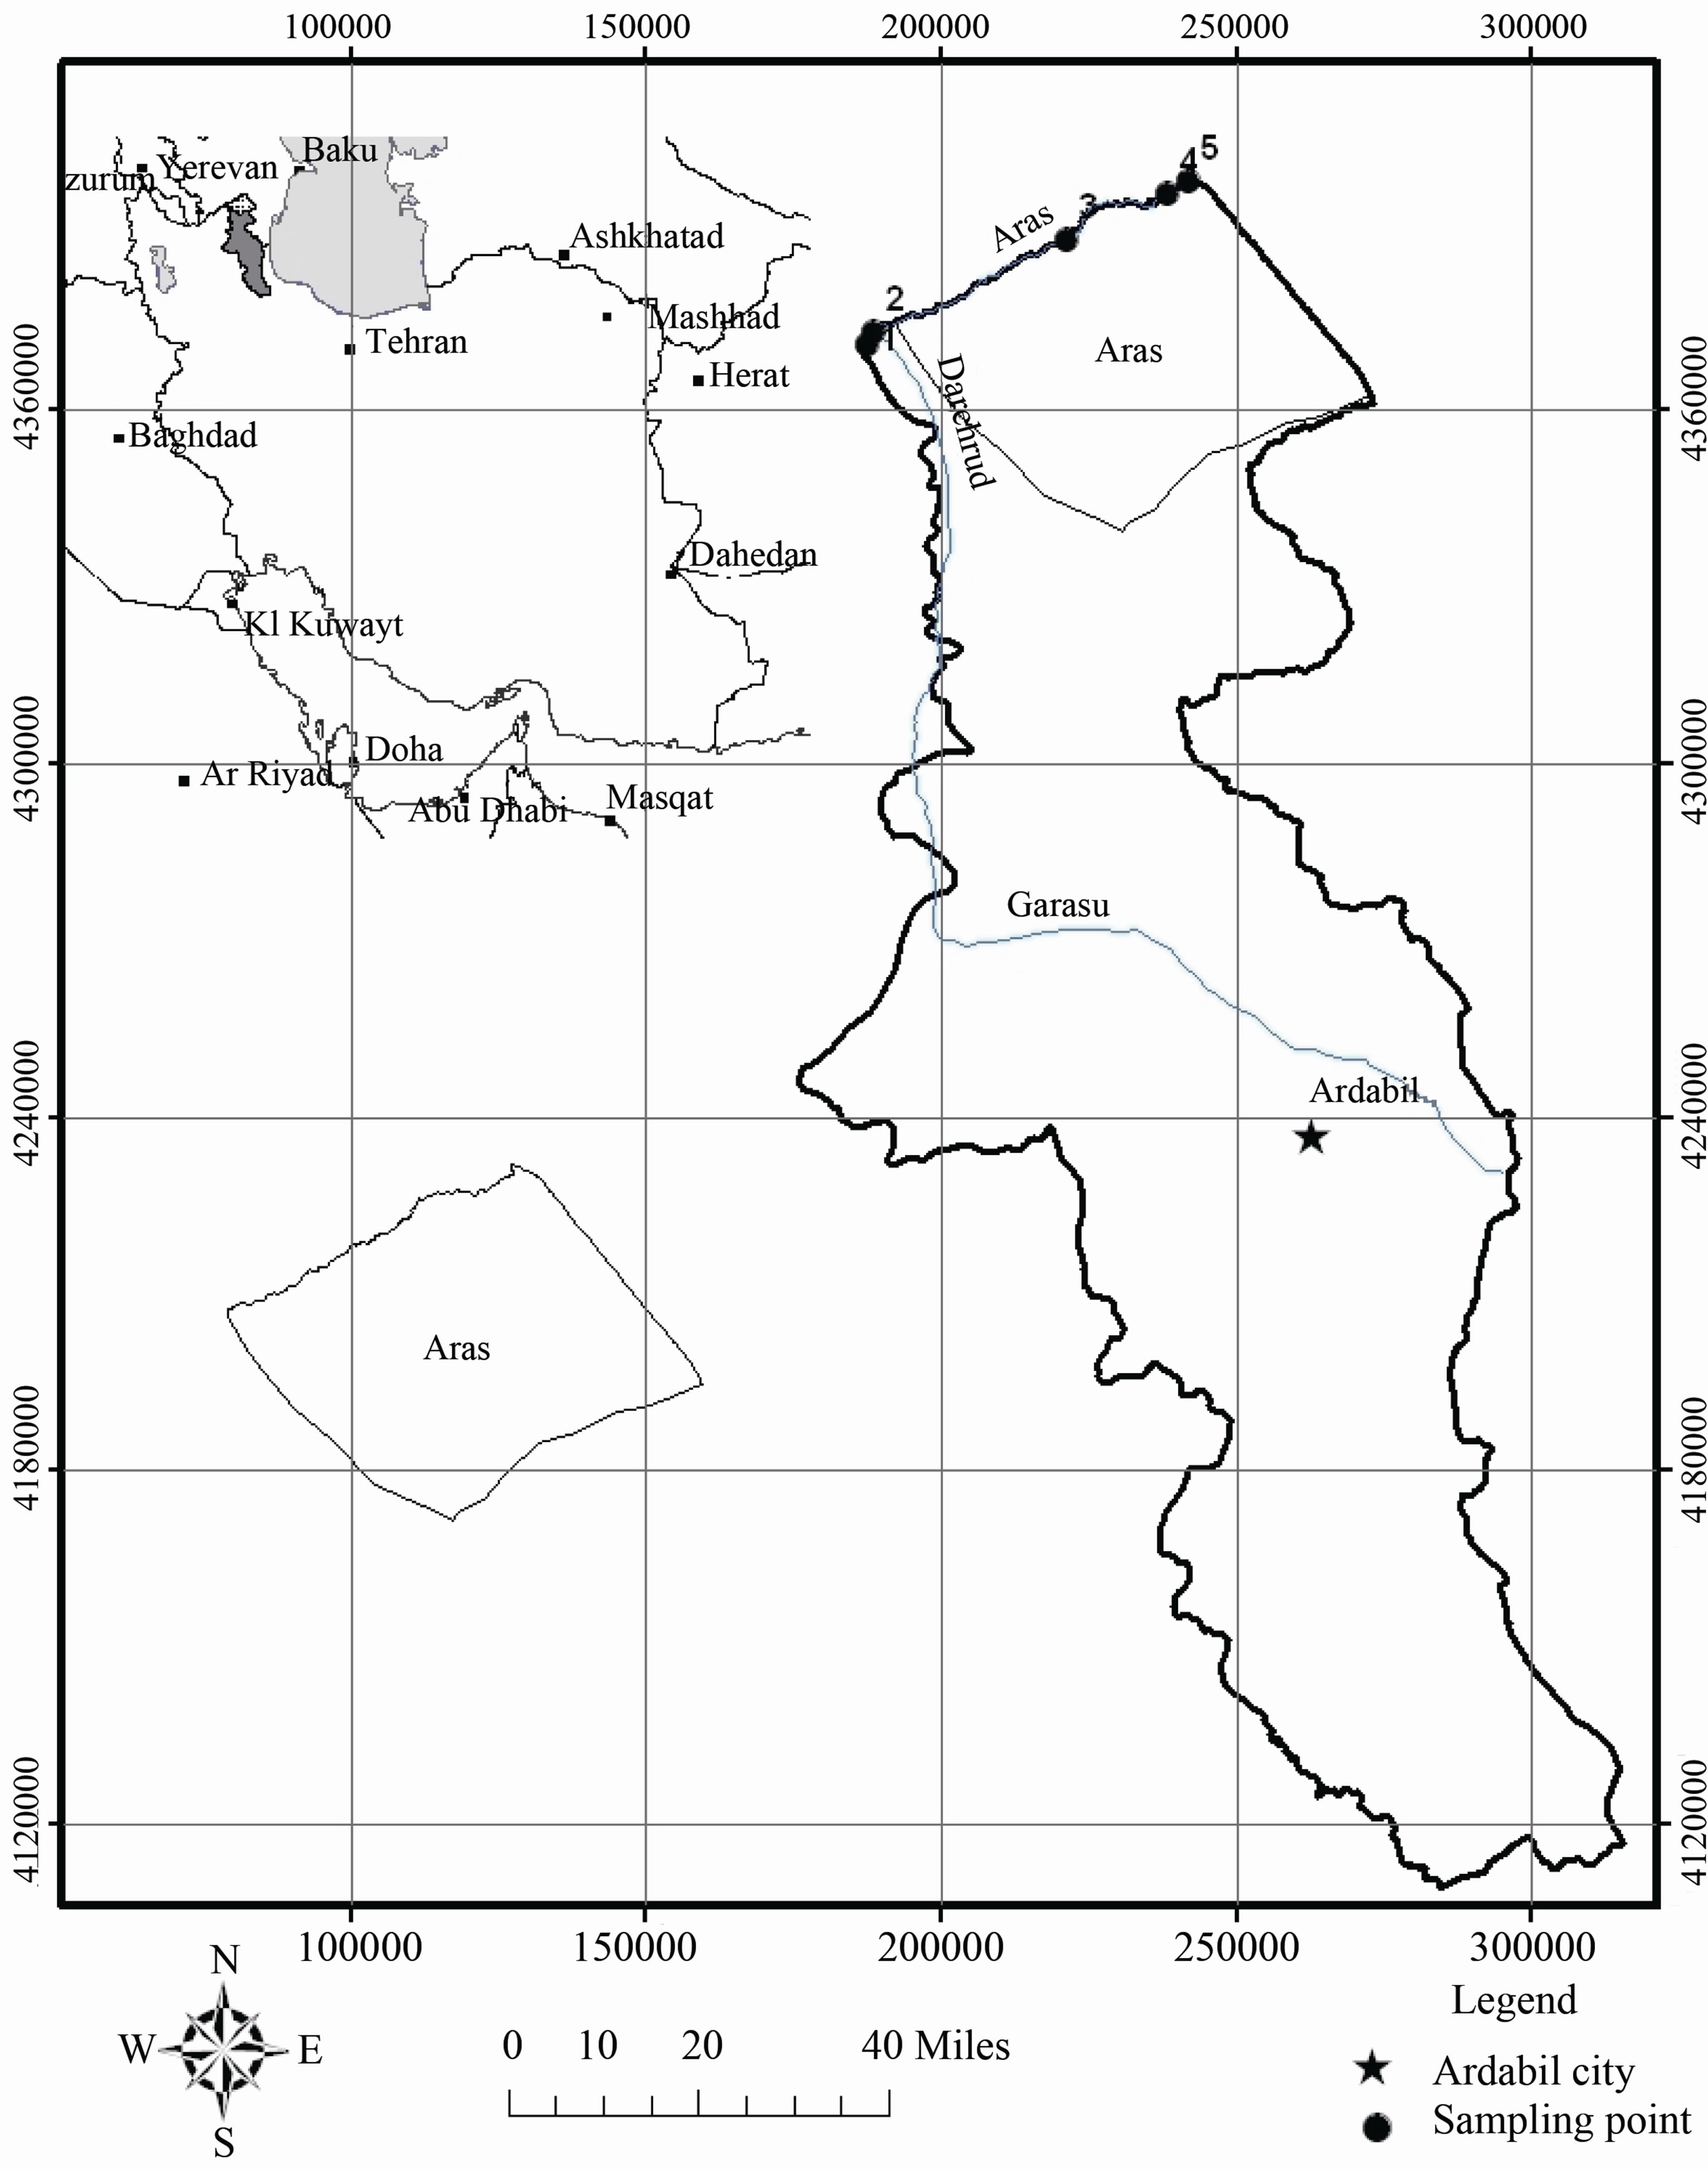
Figure 1. Sampling stations within the study area.
After straining the water in the operation place, water got acidic. Measuring metals in the water of four seasons, spring, summer, autumn and winter, was done. The sample of spring was done in the first half of Jun, summer in the second half of August, autumn in the second half of November and winter in the second half of January.
3.1. Analysis
Measuring zinc, iron, lead, copper and cadmium in water samples were in this order that first we add 3 cc Acid Nitric without mercury into the water of 200 cc inside a dish. For avoiding mistake after cooling the sample, Again we add 3 cc thick Acid Nitric with a mild heat and after digesting 2 cc added Acid Nitric (1 + 1), We rise it up to the volume of 25 cc. the metal concentration is read by the atomic absorption spectrophotometer [13]. Measuring Nickel and mercury was done too after digestion processes by ICP [14].
3.2. Statistic Processes
The analysis of given articles was done by using cluster analysis [6]. The main goal of cluster analysis is classify the stations according to their features [15]. In a way that stations with like features are put in one group [16]. In this research in order to cluster analysis, after standardizing the given data, are used these stages based on distance [17] and ward method based on the least square Euclidean distance [18]. Dendron gram cut based on the farthest regional distance, divided the stations into three groups.
3.3. Concentration of Heavy Metals in Water
Table one shows the density of metals copper, zinc, Iron, lead, Nickel, Mercury and cadmium in the water of Aras river in 5 chosen stations and in different four season, spring, summer, autumn and winter.
The mean of copper density in spring is 70 microgram per one liter with the limitation of the density about 7 - 101 microgram per liter, which their maximum has been measured in station 3 and 5. The mean of copper density in summer is 100 microgram per liter that its maximum is present in station 2. The mean of copper density in autumn and winter is respectively 11 and 8. The mean of zinc density in spring is 38 microgram per liter and its maximum is about 118 microgram per liter in stations 3 and it’s mean in summer is 72 microgram and with the maximum of 144 microgram per liter is shown is station 2,which in this area Darre roud is lead into Aras. The copper density mean is 67 microgram per liter in autumn and its maximum is 135 microgram per liter in station 5 (Tazeh kand). The order of seasons according to density reduction is: summer, autumn, spring, winter.
The mean of Iron density is spring is 177 microgram per liter and its maximum is shown in station 2. The mean of Iron density in summer is 102 microgram per liter and its maximum is in station 2. Iron density reduction in seasons is: spring-summer-autumn-winter. The mean of Nickel density in spring is 44 microgram per liter and its maximum is in station 3 with the amount of 71 microgram per liter.
The mean of Nickel in summer is 38 microgram per liter and its maximum is in station 5 (Tazeh kand village), with the amount of 80 microgram per liter. Nickel density reduction is: spring-summer-autumn and winter. The mean of lead density in spring is 8 microgram per liter and its maximum is in station 2 (after joining of Darre roud to Aras) with the amount of 12 microgram per liter.
The mean of lead density in summer is 5 microgram per liter and has the same amount in all stations. The order of lead density reduction in water is: spring-summer-autumn-winter. The mean of cadmium density in spring is 8 microgram per liter and in summer with the highest amount of 9 microgram per liter and its maximum is in station 2.
The amount of the density of same metals such as Nickel and lead and Iron has a direct relation with the amount of rain and river water, and with a high probability, in the seasons with high amount of water. They enter the river because of soil erosion and river bed dissolution. Second, in spring the farmer start their fight against the fungicides. Mixture of copper and other metals are in fungicides and they can be one of the reasons of their increase in the river in spring. The reason of the high density of some metals in summer rather than spring can be because of river water reduction in this season and following that, can be the reduction of water surface and the suspended materials in it.
When the load of the river reduces, the metal absorption reduces from solution phase into dissolution phase too. In winter, Because of the reduction of poison and fertilizer and reduction of other industrial activities, the pollution load is reduced too. Besides, in winter because of temperate decrease, metal dissolving in water decreases too [19]. Finally, the amount of metals is another source of copper and other metals in the environment, because some mixture such as copper sulphate for controlling blights. Of course, existence of copper in a high amount (is scarcely 0.05 microgram in normal) is for human activities. Pesticide poisons are used for confronting the insects and fertilizer in summer. And since mine fertilizers have high amount of copper (0.01 - 0.05 microgram per liter) the high amount of copper in these stations can be related to the use of fertilizer and poison in irrigation network in Moghan. Nickel is a heavy metal that exists in main industrial polluting areas for sediments. The high amount of Nickel can be found in cereal, beaned fruit, and soybean productions [20] that existence of factories for fruit juice, demise, oil cake, livestock food and sugar in this area, it means in territory of Pars abad overlooking Aras River can be one of the reasons for the increase of this element in water. The waste water of houses of the city which are entering the river, is one of the ways of distribution of Nickel in water [21].
4. Results of Cluster Analysis
The results from Table 1 and dendrogram in water samples shows that the first cluster includes stations S3, S5, these two stations are in one cluster and have similar densities of metals. Station 3 is the accepter of the pollution of Gouri chay in to Aras. In this station, besides the pollution of stations 1 and 2, the pollutions of Guri chay also enter to Aras River, And also the waste water of Aslandouz directly enter this region. The station 5, the shoal of industrial waste water 15 industrial unit is working. Moghan cultivation waste water (near oltan and old Tazeh kand), sugar, dairies and domesticated food of parsabad which are one of the most important and biggest industrial units in this area and one of dangerous biological centers are also entering this station.
The second cluster includes stations S2, S4 that the pollution of station 2 is after joinery of Darre rud river into Aras. Darre rud river bring the industrial, agricultural waste water of village and towns of Tabriz, Oroumieh and Armenia into Aras. Mines are one of the entrance ways of metals such as copper into the water since there are some copper mines from Azerbaijan and Armenia.
Station 5 like station 4 also gets the industrial waste water of Parsabad. The third cluster includes station 1 which shows low densities of metals rather than the others.
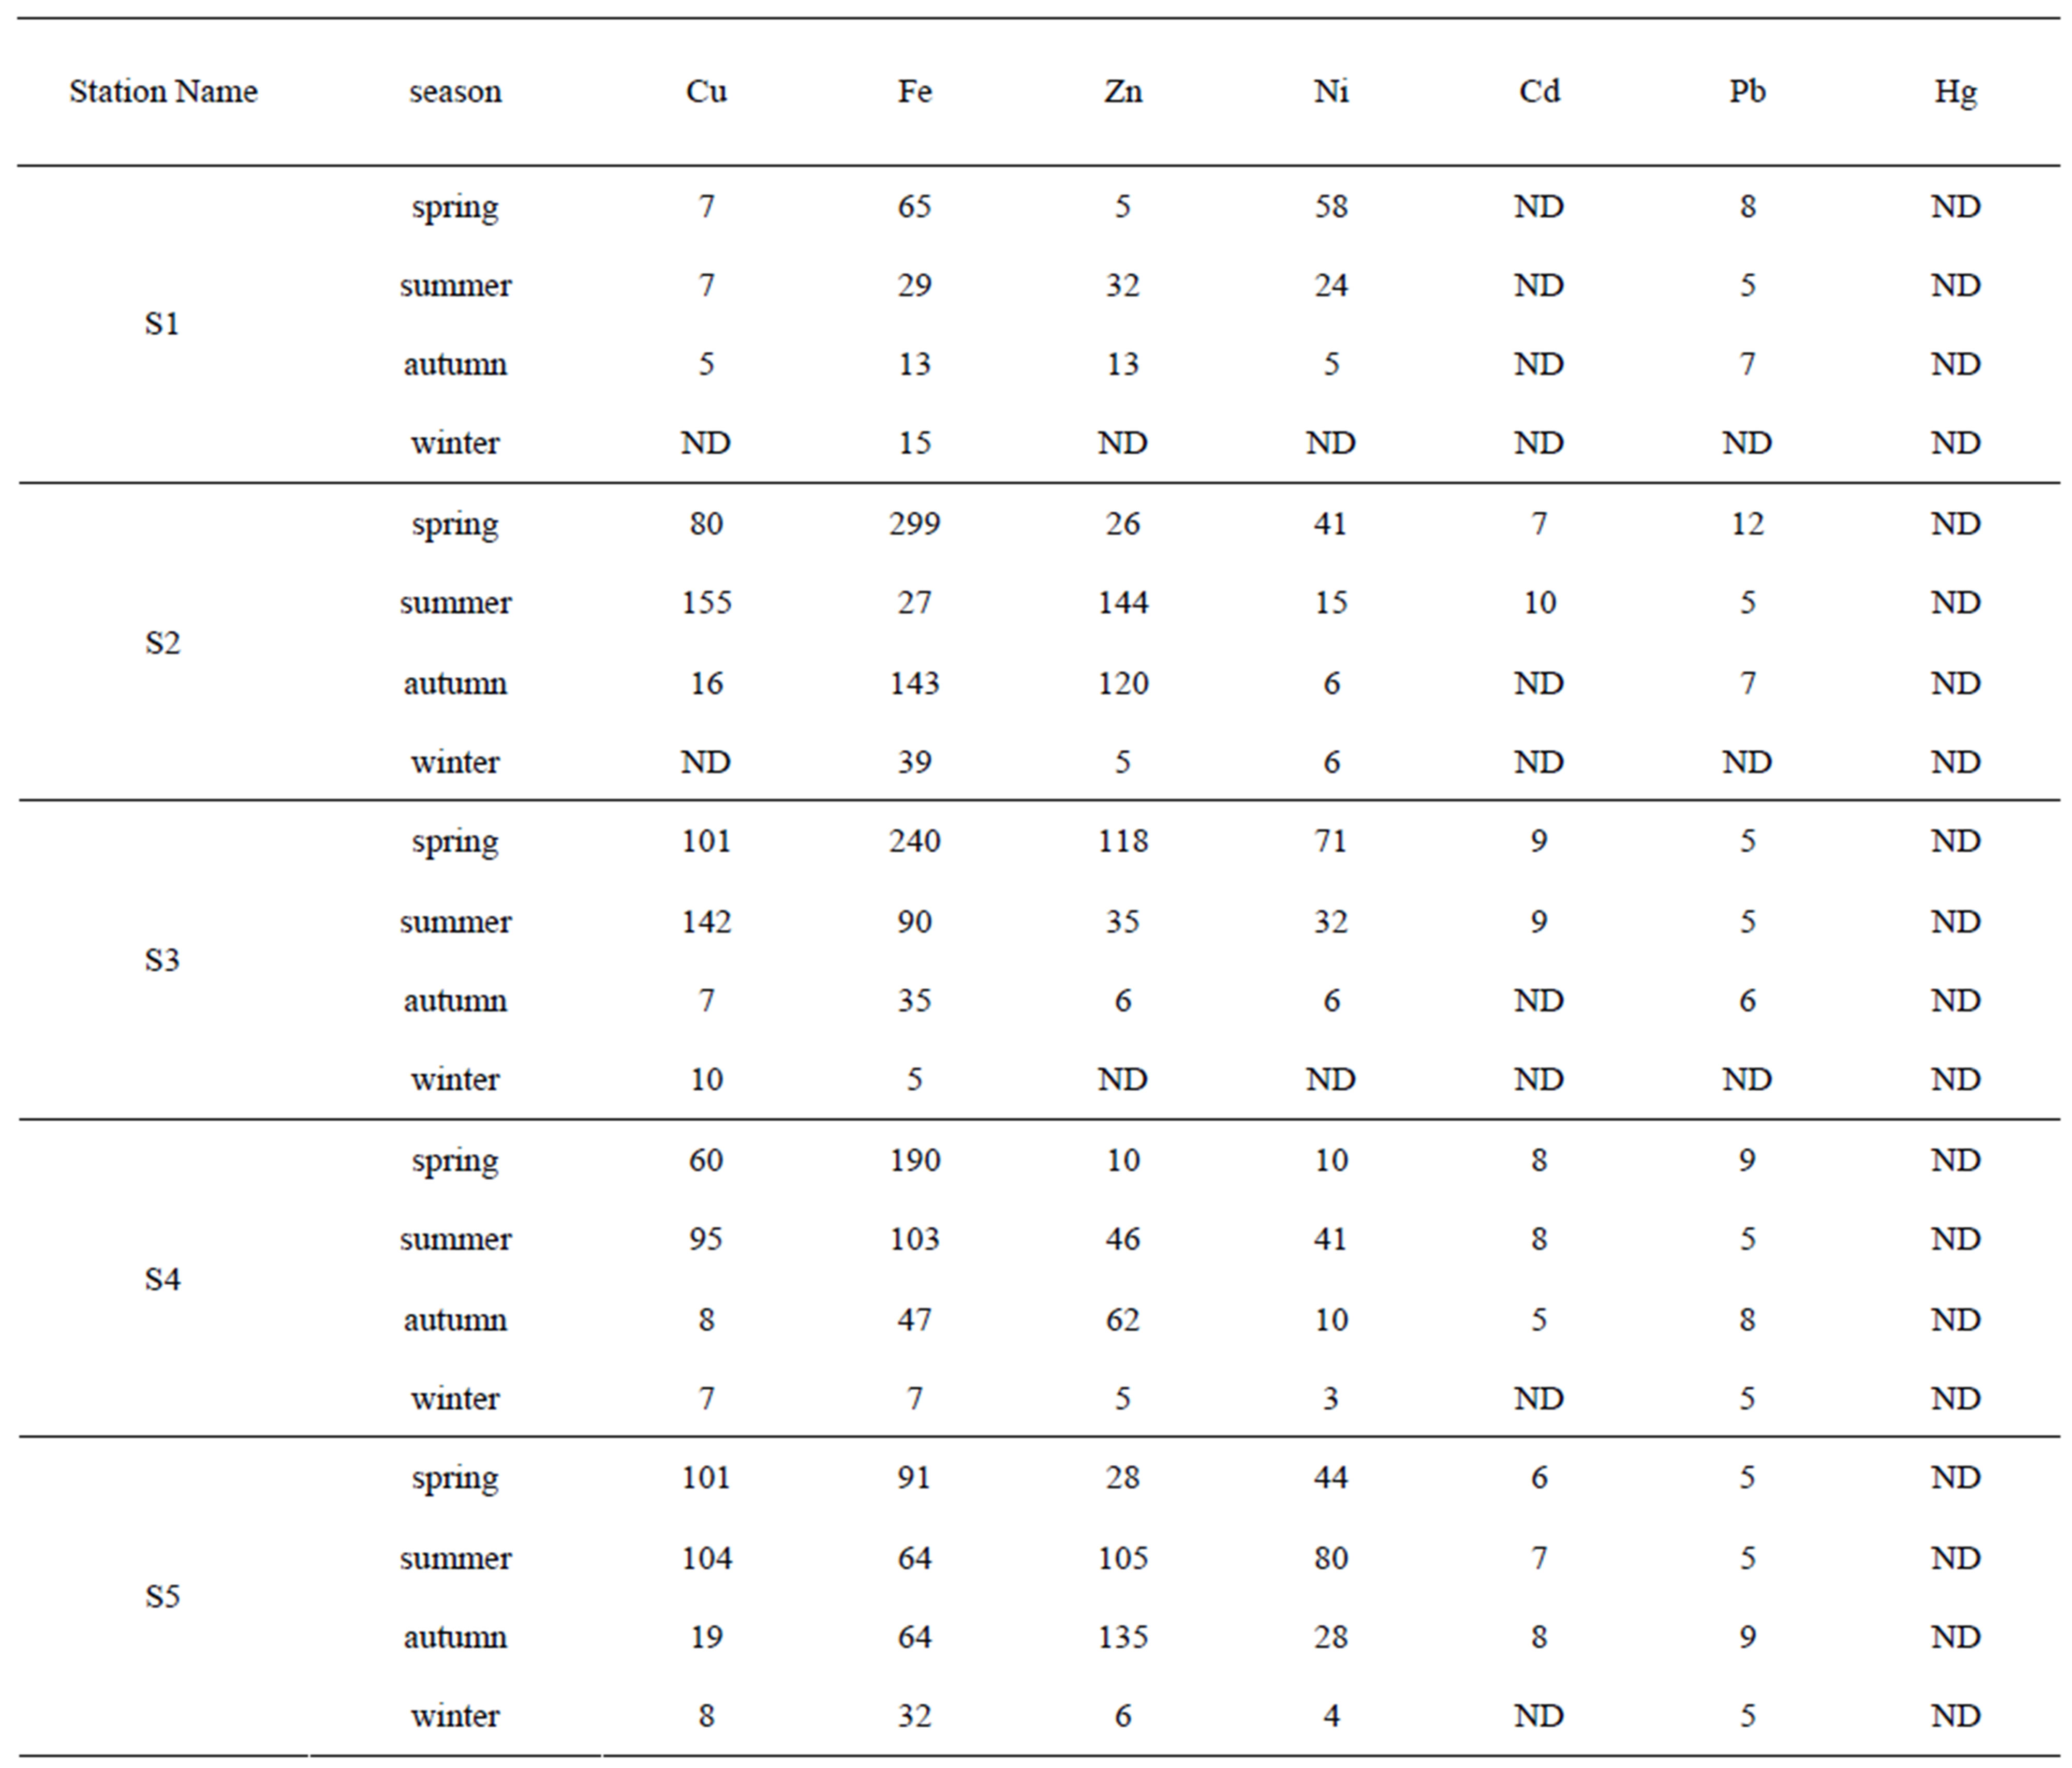
Table 1. The concentration of heavy metals in Aras River during 4 seasons (the units are microgram per liter ppb).
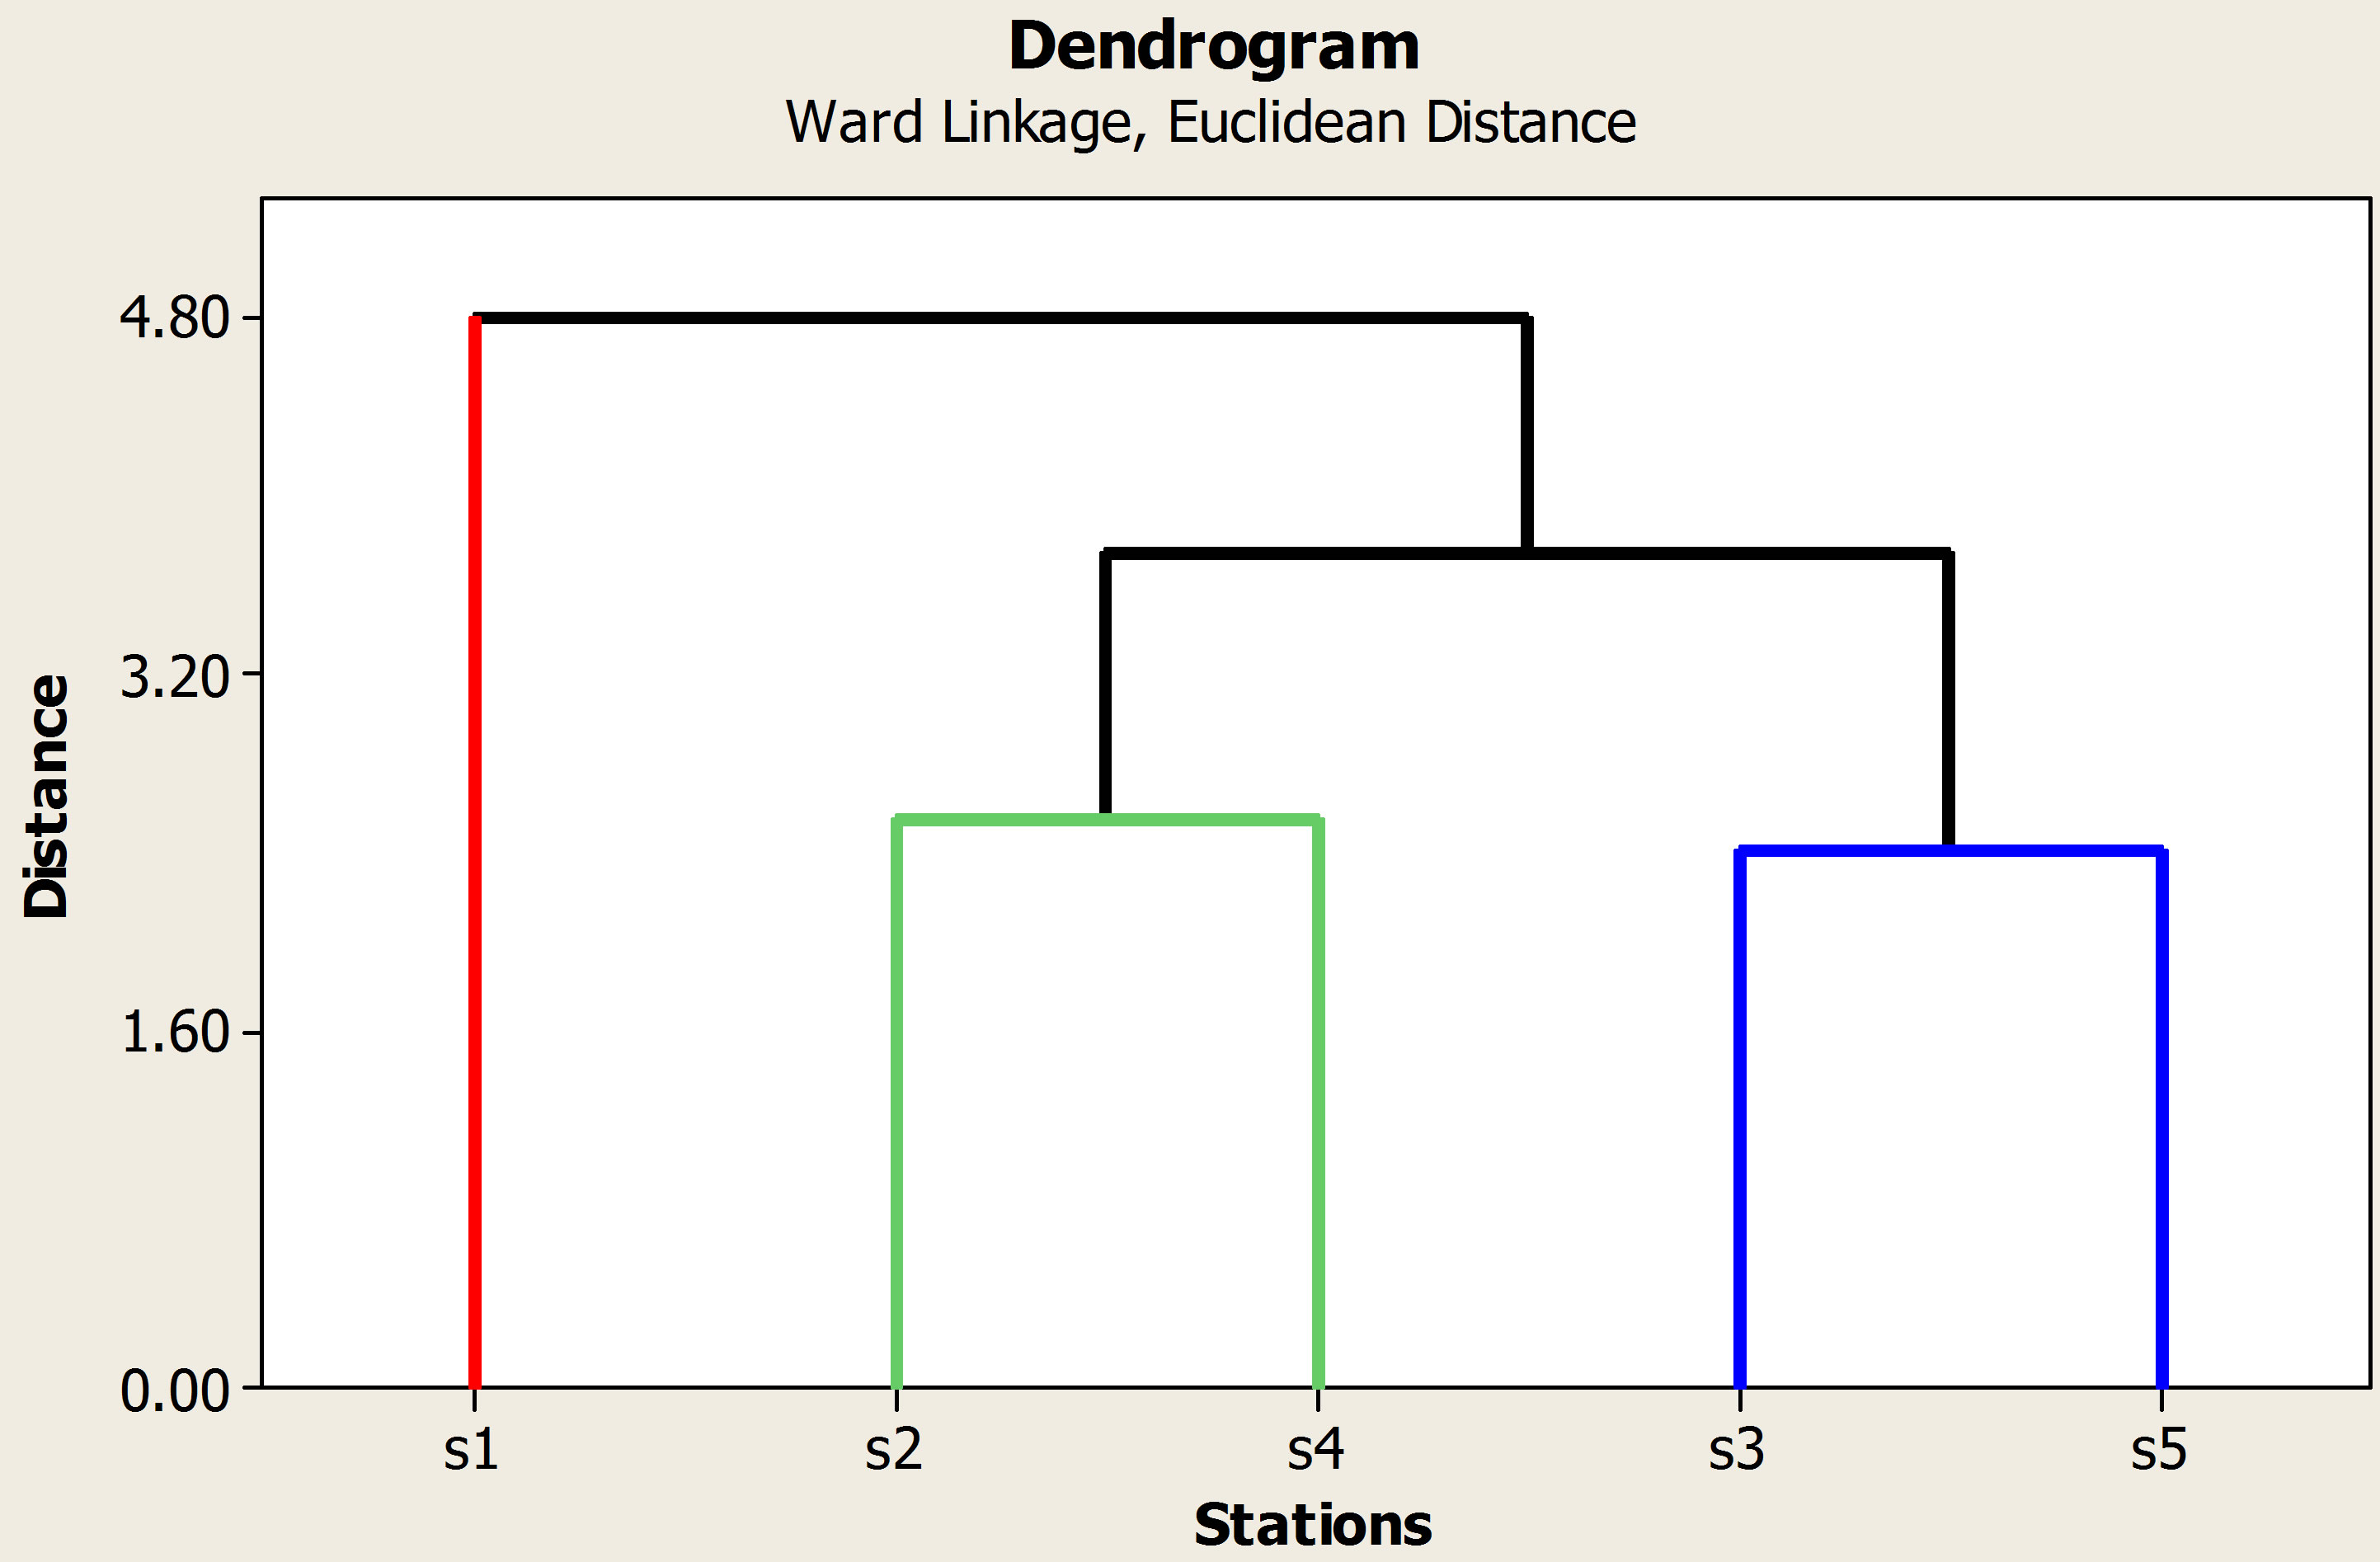
Figure 2. The results Dendrogram of the analysis of stations for heavy metals in Aras River.
5. Conclusion
According to the results of chart and Dendrogram in water samples, in general we can conclude that station 3 and 5 the highly polluted stations, among the others (HP), which are different by their pollution and exist farther than the others (Figure 2). After them, stations 2 and 4 with medium pollutions. Station1 is the lowest according to its pollution. In this research, it's shown that the differences between groups (stations) show the differences between polluting sources [15].
REFERENCES
- A. Baghvand, T. Nasrabadi, G. R. Nabi Bidhendi, A. Vosoogh, A. R. Karbassi and N. Mehrdadi, “Groundwater Quality Degradation of an Aquifer in Iran Central Desert,” Desalination, Vol. 260, No. 1-3, 2010, pp. 264-275. doi:10.1016/j.desal.2010.02.038
- T. Nasrabadi, G. R. Nabi Bidhendi, A. R. Karbassi, H. Hoveidi, I. Nasrabadi, H. Pezeshk and F. Rashidinejad, “Influence of Sungun Copper Mine on Groundwater Quality, NW Iran,” Environmental Geology, Vol. 58, No. 4, 2009, pp. 693-700. doi:10.1007/s00254-008-1543-2
- G. R. Nabi Bidhendi, A. R. Karbassi, T. Nasrabadi and H. Hoveidi, “Influence of Copper Mine on Surface Water Quality,” International Journal of Environmental Science and Technology, Vol. 4, No. 1, 2007, pp. 85-91.
- R. Pardo, E. Barrado, L. Perez and M. Vega, “Determination and Association of Heavy Metals in Sediments of the Pisucrga, River,” Water Research, Vol. 24, No. 3, 1990, pp. 373-379. doi:10.1016/0043-1354(90)90016-Y
- G. T. Ankley, D. M. Di Toro, D. J. Hansen and W. J. Berry, “Technical Basis and Proposal for Deriving Sediment Quality Criteria for Metals,” Environmental Toxicology and Chemistry, Vol. 15, No. 12, 1996, pp. 2056- 2066. doi:10.1002/etc.5620151202
- K. P. Singh, A. Malik, D. Mohan and S. Sinha, “Water Quality Assessment and Apportionment of Pollution Sources of Gomti River (India) Using Multivariate Statistical Techniques: A Case Study,” Analytica Chimica Acta, Vol. 538, No. 1-2, 2005, pp. 355-374. doi:10.1016/j.aca.2005.02.006
- V. K. Sharma, K. B. Rhhudy, R. Koening and F. G. Vazquez, “Metals in Sediments of the Upper Languna Madra,” Marine Pollution Bulletin, Vol. 38, No. 12, 1999, pp. 1221-1226. doi:10.1016/S0025-326X(99)00166-6
- A. R. Karbassi, J. Nouri and G. O. Ayaz, “Flocculation of Trace Metals during Mixing of Talar River Water with Caspian Seawater,” International Journal of Environmental Research, Vol. 1, No. 1, 2007, pp. 66-73.
- R. Chester and R. M. Hughes, “A Chemical Technique for the Separation of Ferro-Manganese Minerals, Carbonate Minerals and Adsorbed Trace Elements from Pelagic Sediment,” Chemical Geology, Vol. 2, 1967, pp. 249-262. doi:10.1016/0009-2541(67)90025-3
- M. V. Farabi, et al., “Physical, Chemical, Biological Studies of Aras River Heave Metals,” Fishery Research Institute of Iran, Khazar Sea Research House, 1388.
- Z. A. Bagirov and S. E. Bravarnik, “Water Management and Power Use of the Araks River,” Power Technology and Engineering, Vol. 19, No. 1, 2005, pp. 42-47.
- USEPA, “Volunteer Stream Monitoring, a Method Manual for Water Quality Monitoring,” 1997, p. 177.
- M. Otto, “Multivariate Methods,” In: R. Kellner, J. M. Mermet and H. M. Widmer, Eds., Analytical Chemistry, Wiley-VCH, Weinheim, 1998.
- APHA, “Standard Methods for the Examination of Water and Wastewater,” American Public Health Association, Washington, DC, 1992.
- D. Carlton, S. W. Rust and L. Sinnott, “Application of Statistical Modeling to Optimize a Coastal Water Qulity Monitoring Program,” Environmental Monitoring Assessment, Vol. 132, No. 1-3, 2007, pp. 505-522
- M. Karamouz, F. Szidarovszky and B. Zahraie, “Water Resources Systems Analysis,” Lewis, Washington, DC, 2003, pp. 369-386.
- M. Matthies, J. Berlekamp, S. Lautenbach, N. Graf and S. Reimer, “System Analysis of Water Quality Management for the Elbe River Basin,” Environmental Modeling & Software, Vol. 21, No. 5, 2006, pp. 1309-1318. doi:10.1016/j.envsoft.2005.04.026
- S. Shrestha and F. Kazama, “Assessment of Surface Water Quality Using Multivariate Statistical Techniques: A Case Study of the Fuji River Basin,” Japanese Environmental Modeling and Software, Vol. 22, No. 4, 2007, pp. 464-475. doi:10.1016/j.envsoft.2006.02.001
- J. I. Drever, “The Geochemistry of Natural Waters,” 3rd Edition, Prentice Hall Inc., Upper Saddle River, 1997, p. 436.
- E. Merian, Ed., “Metals and Their Compounds in the Environment: Occurrence,” Analysis and Biological Relevance, VCH, Weinheim, 1991, p. 1438.
- M. Vega, R. Pardo, E. Barrado and L. Deban, “Assessment of Seasonal and Polluting Effects on the Quality of River Water by Exploratory Data Analysis,” Water Research, Vol. 32, No. 12, 1998, pp. 3581-3592. doi:10.1016/S0043-1354(98)00138-9
NOTES
*Corresponding author.