Journal of Water Resource and Protection
Vol.3 No.1(2011), Article ID:3771,10 pages DOI:10.4236/jwarp.2011.31003
Numerical Modelling Sediment-Bacteria Interaction Processes in the Severn Estuary
1Key Laboratory of Pollution Processes and Environmental Criteria, Ministry of Education/College of Environmental Science and Engineering, Nankai University, Tianjin, China
2Cardiff School of Engineering, Cardiff University, Cardiff, UK
3State Key Hydroscience and Engineering Laboratory, Tsinghua University, Beijing, China
E-mail: gaogh@nankai.edu.cn
Received October 1, 2010; revised November 19, 2010; accepted December 25, 2010
Keywords: numerical modelling, faecal bacteria, sediment transport, enterococci
ABSTRACT
Faecal bacteria exist in both free-living and attached forms in estuarine waters. The deposition of sediments can take faecal bacteria out of the water column and to the bed. The sediments can subsequently be re-suspended to the water column, which can then lead to re-suspension of the faecal bacteria of the attached forms back to the water column. Therefore, the fate and transport of faecal bacteria is highly related to the governing sediment transport processes, particularly where these processes are significant, such as the Severn Estuary, UK. However, little attempt has been made to model such processes in terms of predicting the impact of the sediment fluxes on faecal bacteria levels. Details are given of the refinement of a numerical model of faecal bacteria transport, where the sediment transport processes are significant. After testing the sediment-bacteria interaction model favourably against known results in previous study, the model was applied to the Severn Estuary and Bristol Channel, UK, to investigate the impact of suspended sediment fluxes on the corresponding faecal bacteria transport processes. The model predictions have proved to be encouraging, with the results being compared to a traditional faecal bacteria modelling approach, where sediment bacteria interactions were not included. The new model provides improved predictions of faecal bacteria concentrations when sediment transport is included and for the Bristol Channel Severn Estuary it can be seen that the effects of the sediments on the bacterial levels in the water column can be significant.
1. Introduction
The Severn Estuary and Bristol Channel is one of the largest estuaries in the UK and is situated on the south west coast between South East Wales and South West England (see Figure 1). The estuary has the second highest tidal range in the world, with these tides, particularly during spring conditions, generating large currents (in excess of 3 m/s) and very high suspended concentrations (in excess of 1000 mg/l). Traditional numerical water quality models lack the ability to model faecal bacterial fluxes due to the effects of high sediment concentrations and the interaction with the bacteria. The model outlined herein includes the effects of sediment transport on the fluxes of faecal bacteria. Faecal bacteria in estuarine and coastal waters can be considered to exist in two forms, either as free-living bacteria within the water column, or attached (or adsorbed) to suspended
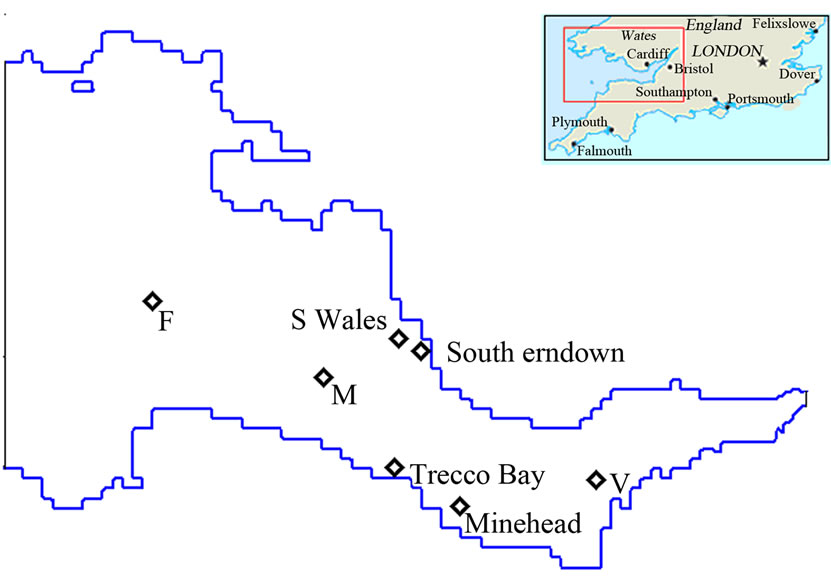
Figure 1. Location of calibration sites.
particles. The bacteria can be transported and diffused within the water column in their free-living form, or they can be adsorbed onto the sediments and then transported and diffused with the sediments. The adsorbed bacteria can settle out when the suspended particles deposit on the bed and then be re-suspended with the particles into the overlying water column when the sediment particles are re-suspended. Many studies have frequently revealed higher numbers of indicator and pathogenic bacteria in the sediments than in the overlaying waters in both marine and fresh water systems [1]. Fries et al. [2] investigated the attachment of faecal indicator bacteria to particles in the Neuse river estuary, in eastern North Carolina, USA, and found out that an overall 38% of bacteria are associated with particles. Characklis et al. [3] found attachment ratios of typically 30-55% for enterococci in storm water. The increased level of pathogens in sediments creates a potential health hazard from resuspension and subsequent ingestion from increasing usage of recreational waters. The transport of sediments in estuarine and coastal areas can therefore carry bacteria from sources such as wastewater treatment works (WwTWs) and rivers. This transport can have a major effect on the quality of bathing waters. Jamieson et al. [4] conducted field experiments in Swan Creek, Canada, by using the bacteria tracer E. coli NAR in their studies. They found that the reappearance of the bacteria tracer in the water column coincided with increases in the total suspended solids load, which indicated that the E.coli NAR were being re-suspended with the sediment load. E.coli NAR is a form of E coli that is: resistant to nalidixic acid, non-pathogenic, rarely found in the natural environment and possesses survival characteristics similar to other E. coli [1]. Numerical models for predicting bacterial contamination have generally treated bacteria as free-living in current studies and the deposition/re-suspension and adsorption/desorption processes are not generally included and little attempt has been made to model such processes in terms of predicting the impact of the suspended sediment fluxes on bacteria levels in the water column. Yang et al. [5] and Stapleton et al. [6] have recently developed bacteria transport models for the Severn Estuary. Both deposition and re-suspension processes were modelled for the attached bacteria. However, the ratios of attached to total bacteria were assumed to be constant and did not change with suspended sediment concentrations. Hence, there is currently a lack of sophisticated numerical models which are capable of simulating the effects of sediment fluxes on the bacterial loads in the water column.
In this study, details are given of the refinement of a numerical model of faecal bacteria transport, where the sediment transport processes are significant. After testing the sediment-bacteria interaction model favourably against known results in previous study, the model was applied to the Severn Estuary and Bristol Channel, UK, to investigate the impact of suspended sediment fluxes on the corresponding faecal bacteria transport processes. The model predictions have proved to be encouraging, with the results being compared to a traditional faecal bacteria modelling approach, where sediment bacteria interactions were not included. The new model provides improved predictions of faecal bacteria concentrations when sediment transport is included and for the Bristol Channel Severn Estuary it can be seen that the effects of the sediments on the bacterial levels in the water column can be significant.
2. Theoretical Background of Hydro-Environmental Model
2.1. Hydrodynamic Modelling
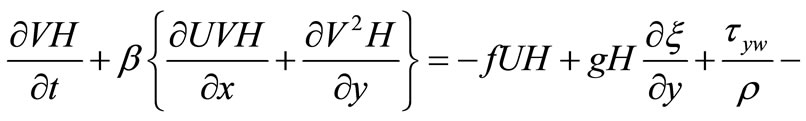
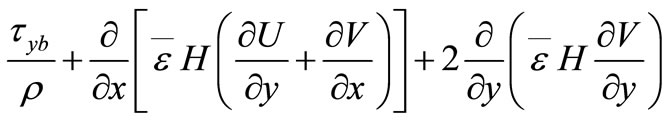
In this study area oneand two-dimensional flows coexist along different parts of the estuary, Therefore, a combined 2-D and 1-D model has been developed in this study to predict accurately the hydrodynamic and water quality processes in the estuarine and riverine waters. The two-dimensional hydrodynamic equations are generally based on the depth-integrated 3-D Reynolds equations for incompressible and unsteady turbulent flows, with the effects of the earth’s rotation, bottom friction and can be shown as below [7]:
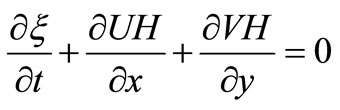 (1)
(1)
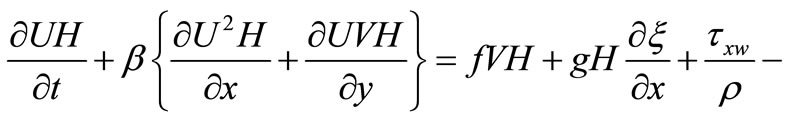
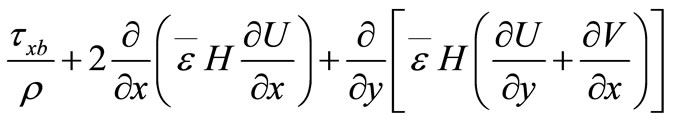 (2)
(2)
 (3)
(3)
where  = water elevation above (or below) datum;
  = depth averaged velocity components in x, y directions;
  = total water depth;
  = water depth below datum;
  = momentum correction factor;
  = Coriolis parameter;
  = surface wind shear stress components in x, y direction;
  = bed shear stress component in x,y directions;
  = depth averaged eddy viscosity. The momentum correction factor, the wind and bed shear stresses, and the depth-averaged viscosity are described in detail in Falconer [7].
The one-dimensional hydrodynamic equations are based on St Venant equations and can be expressed in the following:
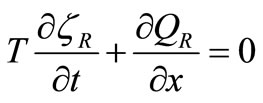 (4)
(4)
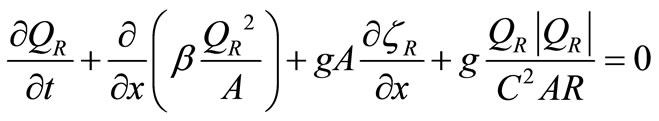 (5)
(5)
where  top width of the channel;
  water elevation;
  discharge;
  momentum correction factor due to the non uniform velocity over the cross section;
  wetted cross section area;
  hydraulic radius and
  wetted perimeter of the cross-section.
2.2. Suspended Sediment Transport Modelling
Sediment transport formulations for predicting suspended sediment fluxes in depth integrated two-dimensional numerical models are based on solving the depth integrated form of advective-dispersion equation, which can be shown to be of the form [8]:
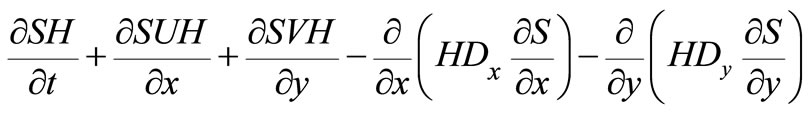
 (6)
(6)
where  depth-averaged suspended sediment concentration,
  depth-averaged dispersion coefficients in x and y directions, respectively;
  particle settling velocity,
  a profile factor given by the ratio of the bed concentration
  (i.e. the concentration at an elevation ‘a’ above bed) to the depth-averaged sediment concentration,
  depth-averaged equilibrium concentration, which can be determined from an appropriate sediment transport formula such as van Rijn [9-11] with this being one of the most widely used formulations incorporated into computational models and included in the study reported herein. The equilibrium concentration is that value which occurs when the sediment flux vertically upwards from the bed due to turbulence is in equilibrium with the net sediment flux downwards due to the fall velocity (or gravity).
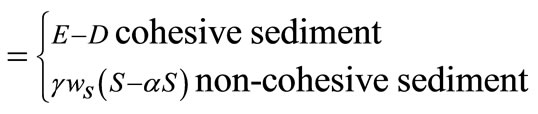
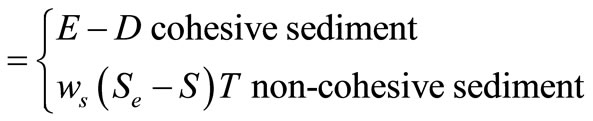
For modelling cohesive sediment transport the net sediment flux can be rewritten in the following form [12]:
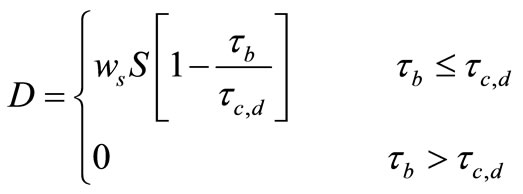 (7)
(7)
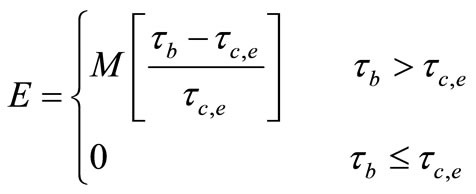 (8)
(8)
where  = bed shear stress,
  = critical shear stress for deposition,
  = critical shear stress for erosion and M = empirical erosion constant.
Typically values of the critical stress for erosion and deposition are given in van Rijn [11] for a range of different mud types. For the empirical erosion coefficient M, reported values used in the current study for the Severn Estuary study are typically in the range of 0.00001 to 0.0005 for soft natural mud [12].
The one-dimensional cross-sectional averaged sediment transport equation can be written as [8]:
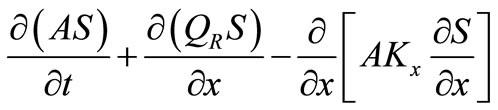
 (9)
(9)
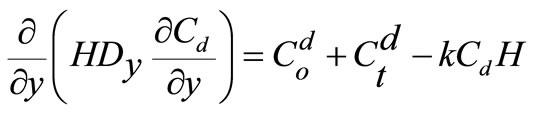
2.3. Sediment-Bacteria Interaction Model
2.3.1. Partition of Bacteria between Sediment and Water
The total bacteria concentration in the water column  is given by:
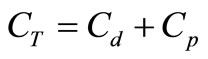 (10)
(10)
where  free-living bacteria concentration and
  attached bacteria concentration in water column.
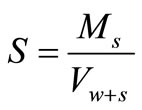
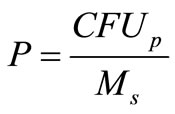
For a given concentration of suspended solids, the quantity of faecal bacteria on particles is often expressed as a mass-specific concentration  (cfu/unit weight of suspended solids), so the volume-specific concentration on particles
  can be expressed as:
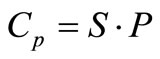 (11)
(11)
where  is the suspended solid concentration, and
  is the mass-specific bacteria concentration, which can be defined as follows:
 (12)
(12)
 (13)
(13)
where  is the solid mass of sediment.
Chapra [13] expressed the tendency of bacteria to attach to particles by using a partition coefficient of the form:
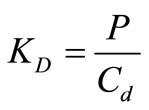 (14)
(14)
Assuming that the rate at which bacteria are adsorbed and/or desorbed from a particulate is fast, then a local equilibrium can be assumed to give:
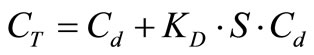 (15)
(15)
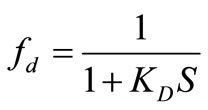
which can be solved to give:
 (16)
(16)
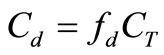
and
 (17)
(17)
where  is the fraction of free-living bacteria in the water column.
For the attached bacteria, we have:
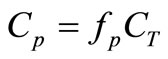 (18)
(18)
where
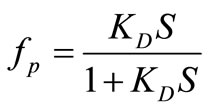 (19)
(19)
and:
 (20)
(20)
2.3.2. Exchange of Bacteria in Sediment Water Interface
Bacteria settlement
One of the effects of sediment transport on adsorbed bacteria is that when the sediment settles out then the adsorbed bacteria is also taken out of the water column to the bed sediments. The flux of adsorbed bacteria from the water column to the bed sediments,  , can be expressed as:
 (21)
(21)
where  sediment deposition flux (
 )and
)and  attached faecal bacteria concentration on suspended sediment (
 )
)
Bacteria re-suspension
The re-suspension of bacteria from the bed sediments to the water column , can be expressed as:
 (22)
(22)
where:  bacteria concentration on bed sediments (
 ), and
  sediment re-suspension flux rate (
 )
)
To summarise, the net bacteria flux,  , due to settling and re-suspension of the sediments can be expressed as:
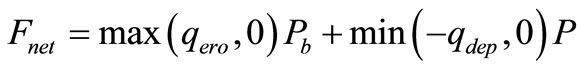 (22)
(22)
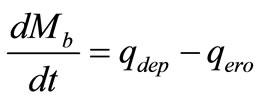
Bacteria concentrations in the bed sediment
The concentration of bacteria on the bed sediments,  , varies depending on the exchange of bacteria between the water column and the bed sediments. However, another reduction also arises in the bed sediment concentration as a result of the decay of the bacteria within the bed sediments. Assuming that the deposited sediments from water column to the bed and the bed sediments are well mixed immediately after deposition, then the exchange rate of bed bacteria concentration
  can be expressed in the following form:
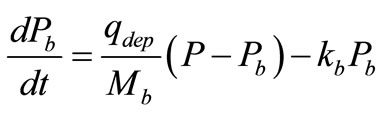 (23)
(23)
where  mass of bed sediments per unit area, and
  faecal bacteria decay rate in bed sediment.
Likewise, in equation (24), the mass of bed sediments per unit area,  , also varies temporarily as given by:
 (25)
(25)
2.3.3. Governing Equations for Bacteria Transport Processes
Free-living bacteria transport
The fate and transport of free-living bacteria can be described by the following two-dimensional depth integrated advection-diffusion equation:
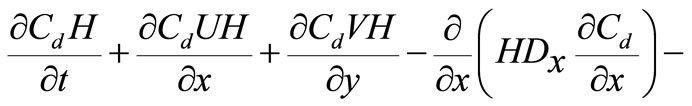
 (26)
(26)
where  depth averaged free-living bacteria concentration,
  source or sink of free-living bacteria;
  transformation term defining the desorption of bacteria from sediments to the free-living form and vice versa; and
  the decay rate of bacteria in water column.
Equation (26) has been solved to predict bacteria concentration levels for most studies of bacteria transport modelling, with this representation having been proven to represent the process accurately, such as Lin and Falconer [14], Kashefipour et al. [15], for the case where sediment transport is not significant. However, for studies where sediment transport processes are significant, then solving these equations alone will not give accurate results since the transport of bacteria through the process of sediment transport, via erosion and deposition, have not been included in the transport model.
Attached bacteria transport
In studying the transport of attached bacteria, attached bacteria may be transported with the sediments. The fate and transport of attached bacteria can therefore be described by the following two-dimensional depth integrated advection-diffusion equation:
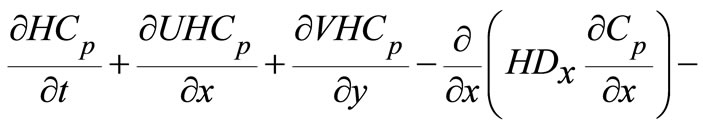
 (27)
(27)
where  depth averaged attached bacteria concentration in the water column,
  source or sink of bacteria in its attached form;
  transformation term defining the adsorption of free-living bacteria to the attached bacteria form or vice versa;
  source term defining the attached bacteria from or to the bed sediments, for sediment erosion or deposition, respectively; and
  the decay rate for bacteria in the water column.
Total bacteria transport
In order to predict bacteria concentrations correctly, both for free-living and attached bacteria, then the transport equation must be solved simultaneously in the numerical model for both bacterial components. However, there are difficulties in solving these equations accurately since the transformation terms are difficult to quantify. The transformation processes between the free-living and adsorbed state for the bacteria are very complex, so it is almost impossible to quantify these terms. Wu et al. [8], pointed out that in modelling heavy metals there was a problem in using separate equations to model dissolved and particulate metals due to the complex nature of the transformation between the particulate and dissolved phase. Similar modifications can be made in the advection-diffusion equation for bacteria, by using , which avoids the need to calculate the transformation term.
Adding equations (26) and (27) and using  gives
gives
 (28)
(28)
where  depth averaged total faecal bacteria concentration,
  , which is source term defining the attached bacteria from, or to, the bed sediments and
  can be calculated from using equation (23) as follows:

By solving the total bacteria transport equation, the total bacterial concentration level  is determined, wherein equations (16) and (18) can then be used to determine the free-living and attached bacteria levels respectively.
Likewise, the one-dimensional cross sectional averaged total bacteria transport equation can be expressed as:
 (29)
(29)
3. Model Set up and Field Data
Model set-up
The model domain was represented horizontally in two grid systems, i.e. the 2-D and 1-D grids. The 2-D grid covered the Bristol Channel (14,636 km2), which was divided into a mesh of 242´168 grid squares, with a size of 600 m ´ 600 m. The 1-D grid covering the region from the M4 (new) Severn Bridge (i.e. the downstream boundary of the 1-D model) to Haw Bridge (i.e. the upstream boundary). This model included a total of 351 cross-sections, with an average distance between the cross-sections of 240 m. The downstream boundary was specified as a tidal water elevation boundary, whilst the upstream boundary was specified in the form of a velocity boundary. The downstream boundary water level was obtained from the Proudman Oceanographic Laboratory (POL) model.
An extensive program of data collection was undertaken to provide data for calibration and verification of the modeling system. The bathymetric data were digitised from the Admiralty Chart. These data were combined using linear interpolation to give bathymetric data for the whole of the model. Hydrodynamic and water quality data are avilable during the summer period of 2001 for different tide conditions. Large amounts of data were collected, including: water depth, current speed and direction, salinity levels and concentrations of suspended solids and enterococci concentrations. In total, there were 63 input sources identified that contributed to the pollution loads of the estuary. These included: direct discharges of 34 treated wastewater from treatment plants, inputs from the upstream boundary of the 29 rivers.
4. Model Calibration and Verification
Before a numerical model is applied to different scenarios, it first needs to be calibrated to obtain the best possible match between model predictions and measured data. In this study the hydrodynamic model was calibrated against Admiralty Chart data at Sites F, M and V. After calibration the hydrodynamic model was validated against measurement data at Site S Wales and Minehead. The locations of these calibration and validation sites are shown in Figure 1. The sediment transport and bacteria transport model were calibrated against measured data, in order to predict the enterococci concentrations at compliance points located along the estuary. The time step was set to 25 s. The momentum correction factor was set to 1.016 and wind stress was not considered in this study. The measured discharges at the tidal limit of the River Severn were not available. Averaged discharges over the simulation period were used as upstream boundary. The seaward boundary water levels were predicted using the POL Bristol Channel mode. A period of 300 hours was selected for the simulation time and this covered the data measuring period, which included a spring tide, a neap tide and mid-tide cycles.
The main hydrodynamic parameter used for hydrodynamic model calibration is the bed roughness. In this study the two-dimensional model bed roughness was represented as an equivalent roughness length , which can be easily related to bed forms. For the one-dimensional part of the estuary, the Manning’s n roughness coefficient was used. A number of simulations were carried out and the calibrated roughness length was found to be 35 mm for the two-dimensional region of the model. For the one-dimensional model part, the calibrated Manning’s roughness coefficient was optimised at 0.022. The velocities at the three Admiralty Chart data sites, including Sites F, M and V, were used for the hydrodynamic calibration of the model. The model was then run to predict the hydrodynamic features and the predictions were compared to the values at these calibration sites, for both spring and neap tides.
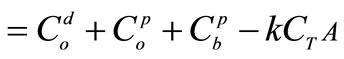
Typical comparisons of the Admiralty Chart data and the predicted current speeds and directions at M are shown in Figures 2 for spring and neap tide. After calibration of the hydrodynamic model, the model was then verified using four sets of observed velocities and water depth data at two survey sites, namely S Wales and Minehead. Typical comparisons between the model predicted and measured water depths, and the current speeds and directions are shown in Figure 3. Again good agreement has been obtained between both sets of results.
To simulate sediment transport processes in the Severn Estuary, both the cohesive and non-cohesive sediment transport processes needed to be considered. The grain size of the sediment in the Severn Estuary was provided in Stapleton et al. [6], based on analysing samples from four sites. The mean values of 0.026, 0.058, 0.126 and 0.15 mm were obtained for the non-cohesive sediments, based on the corresponding D16, D50, D84, and D90 values respectively. For cohesive sediments, the average size was in the range of 0.010 to 0.063mm. The cali-
 (a)
(a)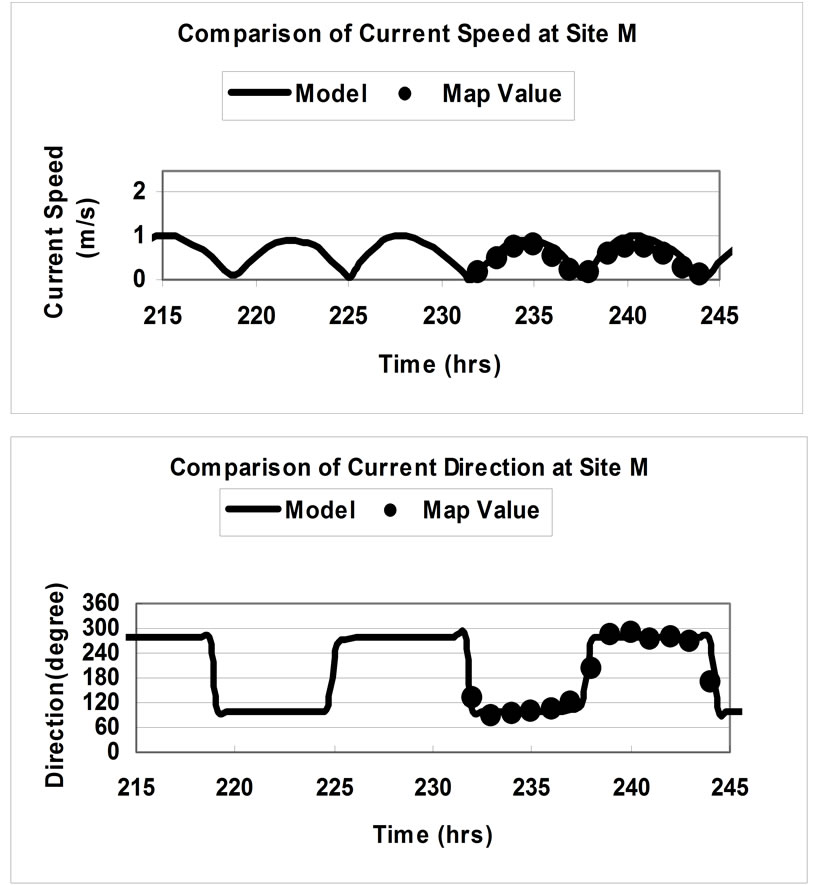 (b)
(b)
Figure 2. Comparison of current speeds and directions at Site M for (a) spring tide and (b) neap tide.
brated critical shear stresses for deposition and erosion were 0.1 N/m2 and 2 N/m2 respectively.
The numerical model predictions for the suspended sediment concentrations were compared with field measured data, with the predictions being compared at two sites, namely Southerndown and Trecco bay, where field data were available. Typical comparisons are shown in Figure 4.
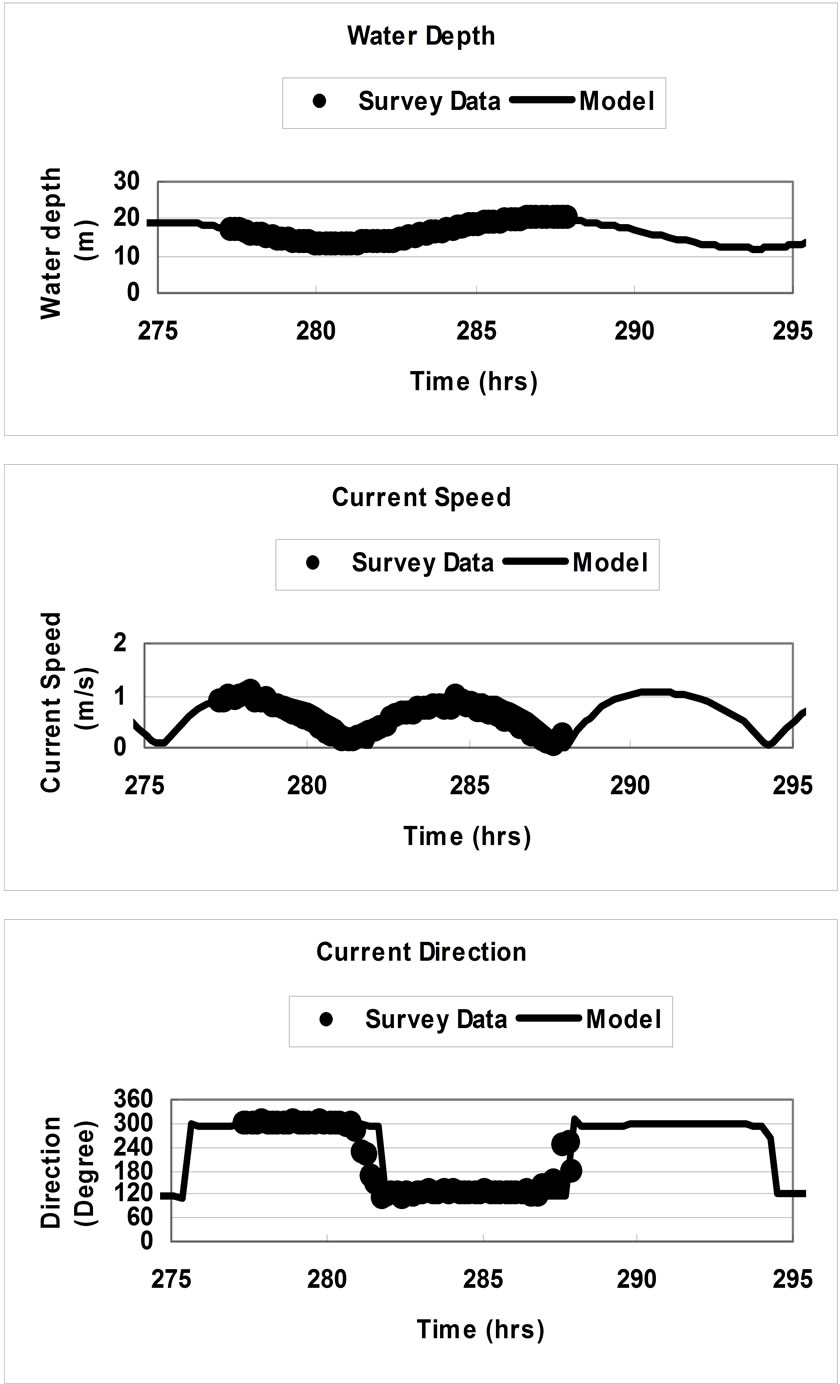
Figure 3. Comparison of water depths and current speeds and directions at minehead for 1st August 2001 survey.

Figure 4. Suspended sediment concentrations at Trecco Bay.
The results have shown that the numerical model gave reasonably good predictions.
The new EU bathing water quality directive 2006/7/ EC was adopted on 15th Febuary 2006 and will repeal the old Directive 76/160/EEC by the end of 2014. In the new directive the number of water quality indicators to be monitored has been reduced from nineteen to two, i.e. E Coli and Enterococci (EC 2006/7C). Therefore, in this study enterococci were chosen as indicator bacteria to investigate the bathing water quality at the compliance sites. The main parameter to be calibrated in the numerical model for bacterial prediction is usually the decay rate, which depends on a number of environmental parameters. Therefore, the decay rate can vary for different survey conditions and needs to be estimated for the prevailing weather and water conditions at the time of study. In this study a dynamic decay rate was used to include the effects of light intensity and suspended sediment concentration, with these data being obtained from field and experimental studies by Stapleton et al. [6],. Stapleton et al. [6], used artificial light to reproduce the correct solar spectrum and intensity, as observed between 10:00 and 14:00 hours from beginning of July to the end of August. From these data the following regression curves were obtained and provide relationships for the enterococci decay rate under light and dark conditions.
 (30)
(30)
In the above equation the turbidity is related to the suspended sediment concentrations by the following equation:
 (31)
(31)
The suspended sediment concentrations are given in mg/l, with the values obtained from the sediment transport model.
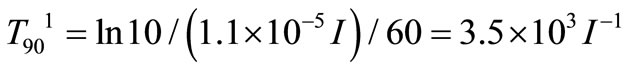
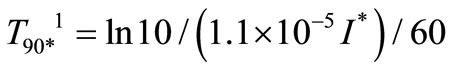
The above relationships are derived based on assumption of constant light intensity. In order to take account of the effect of time variation of light intensity, Stapleton et al. [6], have used the following equation to represent the :
:
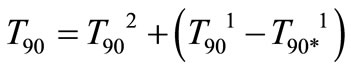 (32)
(32)
where: T901 is the enterococci mortality rate depending on surface sunlight (I):
 ;
;
 ;
;
T902 is the enterococci mortality rate obtained from the laboratory experimental equation (30).
In which I* is the fixed irradiance for the T90 vs. turbidity, obtained from experiments (Wm-2). The light intensity used in this study has been provided by Environment Agency.
For the bacteria model calibration, results from the model, including and excluding sediment effects on bacteria, were compared with the field data. The comparisons are shown in Figure 5. It can be seen that the model
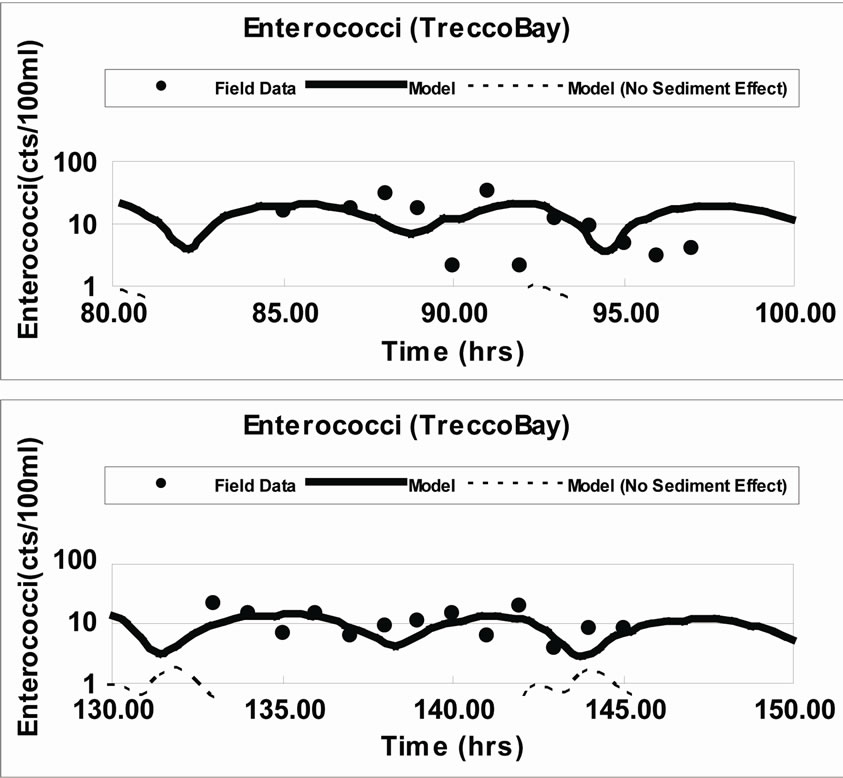
Figure 5. Enterococci concentration comparisons at Trecco Bay.
without the inclusion of the sediment effects on the bacteria transport predicted almost no bacteria concentrations; however, this result was known to be incorrect. The numerical model predictions with sediment effects on bacteria being included gave reasonable predictions at both sites, although the enterococci concentration levels were relatively low.
5. Model Application
After calibration and validation of the numerical model, the model was applied to investigate the hydrodynamic processes and the sediment and enterococci concentration distributions for different scenarios. The model was used to investigate the sediment effects on the enterococci distributions in the Severn estuary, Due to the lack of bed enterococci concentration distribution data, different initial bed enterococci concentrations were used to show how sensitive the enterococci distributions were to the bed concentrations. Enterococci concentrations in the
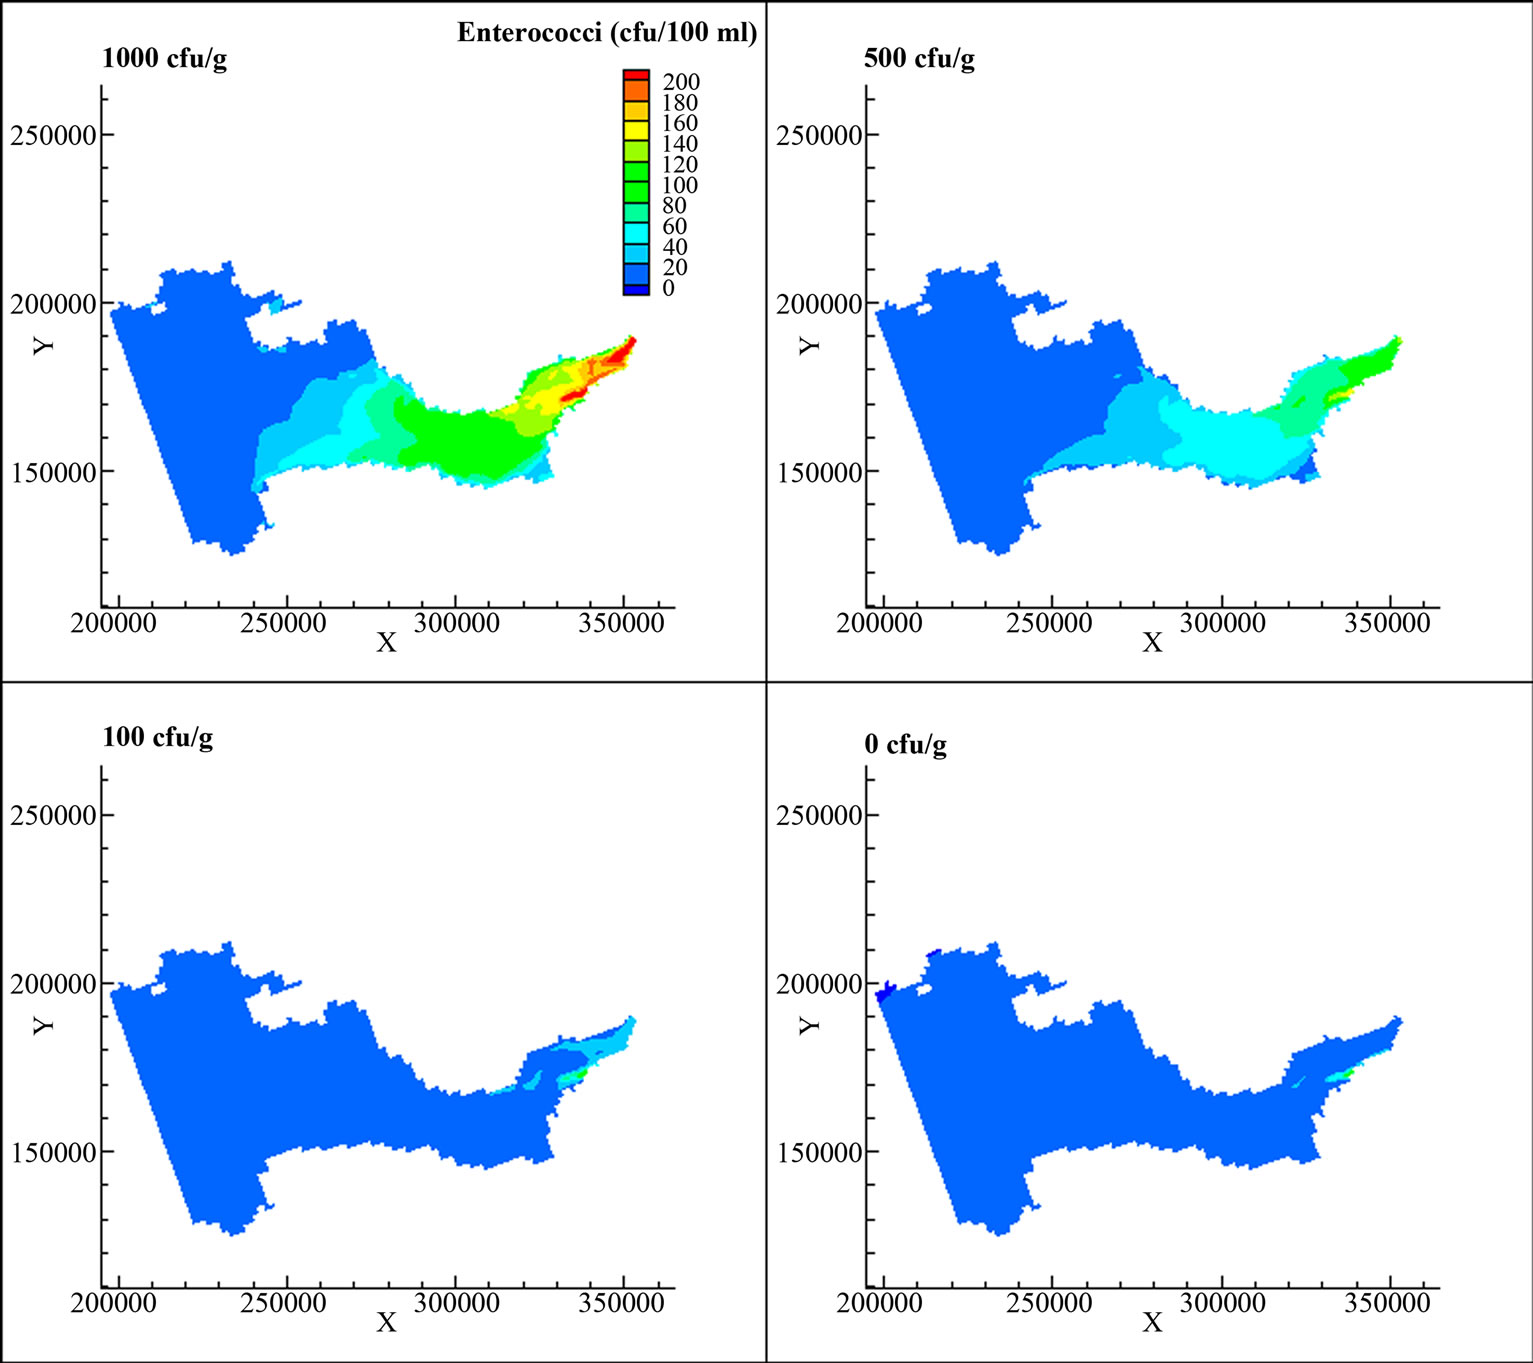
Figure 6. Comparison of enterococci concentrations for different initial bed concentrations at mean ebb spring tide.
sediment samples from Beachley Slip and Weston-Super-Mare were investigated by Stapleton et al. [6], and it was found that the enterococci concentrations in the bed sediments analyzed were between 3 cfu/g and 1088 cfu/g. Therefore in this study the bed sediment enterococci concentrations were set to be 0 cfu/g, 100 cfu/g, 500 cfu/g and 1000 cfu/g to test the effects bed bacteria concentrations on the concentrations at the bathing water compliance locations. The distribution of enterococci for different bed bacteria concentration along the estuary for mean spring ebb tide are shown in Figure 6. It can be seen that the bed bacteria concentration plays an important role in governing the concentration of the overlay water column, especially during conditions of significant sediment transport activity. During the spring tide cycle, the currents in the domain were very high, leading to very high suspended sediment concentrations. The sediments re-suspended from the bed were the dominant constituents. Therefore, under the condition of high bed enterococci concentrations, the concentration of bacteria was higher than the condition without sediment effects being included with the bacteria. During a spring tide the enterococci concentrations at the bathing water compliance sites were following the sediment re-suspension trends, especially for high bed enterococci concentrations. This was because during a spring tide the sediment was re-suspended from the bed and the enterococci bacteria were re-suspended, together with the sediments being eroded into the overlaying water column.
The distribution of enterococci for different bed bacteria concentration along the estuary for mean neap ebb tide are shown in Figure 7. During neap tides, the current speed was much smaller than for a spring tide and the shear stress was not large enough to re-suspend bed sediment. Hence, the sediment concentrations were fairly low. Instead of re-suspension of bacteria from the bed, the bacteria were deposited on the bed from the water column. During neap tides the enterococci concentrations
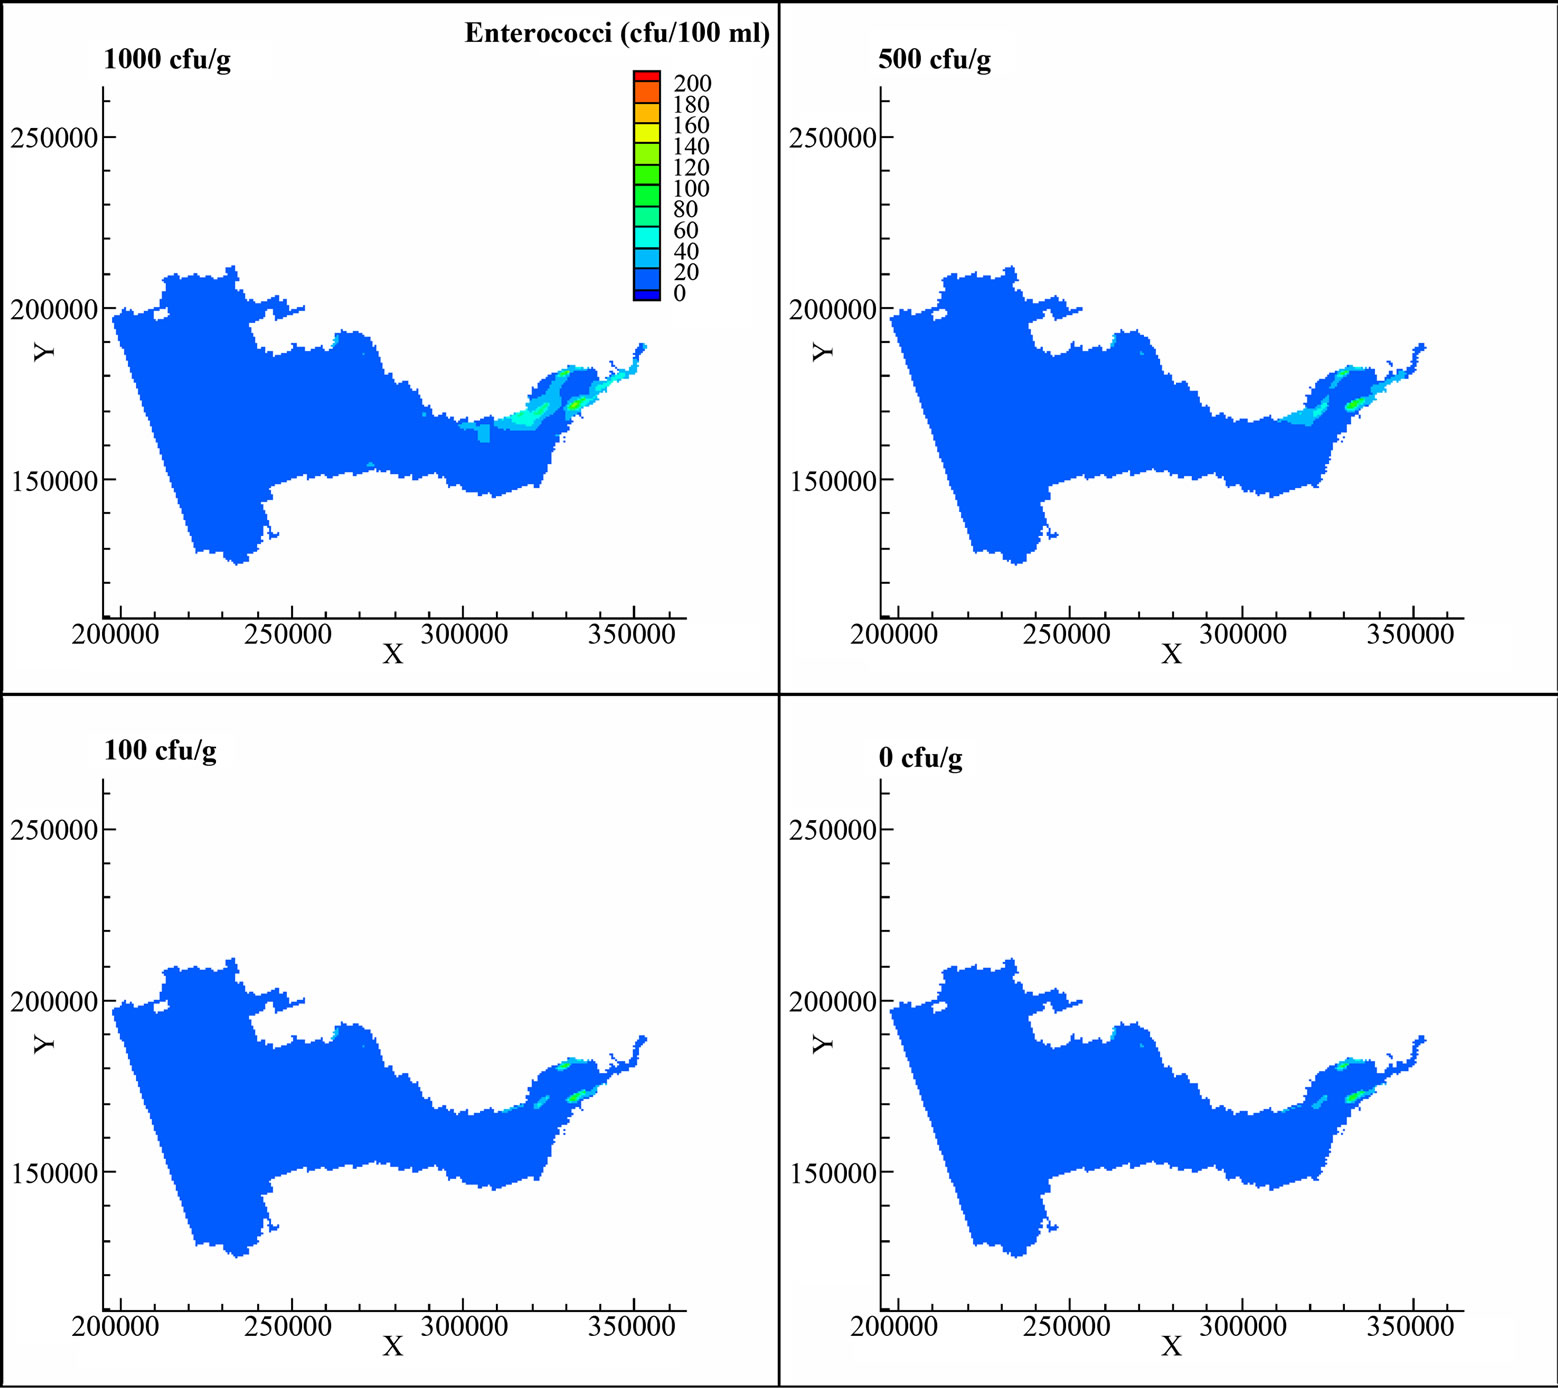
Figure 7. Comparison of enterococci concentrations for different initial bed concentrations at mean ebb neap tide.
were not significantly affected by the initial enterococci concentrations assumed on the bed sediments. The reason for this observation is that during neap tides the flow and shear stress are not strong enough to re-suspend sediments from the bed, and with sediment deposition being the dominant process.
6. Conclusions
The paper reports on the refinement of a numerical model to predict the fate and transport processes of faecal bacteria in estuarine waters, where sediment transport processes are significant. In this model the concentration of faecal bacteria within the water column was linked to the sediment transport processes, i.e. the faecal bacteria concentrations were affected by adsorption and desorption with the sediment particles and the deposition and re-suspension of sediments. The model was applied to predict faecal bacteria concentrations in the Bristol Channel and Severn Estuary. The model predictions were encouraging, with reasonably good agreement being obtained with field measurements at various sites along the estuary. The model results were then compared to a more typical faecal bacteria modelling approach, wherein the sediment bacteria interactions are not included. The results showed that the new model predictions provided closer agreement with the field data when sediment transport processes and sediment-bacteria in teractions were included when trying to predict the water column bacteria load levels. Thus for the studies applied to the Bristol Channel and Severn Estuary the results showed that the effects of sediment-bateria interactions were significant when trying to predict the total water column bacterial concentrations.
7. Acknowledgement
The authors would like to acknowledge the support of this project from Environment Agency and European Regional Development Fund. This study is also supported by “the Fundamental Research Funds for the Central Universities”. The research is partly funded under the LCRI (Low Carbon Research Institute) Convergence Energy Programme, Industrial Research Project.
REFERENCES
- R. C. Jamieson, R. Gordon, D. Joy and H. Lee, “Assessing Microbial Pollution of Rural Surface Waters a Review of Current Watershed Scale Modeling Approaches,” Agricultural Water Management, vol. 70, No. 1, 2004. pp. 1-17. doi:10.1016/j.agwat.2004.05.006
- J. S. Fries, G. W. Characklis and R. T. Noble, “Attachment of Fecal Indicator Bacteria to Particles in the Neuse River Estuary, N. C.,” Journal of Environmental Engineering, vol. 132, no. 10, 2006, pp. 1338-1345. doi:10.1061/(ASCE)0733-9372(2006)132:10(1338)
- G. W. Characklis, et al., “Microbial Partitioning to Settleable Particles in Stormwater,” Water Research, vol. 39, no. 9, 2005, pp. 1773-1782. doi:10.1016/j.watres.2005.03.004
- R. C. Jamieson, D. Joy, H. Lee, R. Kostaschuk and R. Gordon, “Resuspension of Sediment-associated Escherichia in a Natural Stream,” Journal of Environmental Quality, Vol. 34, No. 2, 2005, pp. 581-589. doi:10.2134/jeq2005.0581
- L. Yang, B. Lin and R. A. Falconer, “Modelling Enteric Bacteria Levels in Coastal and Estuarine Waters,” Proceedings of Institution of Civil Engineers, Engineering and Computational Mechanics, Vol. 161, No. EM4, 2008, pp. 179-186.
- C. M. Stapleton, M. D. Wyer, D. Kay, M. Bradford, N. Humphrey, J. Wilkinson, B. Lin, Y. Yang, R. A. Falconer, J. Watkins, C. A. Francis, J. Crowther, N. D. Paul, K. Jones and A. T. McDonald, “Fate and Transport of Particles in Estuaries,” Volume I, II, III, IV, Environment Agency Science Report SC000002/SR1-4, 2007.
- R. A. Falconer, “An Introduction to Nearly Horizontal Flows,” In: M. B. Abbott and W. A. Price, Eds., Coastal Estuarial and Harbour Engineers, Reference Book, E and F. N. Spon Ltd., London, 1993, pp. 27-36.
- Y. Wu, R. A. Falconer and B. Lin, “Modelling Trace Metal Concentration Distributions in Estuarine Waters,” Estuarine, Coastal and Shelf Science, Vol. 64, No. 4, 2005, pp. 699-709. doi:10.1016/j.ecss.2005.04.005
- L. C. Van Rijn, “Sediment Transport, Part I: Bed Load Transport,” Journal of Hydraulic Engineering, ASCE, Vol. 110, No. 10, 1984, pp. 1431-1457. doi:10.1061/(ASCE)0733-9429(1984)110:10(1431)
- L. C. Van Rijn, “Sediment Transport, Part II: Suspended Load Transport,” Journal of Hydraulic Engineering, ASCE, 1984. Vol. 110, No. 11, pp. 1613-1641. doi:10.1061/(ASCE)0733-9429(1984)110:11(1613)
- L. C. Van Rijn, “Principles of Sediment Transport in Rivers, Estuaries and Coastal Seas,” Aqua Publications, Netherlands, 1993.
- R. A. Falconer and Y. Chen, “Modeling Sediment Transport and Water Quality Processes on Tidal Floodplains,” In: M. G. Anderson, D. E. Walling, P. D. Bates, Eds., Floodplain Processes, Wiley, Chichester, 1996.
- S. C. Chapra, “Surface Water-Quality Modelling,” McGraw Hill, New York, 1997.
- B. Lin and R. A. Falconer, “Numerical Modelling of 3-d tidal Currents and Water Quality Indicators in the Bristol Channel,” Water and Maritime Engineering, Proceedings of Institution of Civil Engineers, Vol. 148, No. 3, 2001, pp. 155-166.
- S. M. Kashefipour, B. Lin, E. Harris and R. Falconer, “Hydro-environmental Modelling for Bathing Water Compliance of an Esturine Basin,” Water Research, vol. 36, No. 7, 2002, pp. 1854-1868. doi:10.1016/S0043-1354(01)00396-7