Journal of Water Resource and Protection
Vol. 2 No. 10 (2010) , Article ID: 2956 , 4 pages DOI:10.4236/jwarp.2010.210102
Interpretation of Water Quality Parameters for Villages of Sanganer Tehsil, by Using Multivariate Statistical Analysis
Department of Statistics, University of Rajasthan, Jaipur, India
E-mail: {singh.yshbir, manishkr29}@gmail.com
Received July 30, 2010; revised August 20, 2010; accepted August 28, 2010
Keywords: Factor Analysis, Principal Component Analysis, Drinking Water, Fluoride
ABSTRACT
In this study, the factor analysis techniques is applied to water quality data sets obtained from the Sanganer Tehsil, Jaipur District, Rajasthan (India). The data obtained were standardized and subjected to principal components analysis (PCA) extraction to simplifying its interpretation and to define the parameters responsible for the main variability in water quality for Sanganer Tehsil in Jaipur District. The PCA analysis resulted in two factors explaining more than 94.5% of the total variation in water quality data set. The first factor indicates the variation in water quality is due to anthropogenic sources and second factor shows variation in water quality due to organic sources that are taking place in the system. Finally the results of PCA reflect a good look on the water quality monitoring and interpretation of the surface water.
1. Introduction
Quality of water is an important factor in development and use of ground water as resources. Due to pressure of human activity, urbanization and industrialization, the groundwater sources are degraded gradually; therefore pure, safe, healthy and odorless drinking water is a matter of deep concern. There are many pollutants in groundwater due to seepages viz. organic and inorganic pollutants, heavy metals, pesticides, fluorides etc. The quality of water is identified in terms of its physical, chemical and biological parameters [1]. The particular problem in the case of water quality monitoring is the complexity associated with analyzing the large number of measured variables [2]. The data sets contain rich information about the behavior of the water resources. The classification, modelling and interpretation of monitoring data are the most important steps in the assessment of water quality.
The application of different multivariate statistical techniques such as Cluster Analysis (CA) and Principal Component Analysis (PCA) helps in the interpretation of complex water quality data matrix. These techniques have been applied by many researchers to characterize and evaluate groundwater and surface water quality. In the present study, a water quality data matrix, obtained from 50 villages of Sanagner Tehsil, Jaipur District, Rajasthan, has been subjected to different multivariate statistical techniques such as Factor analysis and Principal Component Analysis (PCA).
2. Materials and Methods
In Rajasthan (a state of India), all 32 districts are affected with high fluoride concentration in groundwater and among these Jaipur ranks second. Sanganer, the Tehsil of Jaipur District, is attached with the main city of Jaipur. It lies between 26° 49’ to 26° 51’ N latitude and 75° 46’ to 75° 51’ E longitude. It covers an area of 635.5 sq. km. There are different sources of drinking water viz., hand pumps, tube wells, open wells, PHED supply etc.
Samples of drinking water were collected in clean polyethylene bottles from different sources viz. hand pumps, open wells, tube wells and PHED supply from villages of study area [3]. Using Multivariate statistical technique we analyzed the data for different parameters as pH, F-, EC, TDS, Ca, Mg, TH, Cl-, CO3-2, HCO3-, Alkalinity, Na+, K+ and NO3-.
3. Results and Discussion
Data were analyzed and result presented in Table 1.
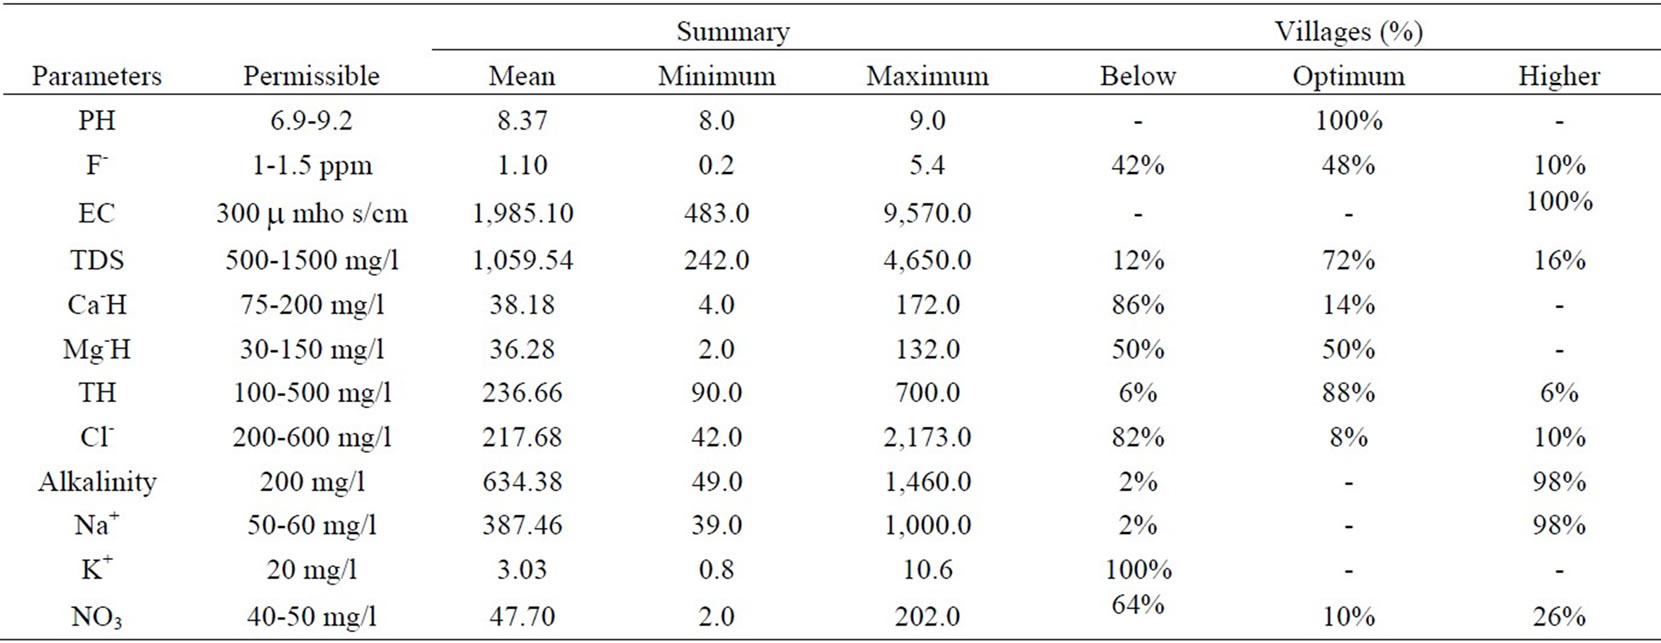
Table 1. Summary statistics of the parameters and villages% fall in permissible limit.
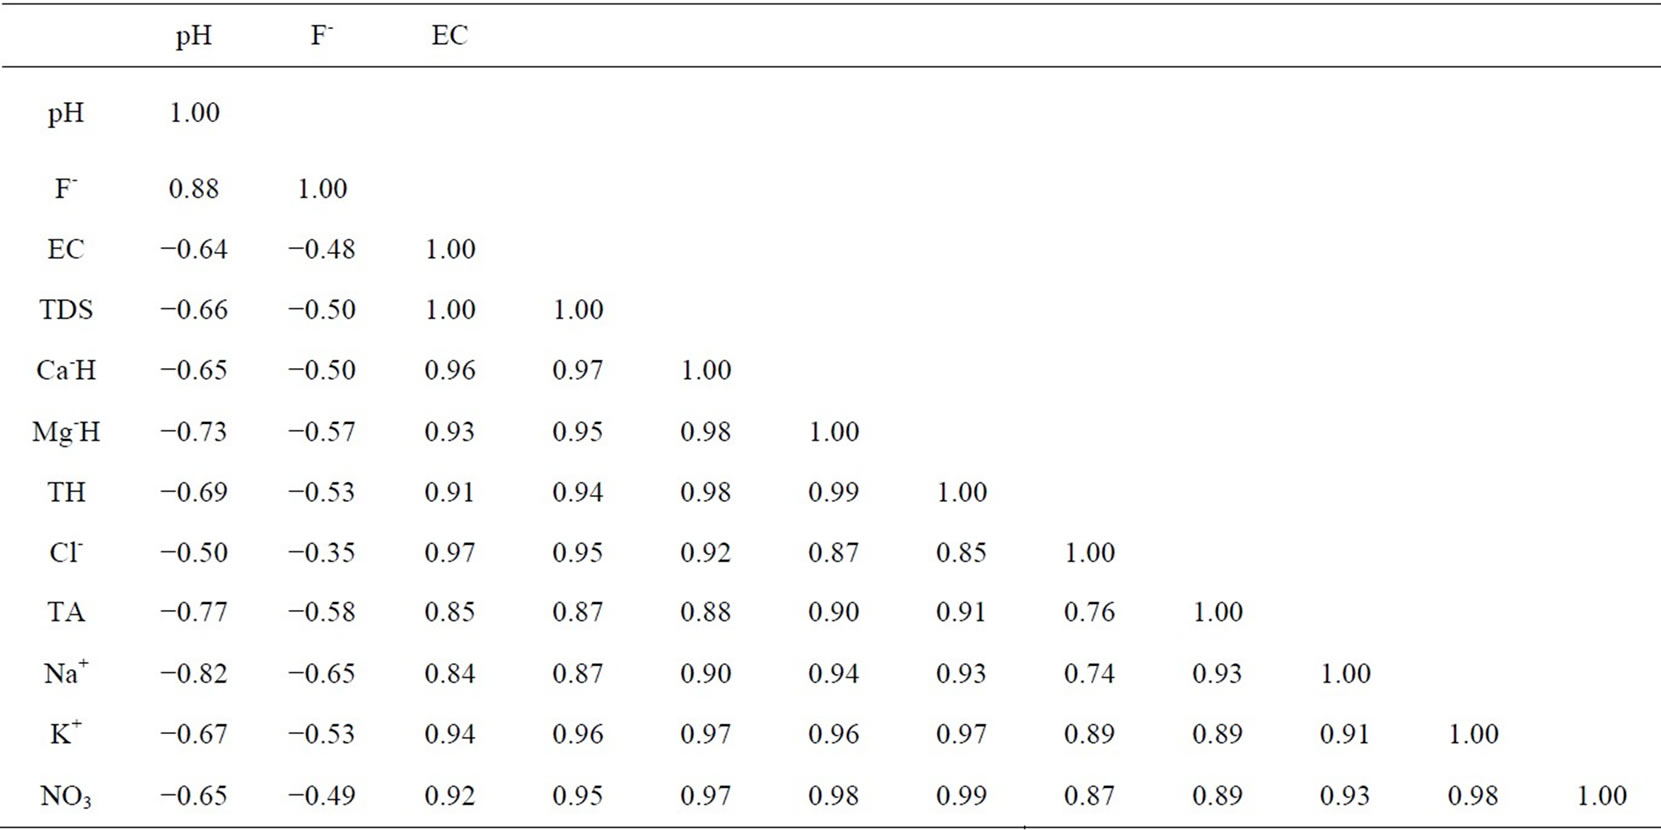
Table 2. Correlation matrix of parameters.
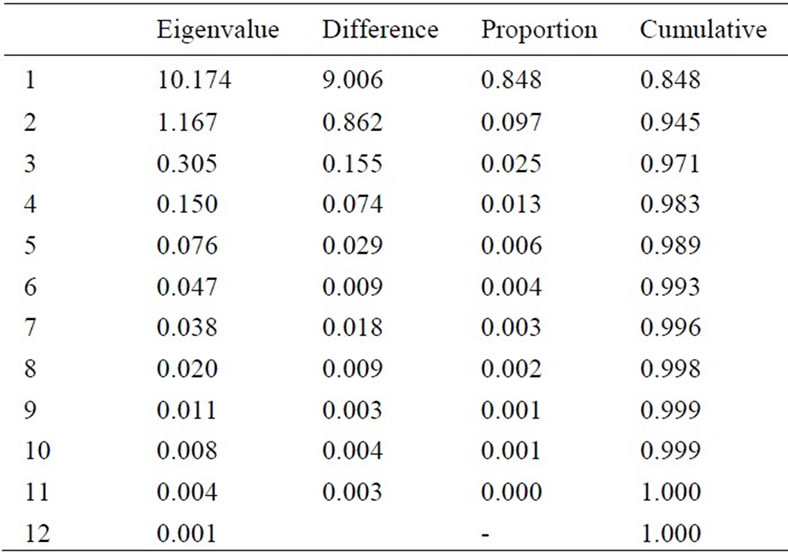
Table 3. Eigenvalues of the correlation matrix.
Analysis revealed that pH of all water samples are within range. pH showed positive correlation with fluoride and negative correlation with other parameters (Table 2). 10% of villages of the study area are affected with high concentration of fluoride; whereas 42% villages had lower F-. Only 48% of the villages are under optimum limit of fluoride.
EC was reported higher than the permissible limit for all the villages. TDS was found to be within limit in 72% of villages, whereas 16% villages showed TDS higher than limit. Ca-H (Calcium hardness) and Mg-H (Magnesium hardness) combined to form total hardness. 14% villages showed Ca-H within limit, whereas 86% are below the limit. Mg-H reported 50% below the limit and 50% within the limit. Total hardness was higher in 6%

Figure 1. Scree plot of the eigenvalues.
villages; below than limit in 6% villages whereas 88% samples contained TH within optimum limit (Table 2). In this study, hardness showed negative correlation with F- and pH (Table 2).
Chloride (Cl) varied from 42 to 2173 mg/l. The chloride content was higher than permissible limit (200-600 mg/l) in 10% villages and lower in 82% villages. Only 8% villages were within optimum limit (Table 1). High content of chloride gives salty taste to water. Carbonate (CO3-2) and bicarbonate (HCO3-) together make total alkalinity. Alkalinity was higher than permissible limit i.e., (200 mg/l) in 98% villages, only 2% villages contain alkalinity below than limit (Table 1). Alkalinity showed positive correlation with EC, TDS, Cl, TH, NO3-, Na+ and K+ (Table 2). High values of alkalinity give undesirable taste to water. Almost all the villages (98%) contain higher concentration of sodium (Na+). Potassium (K+) content of water samples varied from 0.782 to 10.557 mg/l and all the water samples (100%) contain K+ content lower than permissible limit, i.e., 20 mg/l (Table 1). Nitrate (NO3-) content was lower than permissible limit (40-50 mg/l) in 64% villages; 10% villages are within limit and 26% villages have NO3- concentration higher than limit. Higher concentration of NO3- in water causes a disease called “Methaemoglobinaemia” or known as “Blue-baby Syndrome”. It is particularly infant disease up to 6 months of child.
Factor analysis was applied to data obtained from 50 villages and factors extracted by the centroid method, rotated by Varimax rotation [4]. Calculated eigenvalues, percent total variance, factor loading and cumulative variance are given in Table 4.
The factor analysis generated two significant factors shown by scree plot (Figure 1) which explain 94.5% of the variation in the data set. Factor 1 explained 84.7% of the variance and Factor 2 explained 9.7% of the variance.
The following factors were indicated considering the hydro-chemical aspects of the water.
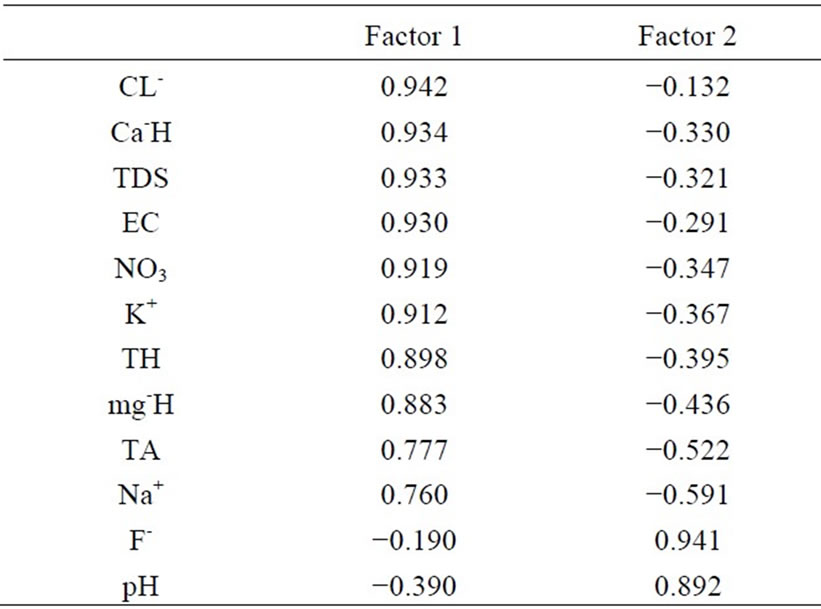
Table 4. Rotated factor pattern, rotation method = varimax.
• Factor 1 includes EC, TDS, Calcium hardness (Ca-H), Magnesium hardness (mg-H), Total hardness (TH), Chloride (CL-), Alkalinity, Sodium (Na+), Potassium (K+) and Nitrate (NO3), which originate from anthropogenic causes like industrial and agricultural pollution in surface water. So we named this factor as ‘anthropogenic origin’.
• Factor 2 includes pH which comes from natural sources. Fluorides are due to industrial waste but also due to geological sources so we named this factor as ‘Organic origin’.
4. Conclusions
The data indicate that the groundwater of Sanganer Tehsil is highly deteriorated as it is polluted with high amount of fluoride, nitrate and alkalinity. Most of the water quality parameters are above the permissible limit. PCA of water quality data for Sanganer Tehsil shows that the main variation in water quality of the Sanganer Tehsil of Jaipur city is due to anthropogenic sources and organic sources.
REFERENCES
- A. Sargaonkar and V. Deshpande, “Development of an Overall Index of Pollution for Surface Water Based on a General Classification Scheme in Indian Context,” Environmental Monitoring and Assessment, Vol. 89, No. 1, 2003, pp. 43-67.
- K. Saffran, “Canadian Water Quality Guidelines for the Protection of Aquatic Life,” CCME Water Quality Index 1.0: User’s Manual, Excerpt from Publication No. 1299, 2001.
- J. D. Sharma, P. Sharma, P. Jain and D. Sohu, “Chemical Analysis of Drinking Water of Sanganer Tehsil, Jaipur District,” International Journal of Environmental Science and Technology, Vol. 2, No. 4, 2005, pp. 373-379.
- S. Ahmed, M. Hussain and W. Abderrahman, “Using Multivariate Factor Analysis to Assess Surface/Logged Water Quality and Source of Contamination at a Large Irrigation Project at Al-Fadhli, Eastern Province, Saudi Arabia,” Bulletin of Engineering Geology and the Environment, Vol. 64, 2005, pp. 315-232.