Journal of Water Resource and Protection
Vol. 1 No. 5 (2009) , Article ID: 863 , 11 pages DOI:10.4236/jwarp.2009.15039
Evapotranspiration Characteristics of a Lowland Dry Evergreen Forest in Central Cambodia Examined Using a Multilayer Model
1Forest Hydrology Laboratory, Forestry and Forest Products Research Institute, Tsukuba, Japan
2Kyushu Research Center, Forestry and Forest Products Research Institute, Kumamoto, Japan
3Research Institute for Global Change, Japan Agency for Marine-Earth Science and Technology, Yokohama, Japan
4Hokkaido Research Center, Forestry and Forest Products Research Institute, Hokkaido, Japan
5Forestry Administration, Forest and Wildlife Science Research Institute, PhnomPenh, Cambodia
E-mail: tatuhiko@ffpri.affrc.go.jp
Received July 6, 2009; revised September 9, 2009; accepted September 15, 2009
Keywords: Cambodia, Energy Balance Bowen Ratio Method, Evapotranspiration, Lowland Dry Evergreen Forest, Multilayered Model
ABSTRACT
Development pressure has led to serious deforestation on the Indochina Peninsula. Particularly rapid deforestation has occurred in easily accessible lowland areas, and it is thus important to accumulate knowledge about these forests immediately. We measured evapotranspiration rates for a lowland dry evergreen forest in Kampong Thom Province, central Cambodia, using the energy balance Bowen ratio (EBBR) method based on meteorological data collected from a 60-m-high observation tower. Daily evapotran spiration was higher during the dry season than during the rainy season of the Asian monsoon climate. The seasonal variation in evapotranspiration generally corresponded to the seasonal difference in the vapor pressure deficit. A multilayer model was used to simulate the seasonal variation in evapotranspiration. The multilayer model also reproduced the larger evapotranspiration rate in the dry season than in the rainy season. However, observed values substantially exceeded model-calculated results during certain periods at the beginning of the dry season and in the late dry season. Moreover, during the rainy season, the model tended to overestimate evapotranspiration. The differences between these observed and simulated values may have been caused by seasonal characteristics of photosynthesis and transpiration in the lowland dry evergreen forest that were not considered in the model simulation.
1. Introduction
The Indochina Peninsula, including Cambodia, belongs to the Asian monsoon climate zone characterized by distinct rainy and dry seasons. Pressures including increases in population, farmland development, and illegal logging have led to serious deforestation problems across the Indochina Peninsula. For example, the area covered by forest in Thailand decreased from 54% in 1960 to 25.3% in 1998 [1], and the forested area in Cambodia dropped from 73% in 1969 to 58% in 1997 [2].
Since artificial afforestation of commercial species such as teak has also been occurring in Indochina [3,4], very few forests exist in their natural state. To develop suitable forestry management practices for this region, a first urgent task is to assemble information on the various natural and artificial forest types, considering the climatic characteristics of the seasonal tropics.
Several studies have examined water cycles and resources in the Asian monsoon region, focusing on deforestation and certain regional climatic features. Using a gradient model, Pinker et al. [5] reported that evapotranspiration rates in the dry evergreen forest at the Sakaerat
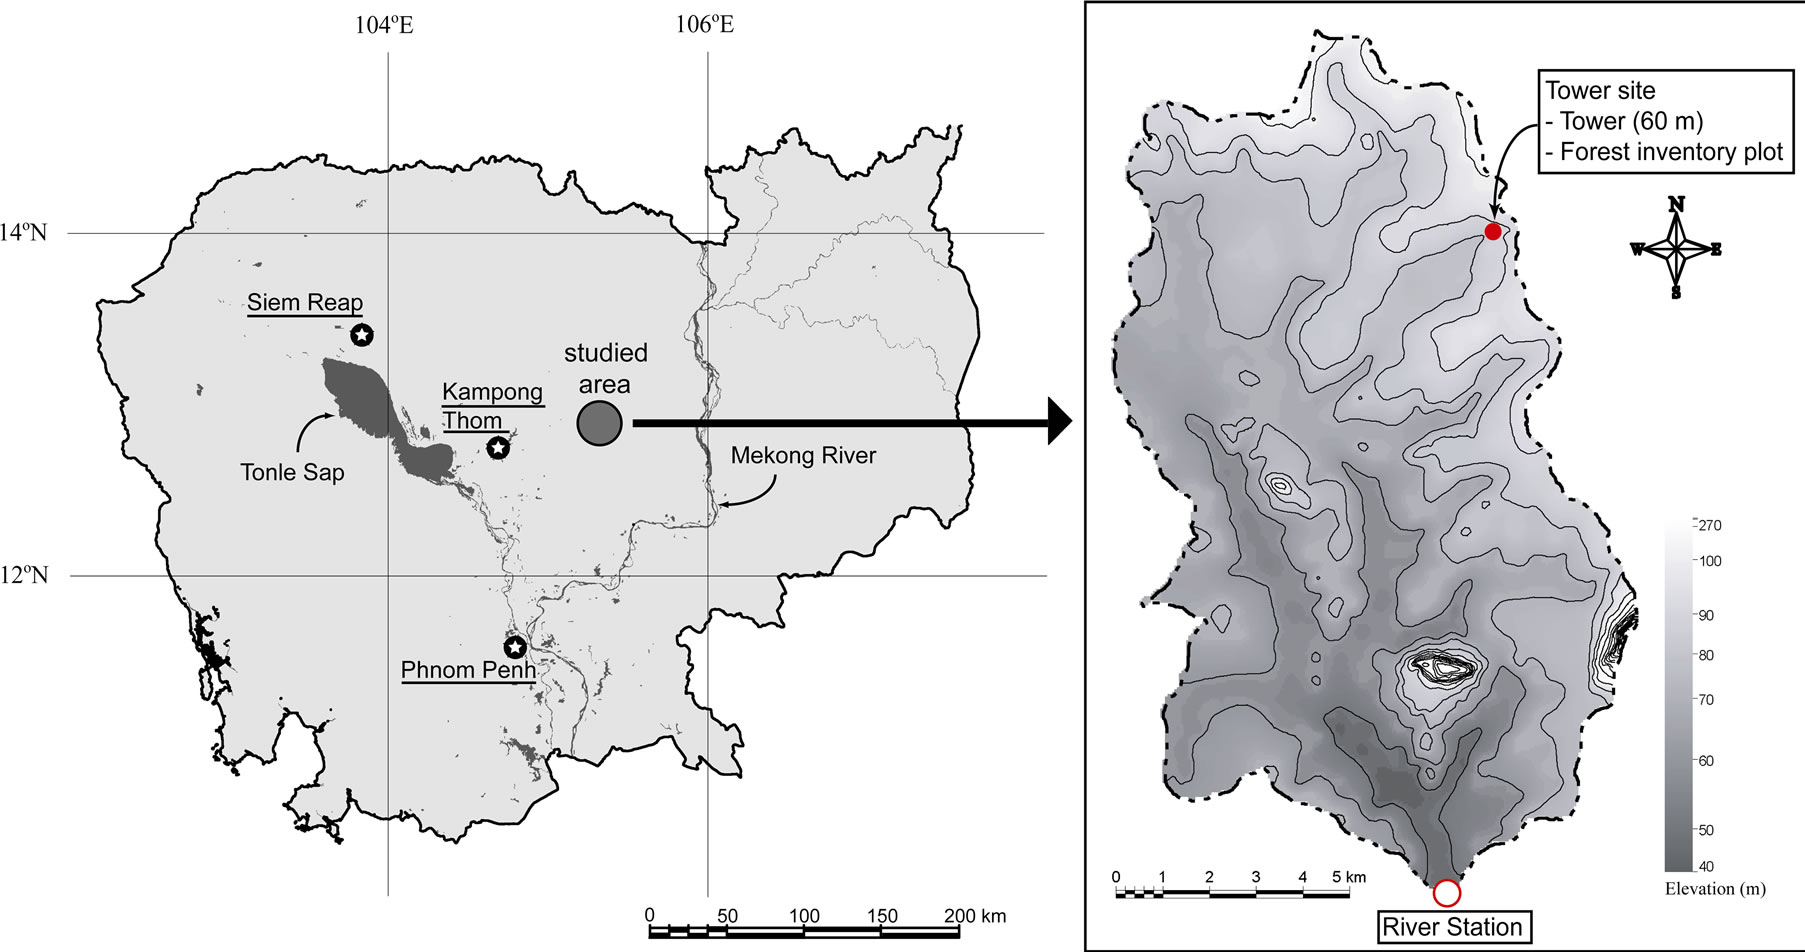
Figure 1. Location of the observation points in the O Thom I watershed.The contour interval of the topographic map is 10 m.
Environmental Research Station in Thailand was highest in June (rainy season; 3.3 mm day-1) and lowest in January (dry season; 0.6 mm day-1). Using the energy balance Bowen ratio (EBBR) method, Attarod et al. [6] also reported higher evapotranspiration rates during the rainy season (4.1 mm day-1) than in the defoliated dry season (2.5 mm day-1) for an artificial teak forest at Mae Moh in northern Thailand. However, Tanaka et al. [7], measuring evapotranspiration by the eddy correlation method for a hill evergreen forest in the Kog-Ma watershed of northern Thailand, reported that transpiration peaks appeared during the late dry season. At Kog-Ma, the water budget, canopy rainfall interception, sap flow, and soil water content were also measured, and both soil moisture and root system development were determined to be sufficient throughout the year that suppressed transpiration did not occur during the dry season [8,9].
As noted above, in the dry season of the Indochina Peninsula, transpiration decreases in some forests, whereas brisk transpiration continues in other forests. Differences in transpiration may be caused by differences in tree species and site environments such as soil depth or root system development. Thus, it is important to accumulate information on various forest types [10,11].
Lowland dry evergreen forest was once widely distributed over the Indochina Peninsula. Currently, however, this forest type is found only in limited areas, such as Kampong Thom Province in central Cambodia. Given the strong development pressures and lack of previous research on lowland forests, the need to gather information on lowland dry evergreen forest is particularly urgent.
This paper presents the results of evapotranspiration observations using the EBBR method in a lowland dry evergreen forest located in Kampong Thom Province. The characteristics of evapotranspiration are also described based on comparison with model simulations for the study forest; the simulations were conducted by a multilayer model that was previously applied to a hill evergreen forest of the Kog-Ma experimental watershed in Thailand [7].
2. Site Description and Observations
2.1. Site Description
The study was conducted at the O Thom I experimental watershed in Kampong Thom Province, Cambodia. The O Thom I River is a branch of the Stung Chinit River which feeds the Tonle Sap River, a major tributary of the Mekong River in central Cambodia. The O Thom I watershed covers an area of 137 km2, with altitude ranging between 46 and 273 m. Kabeya et al. [12] reported that annual precipitation in 2004 was around 1500 mm at the Stung Chinit River, and monthly averaged temperature ranged from 26.8 to 30.2ºC.
We constructed a 60-m-high observation tower from which meteorological elements were measured in the northeast part of the O Thom I experimental watershed (12º44'N, 105º28'E, 88 m a.s.l.; Figure 1). The topography near the tower was rather flat.
Vegetation at the experimental watershed consisted of broad-leaved evergreen trees such as dipterocarp species.
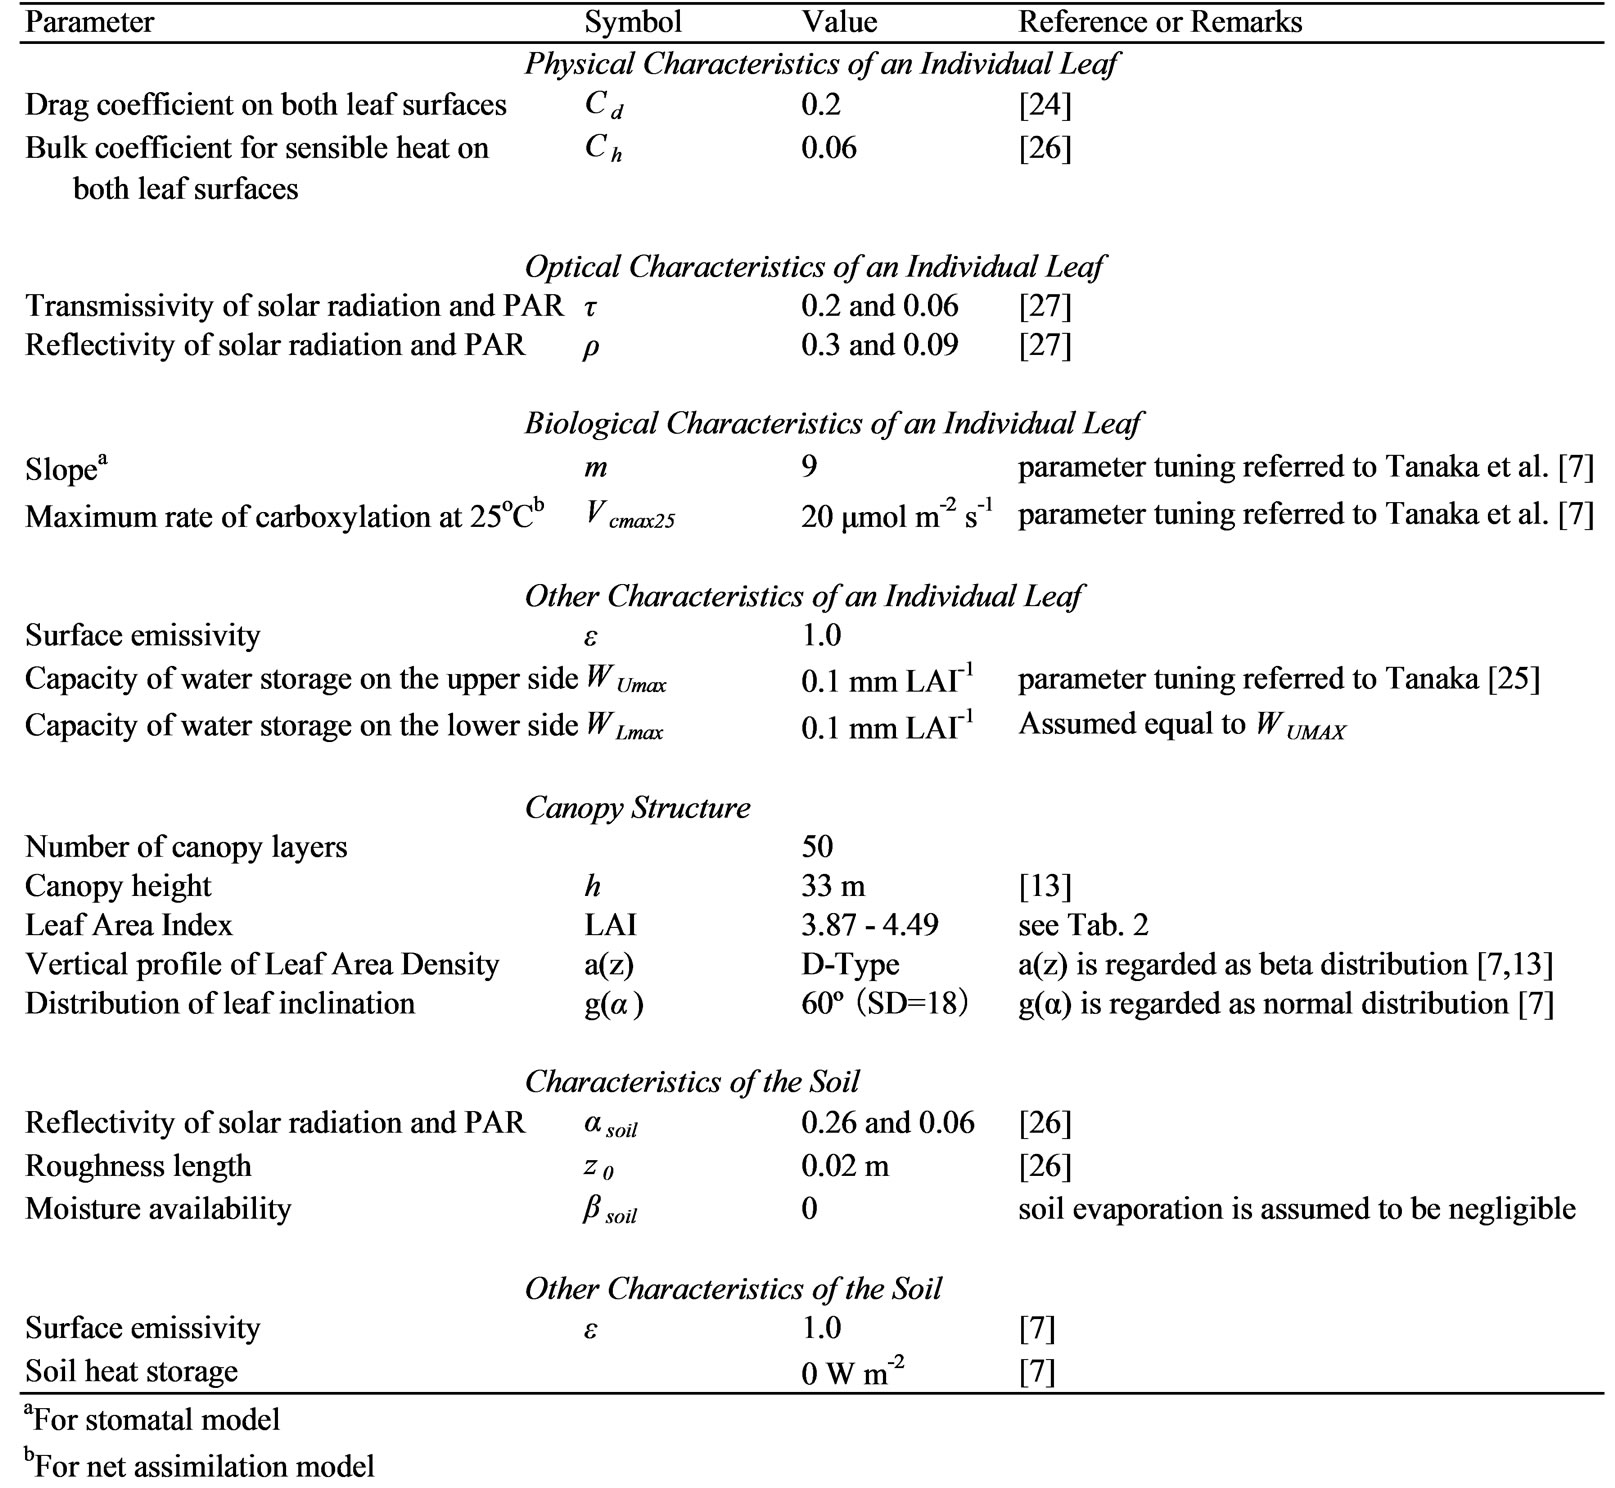
Table 1. Parameters used in the simulation.
The vegetation near the meteorological observation tower was analyzed in great detail. The mean diameter at breast height and the mean tree height of overstory trees were 39.6 cm and 27.2 m, respectively. The maximum tree height was about 45 m. Although the upper canopy trees were low in density (512 stems ha-1), they covered a large area of the canopy, with some secondary layer trees filling crown gaps between trees in the upper canopy [13]. Within the O Thom I watershed, the soil group was identified as acrisol [14] with a soft soil layer reaching to a depth of at least 7 m [15]. Ohnuki et al. [11] reported that the lowland dry evergreen forested area had a maximum water storage capacity of 1350 mm.
2.2. Observation Scheme
Our analysis of evapotranspiration and water balance in the O Thom I watershed parallels the study of Shimizu et al. [16], who also measured precipitation, runoff, shallow groundwater level, soil moisture, and meteorological factors in an experimental watershed of Kyusyu Island in southeastern Japan.
Pyranometers (CM3, Kipp & Zonen) were installed 60 m above the ground at the top of the observation tower to monitor solar radiation and reflected radiation. Two ventilated psychrometers (MH-020T, Eko) were installed above the forest canopy at 34 and 38 m. A net radiometer (Q7.1, REBS) and a cup anemometer (3301-5, Young) were placed at 36 m, and two heat flux plates (MF-180M, Eko) were installed 2 cm under the forest soil near the tower. Atmospheric pressure measurements (mini-TROLL, Air brown) were carried out at Kbal Domrey (12°54'N, 105°28'E) 20 km north of the tower site and recorded every hour. The leaf area index (LAI) was estimated using a LAI-2000 plant canopy analyzer (LI-COR) and hemispherical photography at the end of each month. A rain gauge (RG-2M, Onset) was installed at 60 m height on 25 April 2004. Pyrgeometers (CGR-3, Kipp & Zonen) were temporarily placed at the top of the tower, and intensive observations of upward and downward longwave radiation were carried out from 27 February to 2 March 2006. Meteorological measurements, including of soil heat flux, were taken at 10-s intervals near the tower and recorded as 10-min averages (or cumulative values) using a data logger (CR10X, Campbell). The primary meteorological observations for this study were made throughout the year in 2004.
To confirm the instrumental accuracy of the ventilated psychrometers, which has a large effect on the Bowen ratio calculation, verifications were carried out every 3 months. The psychrometers were set at the same height, and inter-variation of the equipment was checked. At the same time, dryand wet-bulb temperatures were also calibrated using an Asman psychrometer (Y-6005K, YOSHINO).
2.3. Estimation of Evapotranspiration by the Energy Balance Bowen Ratio Method
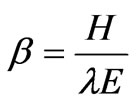
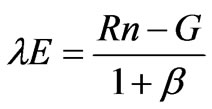
The energy balance Bowen ratio (EBBR) method, which measures the energy budget above the forest canopy from the profiles of potential temperature and water vapor pressure, was used to estimate evapotranspiration as described by Hattori [17] and Kaimal and Finnigan [18]. The method assumes that the diffusion coefficients of the latent and sensible heat fluxes are equal at the atmospheric surface layer. Therefore, the Bowen ratio (β) can be used to estimate latent heat flux as follows:
 , (1)
, (1)
 , (2)
, (2)
where Rn is the net radiation (including net shortwave and longwave radiation), H is the sensible heat flux, λE is the latent heat flux, and G is the ground heat flux. The Bowen ratio can then be calculated by measuring the dryand wet-bulb temperatures at the two levels and incorporating the psychrometric constant and the gradient of the saturation vapor pressure curve as follows:
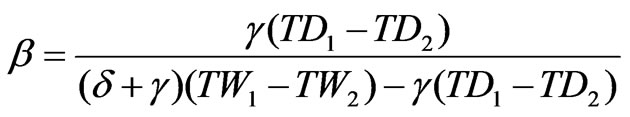 , (3)
, (3)
where γ is the psychrometric constant, δ is the gradient of the saturated vapor pressure curve at the average value of the wet-bulb temperatures, and TD1 – TD2 and TW1 – TW2 are the differences between dryand between wet-bulb temperatures at the two heights (34 and 38 m), respectively. All data required to solve these equations were collected using the instruments mentioned above.
When applying the EBBR method, atmospheric stability is preferable in a nearly neutral condition [19]. Tamai et al. [20] reported that the degree of atmospheric stability in O Thom I experimental watershed is generally suitable for tower flux measurements, including by the EBBR method. Moreover, as described above, we paid careful attention to maintaining the instrumental accuracy of the psychrometers; therefore, we expect that our observational results obtained by the EBBR method are highly reliable.
3. Multilayer Model for Evapotranspiration
The multilayer model that had been previously applied to the hill evergreen forest at Kog-Ma experimental watershed [7,9] was applied to the lowland dry evergreen forest at O Thom I experimental watershed. In this chapter, we explain the required input data and the parameters used to apply the multilayer model to our experimental watershed.
3.1. Model Structure
The multilayer model consists of distinct physical processes and contains five sub-models that incorporate the following: 1) Reynolds stress and temperature, CO2, and H2O exchanges on leaves; 2) radiation transfer within the forest canopy; 3) atmospheric diffusion within and above the forest canopy; 4) energy balance on leaves and the ground surface; and 5) rainfall interception and water budget on the leaf surface.
The details of each sub-model are described below.
1) The Farquhar-type photosynthesis model [21] and Ball’s stomatal conductance model [22] are used for the CO2 and H2O exchanges of leaves.
2) The vertical profiles of leaf area density a(z) and the distribution of the leaf inclination angle g(α) are used to determine radiation transfer.
3) A second-order closure sub-model [23] is used to simulate atmospheric transfer within and above the forest canopy. This sub-model predicts the effect of a(z) on atmospheric diffusion from the soil surface to twice the canopy height [24].
4) For the energy balance sub-model, the heat storage in the leaves and the energy stored by photosynthesis are assumed to be negligible, and the radiation energy in each divided layer is estimated from the transmissivity and reflectivity of shortwave and longwave radiation apportioned into sensible and latent fluxes. The energy balance on the ground surface is estimated from the input radiation energy from the lowest layer and the soil heat flux [25].
5) The rainfall interception sub-model assumes that rainfall wets only the upper sides of leaves, whereas condensation wets both the upper and lower sides of leaves, and transpiration and CO2 exchange occur only at dry lower-leaf stomata. Moreover, this sub-model captures the effects of a(z) and g(α) on rainfall interception, which are important during the rainy season.
The multilayer model also assumes that wind velocity, air and leaf temperatures, humidity, and CO2 concentration are horizontally uniform, although it does consider the difference in photosynthetically active radiation (PAR) in sunlit and shaded areas [7].
3.2. Model Input
The data input to the multilayer model are solar elevation (SE), downward shortwave radiation (S↓), downward longwave radiation (L↓), horizontal wind velocity (u), air temperature (T), vapor pressure (e), CO2 partial pressure (c), and rainfall over the forest (P). The outputs are upward shortwave radiation (S↑), upward longwave radiation (L↑), net radiation (Rn), sensible heat flux (H), latent heat flux (λE), CO2 flux (Fc), and their respective vertical profiles. The multilayer model separates the latent heat flux into transpiration and evaporation components. Canopy structure, the characteristics of individual leaves, and information on soil characteristics are treated as the model parameters.
3.3. Model Parameters
To apply the multilayer model, we used the parameters shown in Table 1. The forests at the Kog-Ma experimental watershed in Thailand and the O Thom I experimental watershed in Cambodia differ. Therefore, we used parameters that are relevant to the canopy structure and leaf characteristics of Cambodian lowland dry evergreen forest.
Seasonal variations in the LAI were measured near the tower site (Table 2). The canopy was divided into 50 equal layers. Vertical profiles of the nondimensional leaf area density (a(z)h/LAI) were determined as a D-type beta distribution, defined as when the upper part of the canopy is denser [7], based on the vegetation structure inventory [13]. Meanwhile, the physical and optical characteristics of individual leaves, such as the drag and bulk coefficients for sensible heat, transmissivity and reflectivity of solar radiation, and photosynthetically active radiation were assumed to be the same as those reported by Tanaka et al. [7] for their hill evergreen forest site in Thailand.
The parameters relating to individual leaves or the canopy structure, such as slope (m), maximum rate of carboxylation at 25ºC (Vcmax25), and water storage capacity on the upper side of an individual leaf (WUmax), tended to have a large effect on the simulation results in the parameter-tuning analysis of Tanaka et al. [7]. However, the characteristics of these parameters at the Cambodian lowland dry evergreen forest are obscure. Therefore, in this research, these three parameters were fixed throughout the observation period at values at which the annual amount of simulated evapotranspiration became
Table 2. Seasonal variation in the leaf area index obtained near the observation tower.
approximately equivalent to the observed result (see Table 1).
Because the soil water content at 100 cm depth maintained a wet soil condition during the dry season [28], and the ground water level was approximately 3 m below the ground surface even at the end of the dry season [29], we assumed that drying within the soil did not occur during the analysis period. Evaporation from the forest floor was considered to be negligible because the forest canopy was very dense, and thus radiation transfer to the soil surface was assumed to be very small.
Rainfall at the tower site was measured from 25 April 2004. Generally, the period from January to April corresponds to the dry season [13,30]; because we did not record rainfall for this period, we used input values of zero rainfall for our multilayer model during this period. We do not consider this assumption to contradict because the ground water level gradually decreased during the period in 2004 for which data are lacking [28]. The time interval for our multilayer model simulation was 10 min, corresponding to the interval between individual meteorological measurements.
4. Results and Discussions
4.1. Seasonal Variation in Each Meteorological Component
Figure 2 shows the seasonal variations in observed and estimated components averaged (or integrated) every three days. The seasonal variations in solar elevation at noon calculated from the latitude and longitude of the tower site (SE), and observed S↓ and S↑, are shown in Figure 2 (a). The solar elevation was maximal in April and August, corresponding to the late dry season and the middle of the rainy season, respectively. The downward shortwave radiation during the rainy season was almost the same as that during the dry season. The integrated values of downward and upward shortwave radiation in 2004 were 6.84 and 0.76 GJ m-2 year-1, respectively. The mean value of albedo during the observation period was 0.111. Figure 2(b) shows the seasonal variation in L↓ and L↑ estimated from the meteorological elements (see Appendix). Figure 2(c) presents the seasonal variation in air temperature observed at a height of 34 m (TD1). The lowest air temperature was during the early dry season (<25ºC), and the highest was during the late dry season (>30ºC). In contrast, temperatures did not fluctuate much during the rainy season, with an average value of approximately 27ºC. Figure 2(d) gives the vapor pressure
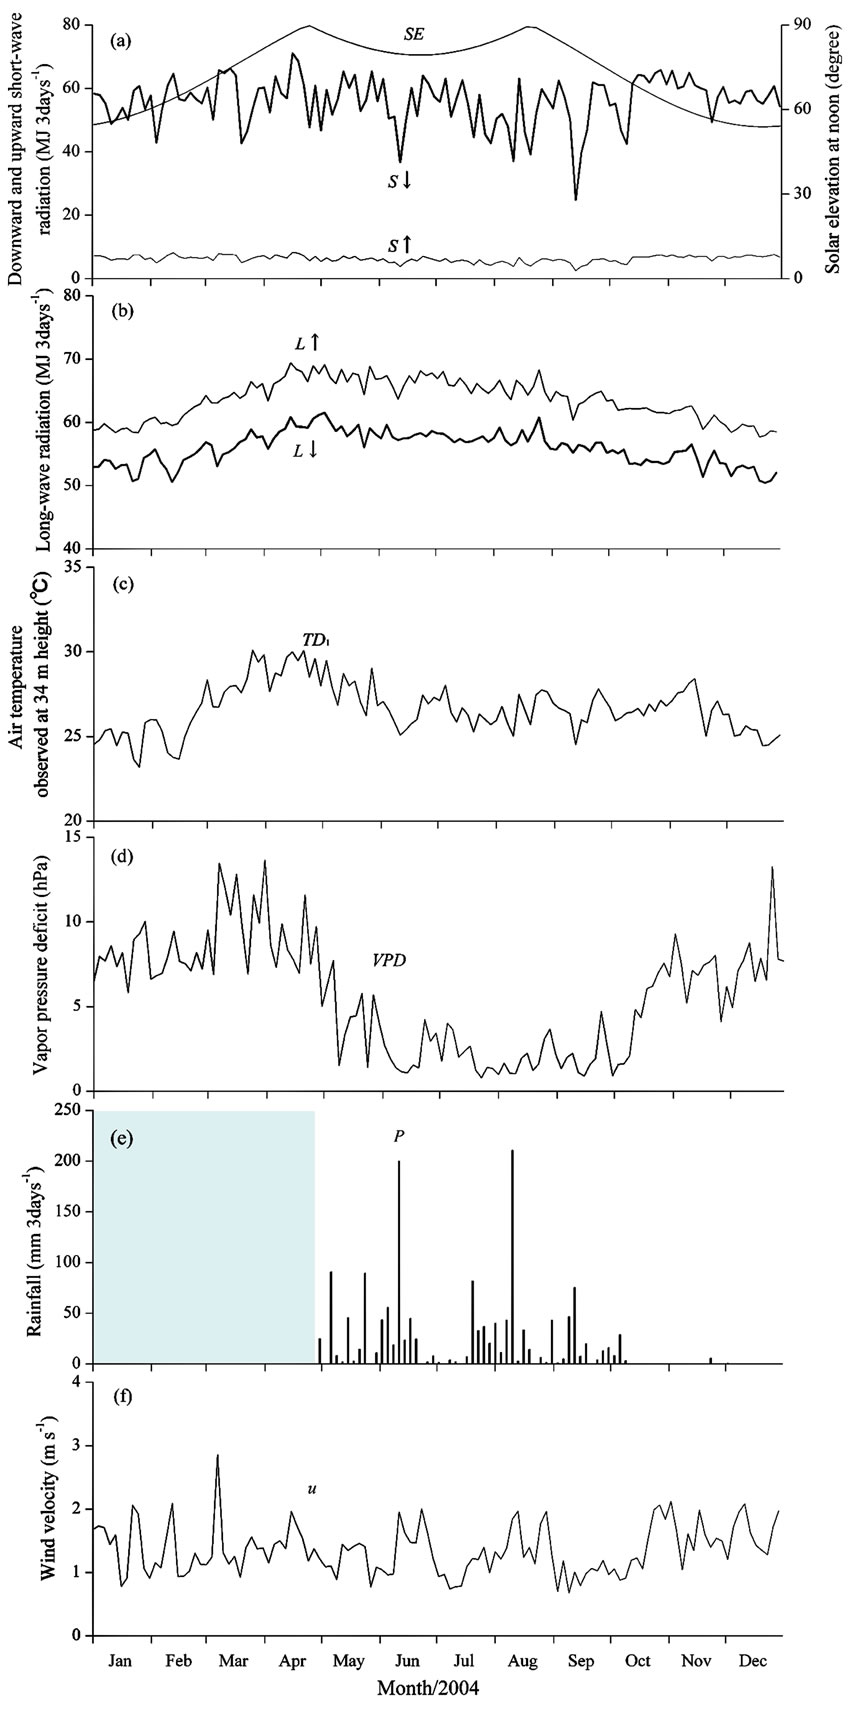
Figure 2. Seasonal variation in (a) solar elevation at noon (SE), downward shortwave radiation (S↓), and upward shortwave radiation (S↑); (b) downward longwave radiation (L↓) and upward longwave radiation (L↑); (c) air temperature (TD1); (d) vapor pressure deficit (VPD); (e) rainfall (P), shading indicates a period lacking data; and (f) wind velocity (u). All values were averaged or integrated every three days.
deficit (VPD) at a height of 34 m, which indicates the dryness of the air. The figure shows a clear tendency of high VPD during the dry season (>5 hPa) and low VPD throughout the rainy season (<5 hPa). Figure 2 (e) illustrates the seasonal variation in rainfall (P) from 25 April onward. Rainfall exceeded 200 mm over 3 days-1 twice during the rainy season. In addition, a short dry season, namely a period with little rain during the rainy season [31], was clearly observed between the end of June and the middle of July. The dry season commenced in the middle of October with very little subsequent rainfall. Figure 2 (f) shows the seasonal variation in wind velocity observed at a height of 36 m (u). Although we expected that wind velocity would be high during the rainy season, we did not observe any clear seasonal variation in wind velocity.
From these results, we roughly classified three seasons for the study watershed: 1) an early dry season with cool, dry air and little rain; 2) a late dry season with hot, dry air and little rain; and 3) a rainy season with much rain. Each period corresponded to January to the middle of February and the end of October to December, the end of February to the beginning of May, and the middle of May to the middle of October, respectively.
4.2. Observational Results for Evapotranspiration by the EBBR Method
Figure 3 shows the seasonal variation in evapotranspiration calculated by the EBBR method. The vertical bars show the standard deviations in each period. When seasonal variation in evapotranspiration in 2004 was considered, the average value of evapotranspiration during the rainy season (middle of May to middle of October) was 2.3 mm day-1, which was less than the average value during the dry season (3.5 mm day-1). Additionally, peaks in the evapotranspiration rate were also observed at the late dry season (7 March 2004: 5.7 mm day-1) and the beginning of the dry season (29 October 2004: 5.5 mm day-1).
As shown in Figures 2(a) and (b), no large seasonal variations in S↓, S↑, L↓, and L↑ between the dry season and rainy season were found at this site. The highest temperature was found in the first half of the dry season, followed by the rainy season, and then the latter half of the dry season; this seasonal order differed from the seasonal variation in observed evapotranspiration. On the other hand, as shown in Figure 2(d), we found a clear difference in VPD between the dry and rainy seasons. These results suggest that larger evapotranspiration in the dry season than in the rainy season originated from the seasonal variation in the VPD.
Stomatal aperture at the leaf level is modeled as the increase in VPD leading to stomatal closure [32]. Based on this concept, increasing VPD seems to lead to decreasing evapotranspiration. Meanwhile, transpiration at the community level is composed of equilibrium evaporation and imposed evaporation, defined by the proportionality relation to effective radiation, and multiplication of VPD and stomatal conductance, respectively [33]. Based on this definition, the increment of VPD may cause an increase in transpiration. Furthermore, even in
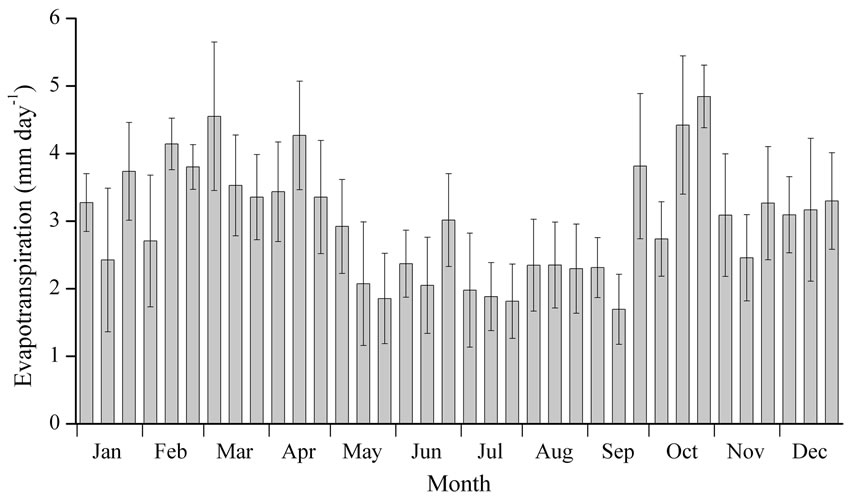
Figure 3. Daily amount of evapotranspiration by the EBBR method in 2004 shown as monthly based 10-day averages. Vertical bars indicate standard deviations for each observation period.
the dry season, deeper soil remained wet in our experimental watershed [11,28,29]. Therefore, trees could obtain sufficient water even during the dry season with high VPD; thus, little stomatal closure may have occurred at the study site. Therefore, the depression rate of stomatal conductance accompanying the increment in VPD would not be so large, and as a result, the imposed evaporation may increase with the high VPD.
4.3. Comparison Between Observed and Simulated Evapotranspiration
Figure 4 presents the evapotranspiration rates obtained from the observations through EBBR method and from the multilayer model. Each point shows the observed and simulated daily evapotranspiration rates averaged over three days.
In this study, we used the following types of parameters in the multilayer model: 1) those obtained from direct measurement of a lowland dry evergreen forest in Cambodia (e.g., LAI, canopy height); 2) those identified in the hill evergreen forest at Kog-Ma, Thailand (e.g., physical and optical characteristics of an individual leaf); and 3) those determined based on the annual amount of simulated evapotranspiration’s becoming approximately the same as the observed result (m, Vcmax25, and WUmax). Therefore, the model did not necessarily represent the present condition of the lowland dry evergreen forest in O Thom I. However, the model substantially reproduced the observed result of larger evapotranspiration in the dry season by the EBBR method. Therefore, many of the parameters assumed in this research may have roughly expressed the characteristics of the Cambodian lowland dry evergreen forest.
Because some parameter values were determined by the simulated total amount of evapotranspiration nearing the observation result, the values estimated by the multilayer model were sometimes more or less than observed values. The observed evapotranspiration exceeded the
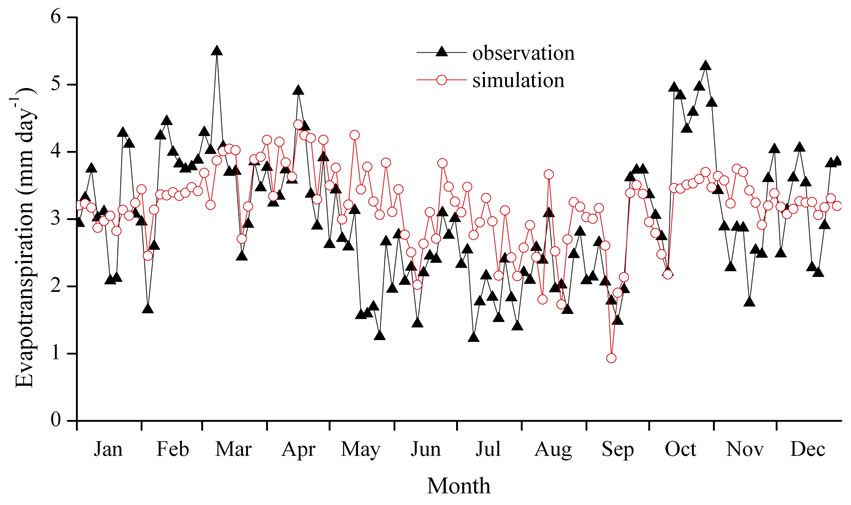
Figure 4. Comparison between observed (closed triangles) and simulated (open circles) daily amounts of evapotranspiration in 2004 averaged every three days.
simulated values during the late dry season (middle of February to the beginning of March) and at the beginning of the dry season (beginning of October), as noted in the first paragraph of Section 4.2. These periods coincided mostly with the peak of seasonal variation in evapotranspiration. Furthermore, during the rainy season, the model results overall tended to exceed the observed evapotranspiration.
Seasonal variation in the physiological characteristics of individual leaves may be one explanation for why the model did not reproduce the two peaks of observed evapotranspiration during the dry season and overestimated evapotranspiration in the rainy season. In the model simulation conducted in this study, parameters such as the photosynthetic rate and stomatal aperture of each leaf were assumed to be fixed values. However, the photosynthetic rate is known to reach maximum values at the time of foliation and then decline with advancing leaf age [34−36]. Such a phenological feature has also been recognized in photosynthesis observations of evergreens in other tropical regions [37,38]. The stomatal conductance of evergreen trees has also been demonstrated to fluctuate seasonally due to variation in environmental factors such as meteorological conditions and soil aridity in the seasonal tropics [39−43]. Therefore, the parameters concerning the assimilation rate and stomatal aperture at our study site might also change with the maturity and senescence of leaves.
Leaf dynamics clearly display seasonal changes in the evergreen forests of the study area. Investigations of litter fall and the LAI showed that leaf abscission and foliation became active at the beginning and late parts of the dry season (E. Ito, unpublished data). Therefore these phenological characteristics thus probably did not agree with fixed assumptions for parameters of photosynthesis and evapotranspiration throughout the year. However, many tree species with various phenologies intermingle with the evergreen forest neighboring the meteorological observation site; on the whole, the seasonal variation in physiological characteristics for the various species has
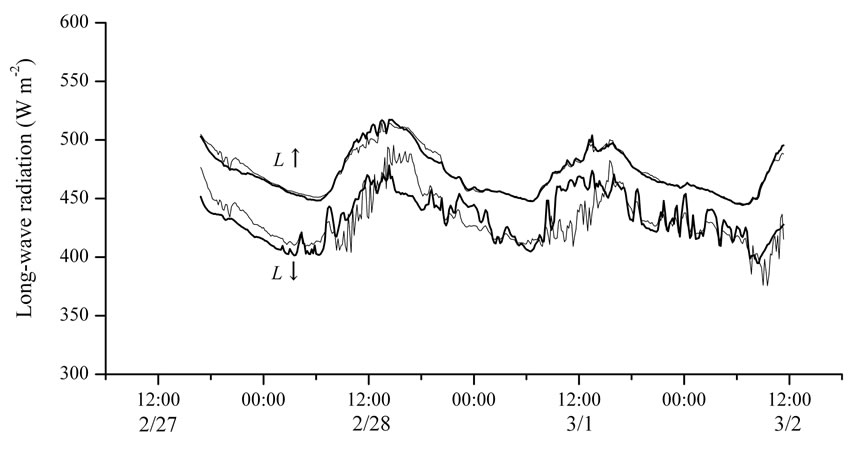
Figure 5. Time series of longwave radiation from 27 February to 2 March 2006. L↓ and L↑ indicate downward and upward longwave radiation, respectively, and the thick and thin lines indicate observed and estimated values, respectively.
not yet been clarified quantitatively. Therefore, we presently do not have enough information to explain the peaks of evapotranspiration during the dry season by the physiology of individual leaves alone or to reflect this issue in the model simulation. However, on the basis of the above discussion, we suggest that seasonal variation in the physiological characteristics of individual leaves of various tree types in the surrounding forest had a large effect on the evapotranspiration in the O Thom I experimental watershed. The observational findings of the transpiration peak during the dry season and the higher daily amount of evapotranspiration in the dry season than in the rainy season would be strongly affected by those seasonal variations.
A next research step will be to further investigate the characteristics of tree physiology postulated on the basis of the model simulation in this study.
5. Conclusions
This study confirmed the following findings. From meteorological observations, we could roughly classify three seasons for a lowland dry evergreen forest in central Cambodia: an early dry season, a late dry season, and a rainy season. We then used the energy balance Bowen ratio (EBBR) method to observe the evapotranspiration rate. The daily evapotranspiration amount was higher in the dry season (3.5 mm day-1) than in the rainy season (2.3 mm day-1). The high vapor pressure deficit during the dry season likely had a large effect on the higher evapotranspiration during the dry season. The finding of higher evapotranspiration in the dry season than in the rainy season was also reproduced by the multilayer model of Tanaka et al. [7].
However, our results also showed differences between the simulation and observation. During the beginning and late parts of the dry season, observed evapotranspiration was greater than simulated evapotranspiration. In contrast to the dry season, simulated evapotranspiration during the rainy season tended to be larger than observed evapotranspiration. The above results suggest that one cause of the quantitative difference in observed and simulated evapotranspiration in some periods was the seasonal variation in physiological characteristics such as photosynthesis and/or transpiration, which we treated as constant parameters in the multilayer model simulation.
Further investigation of physiological and phenological features accompanied by continuous observation of evapotranspiration in lowland dry evergreen forest of Cambodia would help clarify the above suggestions.
6. Acknowledgments
This study was partly funded by the Ministry of the Environment, Japan (Global Environment Research Coordination System). We also thank Mr. Ty Sokhun, Director General of the Forestry Administration of Cambodia, and our Cambodian colleagues of the Forest and Wildlife Science Research Institute, Cambodia.
7. Appendixes
7.1. Estimation of Downward Longwave Radiation
Downward longwave radiation was a necessary input for the multilayer model. However, only short-term observations of upward longwave radiation (L↑) and downward longwave radiation (L↓) were carried out in this study. For this reason, it was necessary to presume downward longwave radiation (L↓) throughout the period. We explain the method that we used to presume L↓ in this section.
Net radiation (Rn) is composed of shortwave and longwave radiation, as given in Equation (4):
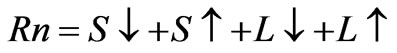 . (4)
. (4)
Here, with radiation energy from the black body proportionate to the fourth power of the absolute temperature, the following equation is approved at the canopy surface:
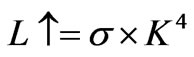 , (5)
, (5)
where σ is the proportionality constant value and K is the absolute temperature of the canopy surface. The temperature of the canopy surface was not measured; therefore the temperature observed at 34 m height was substituted into Equation (5) instead of the canopy surface temperature. Equation (6) was then rearranged as follows:
 , (6)
, (6)
where TD1 is the temperature observed at a height of 34 m. Then the following Equation (7) was obtained with reference to Equations (4) and (6):
 . (7)
. (7)
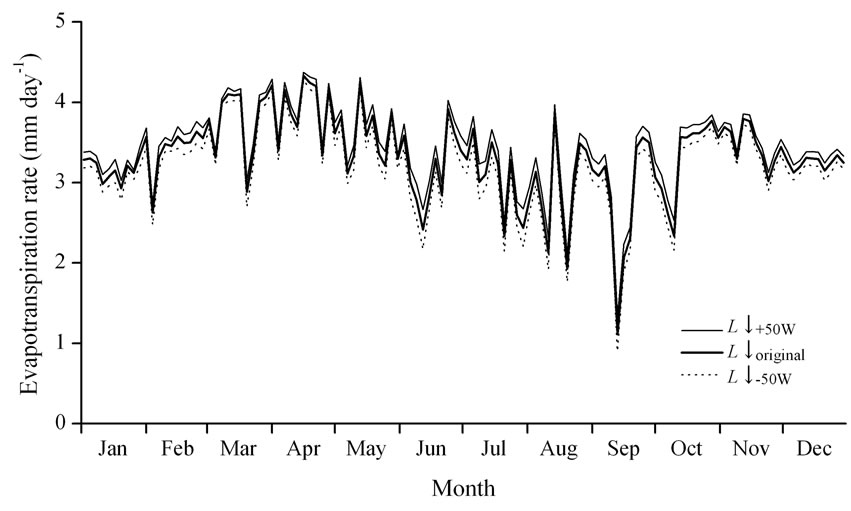
Figure 6. The effect of downward longwave radiation (L↓) on evapotranspiration during the daytime. The legends show the calculated evapotranspiration rate using L↓ (L↓original) estimated from Equations (7), with 50 W m-2 added to L↓ (L↓+50W), and with 50 W m-2 subtracted from L↓ (L↓-50W), respectively.
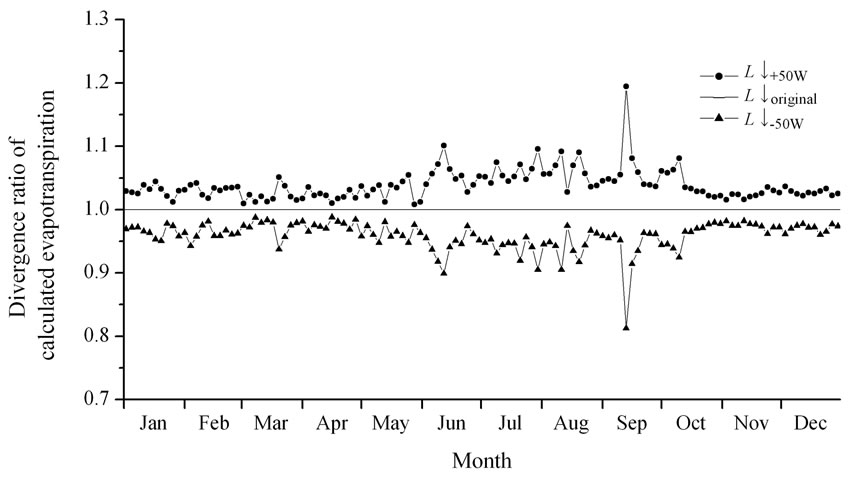
Figure 7. The divergence ratio, calculated by the divergence of the evapotranspiration with L↓+50W and L↓-50W from the evapotranspiration with the original L↓. The legends are the same as in Figure 6.
The estimated L↑ and L↓ obtained from Equations (6) and (7) were verified by observed L↑ and L↓ obtained during the intensive observation period from 27 February to 2 March 2006 (Figure 5). When σ was defined as 5.61 × 10⁻⁸ (W m-2 K-4), the coefficient of determination between observed and estimated L↓ was 0.54. Maximum estimation error in L↓ was about ±50 W m-2, and the difference between integral values of observed and estimated L↓ during the daytime was about 3%.
7.2. Effect of L↓ Error on Simulated Evapotranspiration
As mentioned above, the maximum estimation error in L↓ was approximately ±50 W m‑2. To verify that the effect of the L↓ estimation error on the calculated evapotranspiration rate changed between –50 and +50 W m-2, numerical simulation was performed. Figure 6 shows the seasonal variations in evapotranspiration obtained from the simulation results by using (1) L↓ estimated from σ = 5.61 × 10⁻⁸ (L↓original), (2) an increase of 50 W m-2 from L↓original (L↓+50W), and (3) a decrease of 50 W m-2 from L↓original (L↓-50W). The three simulations resulted in the same tendency of seasonal patterns of evapotranspiration.
Figure 7 shows the ratio of divergence in evapotranspiration obtained by the cases of L↓+50W and L↓-50W from the basic simulation result (L↓original). During the period when the net radiation was small, the estimation error of L↓ had a relatively large effect on the simulated radiation output, but during the other periods, the estimation error contributed less than 5%. However, when the accuracy of daily-integrated L↓ was considered, very little difference was observed between the numerical simulations illustrated in Figure 7. From the above, we concluded that the estimation method of L↓ used in this study was appropriate.
REFERENCES
- A. Nalampoon, “National forest policy review, Thailand,” in P. B. Durst Ed., “An overview of forest policies in Asia,” FAO, Bangkok, pp. 293–311, 2003.
- E. Savet and T. Sokhun, “National forest policy review, Cambodia,” in P. B. Durst Ed., “An overview of forest policies in Asia,” FAO, Bangkok, pp. 93–108, 2003.
- B. Krishnapillay, “Silviculture and management of teak plantations,” Unasylva, Vol. 201, pp. 14–21, 2000.
- A. Mittelman, “Teak planting by smallholders in Nakhon Sawan, Thailand,” Unasylva, Vol. 201, pp. 62–65, 2000.
- R. T. Pinker, O. E. Thompson, and T. F. Eck, “The energy balance of a tropical evergreen forest,” Journal of Applied Meteorology, Vol. 19, pp. 1341–1350, 1980.
- P. Attarod, M. Aoki, D. Komori, T. Ishida, K. Fukumura, S. Boonyawat, P. Tongdeenok, M. Yokoya, S. Punkngum, and T. Pakoktom, “Estimation of crop coefficients and evapotranspiration by meteorological parameters in a rain-fed paddy rice field, cassava and teak plantations in Thailand,” Journal of Agricultural Meteorology, Vol. 62, pp. 93–102, 2006.
- K. Tanaka, H. Takizawa, N. Tanaka, I. Kosaka, N. Yoshifuji, C. Tantasirin, S. Piman, M. Suzuki, and N. Tangtham, “Transpiration peak over a hill evergreen forest in northern Thailand in the late dry season: Assessing the seasonal changes in evapotranspiration using a multilayer model,” Journal of Geophysical Research, Vol. 108 (D17), pp. 4533, 2003.
- T. Kume, H. Takizawa, N. Yoshifuji, K. Tanaka, C. Tantasirin, N. Tanaka, and M. Suzuki, “Impact of soil drought on sap flow and water status of evergreen trees in a tropical monsoon forest in northern Thailand,” Forest Ecology and Management, Vol. 238, pp. 220–230, 2007.
- K. Tanaka, H. Takizawa, T. Kume, J. Xu, C. Tantasirin, and M. Suzuki, “Impact of rooting depth and soil hydraulic properties on the transpiration peak of an evergreen forest in northern Thailand in the late dry season,” Journal of Geophysical Research, Vol. 109, D23107, 2004.
- N. Tanaka, T. Kume, N. Yoshifuji, K. Tanaka, H. Takizawa, K. Shiraki, C. Tantasirin, N. Tangtham, and M. Suzuki, “A review of evapotranspiration estimates from tropical forests in Thailand and adjacent regions,” Agricultural and Forest Meteorology, Vol. 148, pp. 807–819, 2008.
- Y. Ohnuki, C. Kimhean, Y. Shinomiya, and J. Toriyama, “Distribution and characteristics of soil thickness and effects upon water storage in forested areas of Cambodia,” Hydrological Processes, Vol. 22, pp. 1272–1280, 2008.
- N. Kabeya, A. Shimizu, T, Nobuhiro, and K. Tamai, “Preliminary study of flow regimes and stream water residence times in multi-scale forested watersheds of central Cambodia,” Paddy and Water Environment, Vol. 6, pp. 25–35, 2008.
- A. Shimizu, N. Kabeya, T. Nobuhiro, T. Kubota, Y. Tsuboyama, E. Ito, M. Sano, S. Chann, and N. Keth, “Runoff characteristics and observations on evapotranspiration in forest watersheds, central Cambodia,” in H. Sawada et al. Ed., “Forest Environments in the Mekong River Basins,” Springer, Tokyo, pp. 135–146, 2007.
- J. Toriyama, S. Ohta, M. Araki, M. Kanzaki, S. Khorn, P. Pith, S. Lim, and S. Pol, “Soils under different forest types in the dry evergreen forest zone of Cambodia: Morphology, physicochemical properties, and classification,” in H. Sawada et al. Ed., Forest Environments in the Mekong River Basins,” Springer, Tokyo, pp. 241–253, 2007.
- Y. Ohnuki, C. Kimhean, Y. Shinomiya, S. Sor, J. Toriyama, and S. Ohta, “Apparent change in soil depth and soil hardness in forest areas in Kampong Thom province, Cambodia,” in H. Sawada et al. Ed., “Forest Environments in the Mekong River Basins,” Springer, Tokyo, pp. 263–272, 2007.
- A. Shimizu, T. Shimizu, Y. Miyabuchi, and Y. Ogawa, “Evapotranspiration and runoff in a forested watershed, western Japan,” Hydrological Processes, Vol. 17, pp. 3125–3139, 2003.
- S. Hattori, “Explanation on derivation process of equations to estimate evapotranspiration and problems on the application to forest stand,” Bulletin of the Forestry and Forest Products Research Institute, Japan, Vol. 332, pp. 139–165, 1985.
- J. C. Kaimal and J. J. Finnigan, “Atmospheric boundary layer flows: Their structure and measurement,” Oxford University Press, New York, 1994.
- W. Brutsaert, Ed., “Evaporation into the atmosphere: theory, history, and applications,” D. Reidel Publishing Company, 1982.
- K. Tamai, T. Nobuhiro, A. Shimizu, N. Kabeya, S. Chann, and K. Nang, “Characteristics of atmospheric stability above an evergreen forest in central Cambodia,” Hydrological Processes, Vol. 22, pp. 1267–1271, 2008.
- G. D. Farquhar, S. V. Caemmerer, and J. A. Berry, “A biochemical model of photosynthetic CO2 assimilation in leaves of C3 species,” Planta, Vol. 149, pp. 78–90, 1980.
- J. T. Ball, “An analysis of stomatal conductance,” Ph.D thesis, Stanford University, Stanford, California, 1988.
- T. Watanabe, “The bulk transfer coefficients over a vegetated surface based on K-theory and 2nd-order closure model,” Journal of the Meteorological Society of Japan, Vol. 71, pp. 33–42, 1993.
- N. R. Wilson and E. H. Shaw, “A higher order closure model for canopy flow,” Journal of Applied Meteorology, Vol. 16, pp. 1197–1205, 1977.
- K. Tanaka, “Multi-layer model of CO2 exchange in a plant community coupled with the water budged of leaf surfaces,” Ecological Modelling, Vol. 147, pp. 85–104, 2002.
- K. Tanaka, Y. Kosugi, N. Ohte, S. Kobashi, and A. Nakamura, “Model of CO2 flux between a plant community and the atmosphere, and simulation of CO2 flux over a planted forest,” (in Japanese with an English abstract) Japanese Journal of Ecology, Vol. 48, pp. 265–286, 1998.
- J. Ross, “Radiative transfer in plant communities,” in J. L. Monteith Ed., “Vegetation and the atmosphere,” Vol. 1, Academic Press, California, pp. 13–55, 1975.
- M. Araki, J. Toriyama, S. Ohta, M. Kanzaki, E. Ito, B. Tith, S. Pol, S. Lim, S. Khorn, P. Pith, and S. Det, “Soil moisture conditions in four types of forests in Kampong Thom, Cambodia,” in H. Sawada et al. Ed., “Forest environments in the Mekong river basins,” Springer, Tokyo, pp. 254–262, 2007.
- M. Araki, A. Shimizu, J. Toriyama, E. Ito, N. Kabeya, T. Nobuhiro, B. Tith, S. Pol, S. Lim, S. Khorn, P. Pith, S. Det, S. Ohta, and M. Kanzaki, “Changes of vertical soil moisture conditions of a dry evergreen forest in Kampong Thom, Cambodia,” in H. Sawada et al. Ed., “Forest environments in the Mekong river basins,” Springer, Tokyo, pp. 112–124, 2007.
- N. Kabeya, A. Shimizu, S. Chann, Y. Tsuboyama, T. Nobuhiro, N. Keth, and K. Tamai, “Stable isotope studies of rainfall and stream water in forest watersheds in Kampong Thom, Cambodia,” in H. Sawada et al. Ed., “Forest environments in the Mekong river basins,” Springer, Tokyo, pp. 125–134, 2007.
- J. Matsumoto, “Seasonal transition of summer rainy season over Indochina and adjacent monsoon region,” Advances in Atmospheric Sciences, Vol. 14, pp. 231–245, 1997.
- J. B. Stewart, “Modelling surface conductance of pine forest,” Agricultural and Forest Meteorology, Vol. 43, pp. 19–35, 1988.
- K. G. McNaughton and P. G. Jarvis, “Predicting effects of vegetation changes on transpiration and evaporation,” in T. T. Kozlowski Ed., “Water deficits and plant growth,” Academic Press, New York, Vol. 7, pp. 1–47, 1983.
- D. S. Ellsworth, “Seasonal CO2 assimilation and stomatal limitations in a Pinus taeda canopy,” Tree Physiology, Vol. 20, pp. 435–445, 2000.
- S. Mediavilla and A. Escudero, “Photosynthetic capacity, integrated over the lifetime of a leaf, is predicted to be independent of leaf longevity in some tree species,” New Phytologist, Vol. 159, pp. 203–211, 2003.
- Q. Han, T. Kawasaki, T. Nakano, and Y. Chiba, “Spatial and seasonal variability of temperature responses of biochemical photosynthesis parameters and leaf nitrogen content within a Pinus densiflora crown,” Tree Physiology, Vol. 24, pp. 737–744, 2004.
- K. Kitajima, S. S. Mulkey, and S. J. Wright, “Seasonal leaf phenotypes in the canopy of a tropical dry forest: Photosynthetic characteristics and associated traits,” Oecologia, Vol. 109, pp. 490–498, 1997.
- K. Kitajima, S. S. Mulkey, and S. J. Wright, “Decline of photosynthetic capacity with leaf age in relation to leaf longevities for five tropical canopy tree species,” American Journal of Botany, Vol. 84, pp. 702–708, 1997.
- F. C. Meinzer, G. Golostein, N. M. Holbrook, P. Jackson, and J. Cavelier, “Stomatal and environmental control of transpiration in a lowland tropical forest tree,” Plant, Cell and Environment, Vol. 16, pp. 429–436, 1993.
- P. B. Reich, “Phenology of tropical forests: Patterns, causes, and consequences,” Canadian Journal of Botany, Vol. 73, pp. 164–174, 1994.
- J. I. Pitman, “Ecophysiology of tropical dry evergreen forest, Thailand: measured and modelled stomatal conductance of Hopea ferrea, a dominant canopy emergent,” Journal of Applied Ecology, Vol. 33, pp. 1366–1378, 1996.
- D. S. Thomas, D. Eamus, and S. Shanahan, “Influence of season, drought and xylem ABA on stomatal responses to leaf-to-air vapour pressure difference of trees of the Australian wet-dry tropics,” Australian Journal of Botany, Vol. 48, pp. 143–151, 2000.
- K. Kitajima, S. S. Mulkey, M. Samaniego, and S. J. Wright, “Decline of photosynthetic capacity with leaf age and position in two tropical pioneer tree species,” American Journal of Botany, Vol. 89, pp. 1925–1932, 2002.