Journal of Water Resource and Protection
Vol. 1 No. 6 (2009) , Article ID: 1072 , 8 pages DOI:10.4236/jwarp.2009.16048
A Hydrogeophysical Model of the Relationship between Geoelectric and Hydraulic Parameters, Central Jordan
Department of Geology and Geophysics, King Saud University, Riyadh, Saudi Arabia
E-mail: awni@ksu.edu.sa
Received June 3, 2009; revised July 5, 2009; accepted November 2, 2009
Keywords: Aquifer Parameters, Electrical Parameters, Geoelectrical Soundings, Jordan
ABSTRACT
Geoelectrical soundings using the Schlumberger array were carried out in the vicinity of 23 pumping test sites to determine aquifer parameters, central Jordan. On the basis of aquifer geometry, the area has been divided into two hydraulic units: the northern flood plain and the flood plain to its south. Field resistivity data are interpreted in terms of the true resistivity and thickness of subsurface layers. These parameters are then correlated with the available pumping test data. Significant correlations between the transmissivity and modified transverse resistance as well as between the hydraulic conductivity and formation factor were obtained for the two hydraulic units, in central Jordan are presented here.
1. Introduction
The development of groundwater resources and the regime of its activity largely depend on the porosity and permeability of water bearing formations. The porosity of rock is a measure of the amount of interstitial space that is capable of holding fluids and the permeability (hydraulic conductivity) of a rock is a quantitative measure of the case with which it will permit the passage of fluids through it under a hydraulic gradient. The determination of aquifer characteristics such as hydraulic conductivity and transmissivity is best made on the basis of data obtained from test pumping wells. These properties are important in determining the natural flow of water through an aquifer and its response to fluid extraction. This paper examines the influence of aquifer anisotropy on the relationship between hydraulic and geoelectrical parameters of aquifers that are needed to develop a hydrogeophysical model for an anisotropic aquifer in parts of central Jordan.
An alternative approach for estimating aquifer characteristics is the use of surface geoelectrical methods. Many investigators have studied the relationship between electric and hydraulic parameters of aquifers. Jones and Buford [1] measured the formation factor and intrinsic permeability of sand samples and found that as the grain size increase, the formation factor and intrinsic permeability also increases. A relation between the aquifer intrinsic permeability and formation factor was developed for a given porosity range [2]. The resistivity and the formation factor of an aquifer have been correlated with the permeability [3]. Empirical and semi-empirical relations between different aquifer parameters and the parameters obtained by geoelectrical soundings under different geological conditions have also been studied by others [4–13]. The analytical relations between aquifer transmissivity and Dar-Zarrouk parameters have been developed and various data sets tested [14,15]. An inverse relationship between porosity and hydraulic conductivity were used to explain the direct correlations between formation factor and hydraulic conductivity [16,17]. Here we present the Schlumberger sounding results in the area of central Jordan to define the aquifer geometry of the study area.
2. Geology and Hydrogeology
2.1. Geological Setting
Physiographically, the study area lies between latitude 31o 29.54¢ N to 31o 45.03¢ N and 35o 59.58¢ E to 36o 14.56¢ E, central Jordan (Figure 1). Jaser [18] has given the detailed geology of the area. Bedrock in the investigated area is of sedimentary origin and of Upper Cretaceous to recent age (Figure 1). The oldest outcrops in the area are the Amman Silicified Limestone (ASL) Formation (of Campanian age) of the Balqa Group. In the mapped area (Figure 1), the rock formation consists of
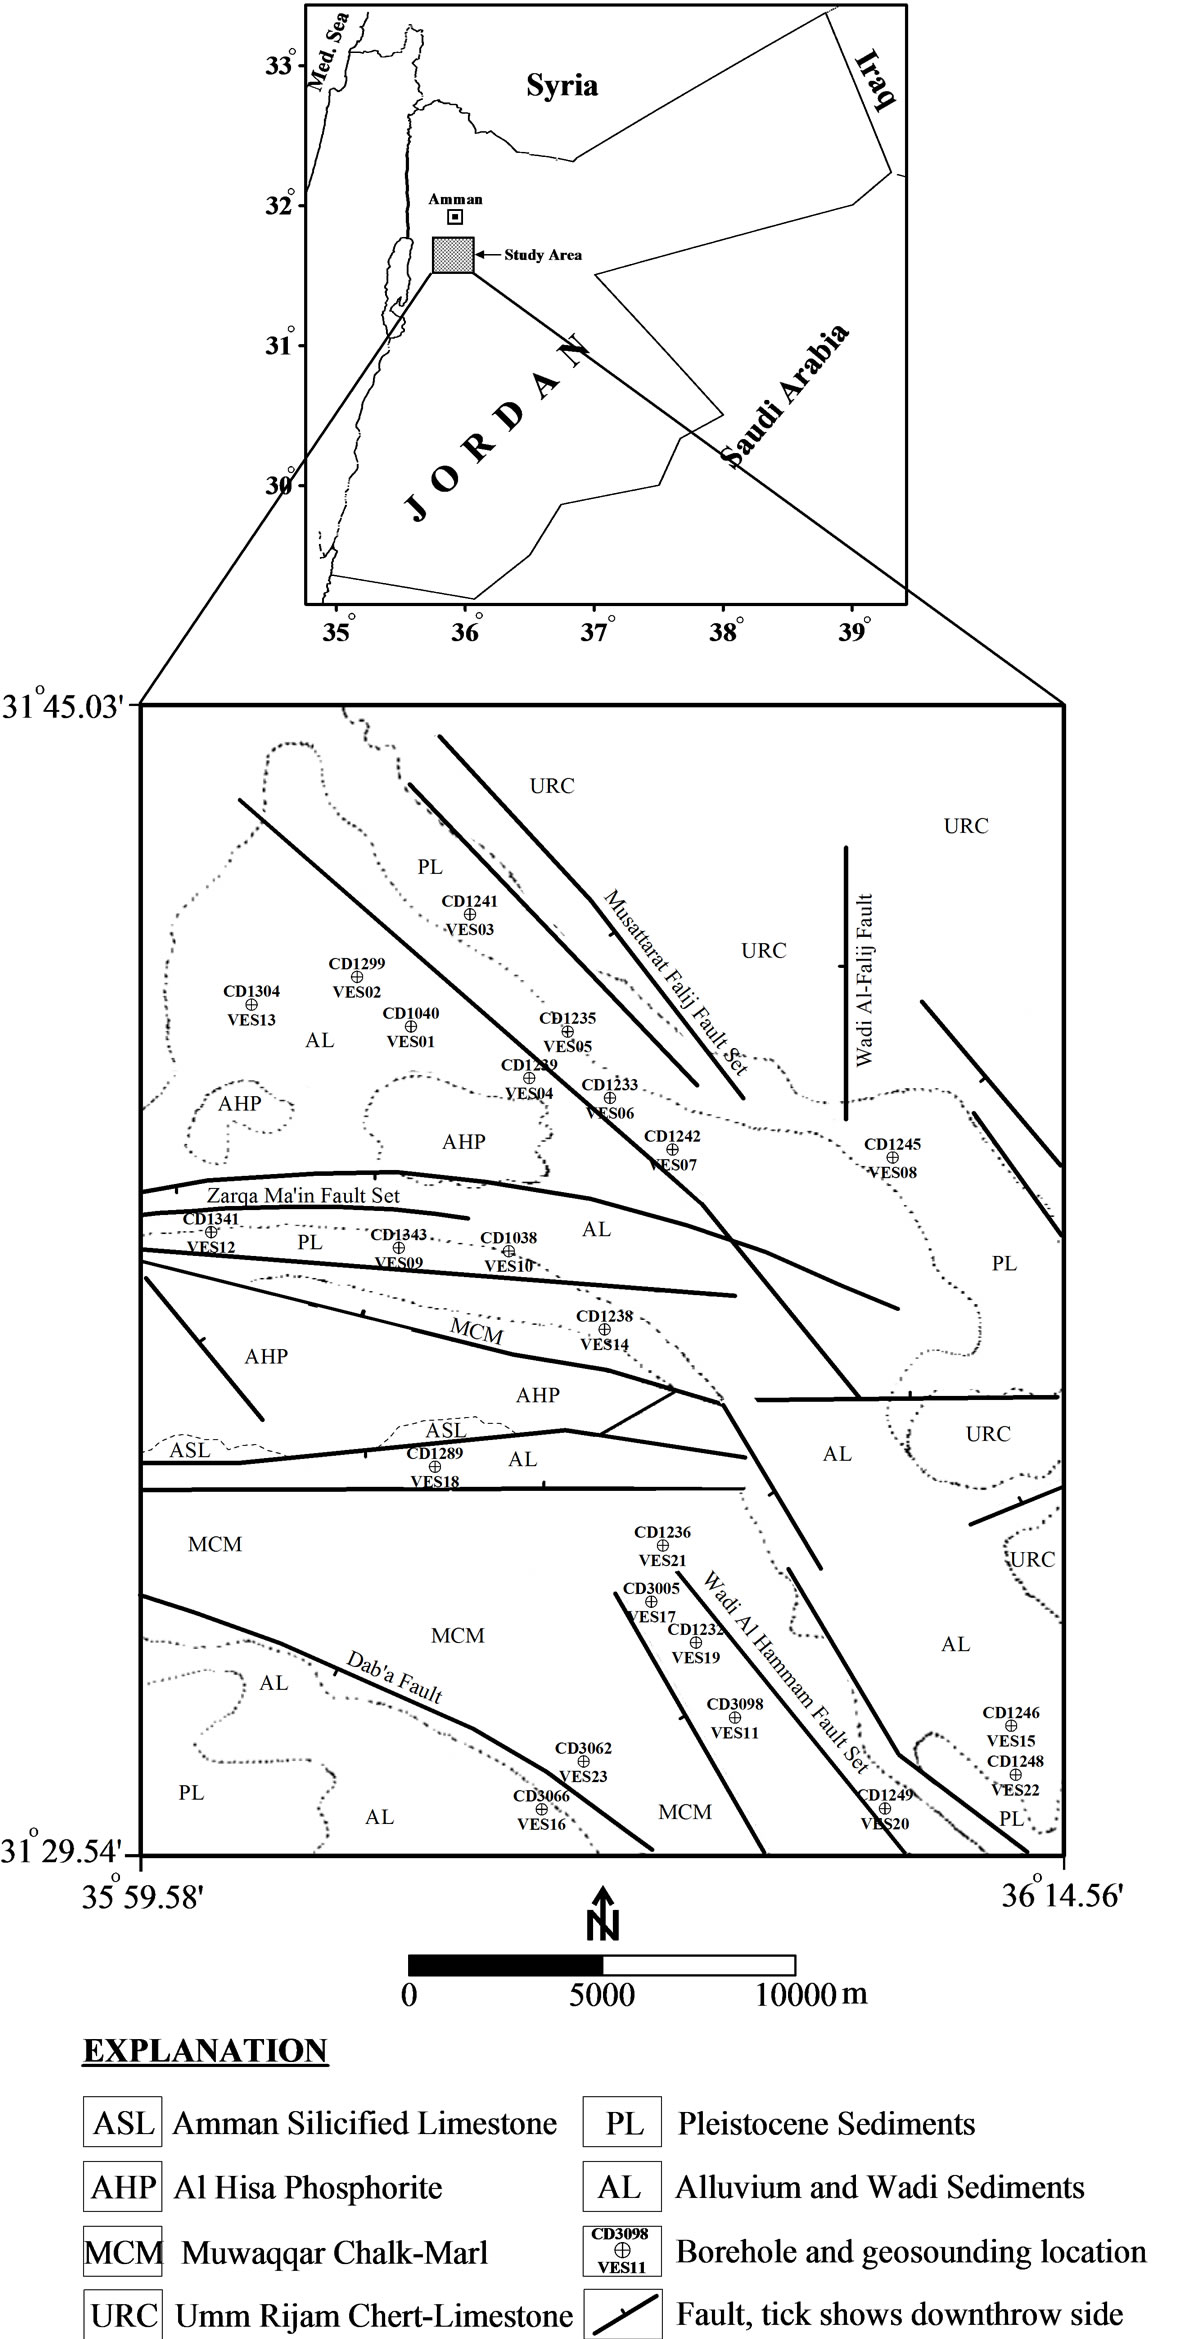
Figure 1. Geology map of the area (after Jaser [18]) and positions of geoelectrical soundings and wells.
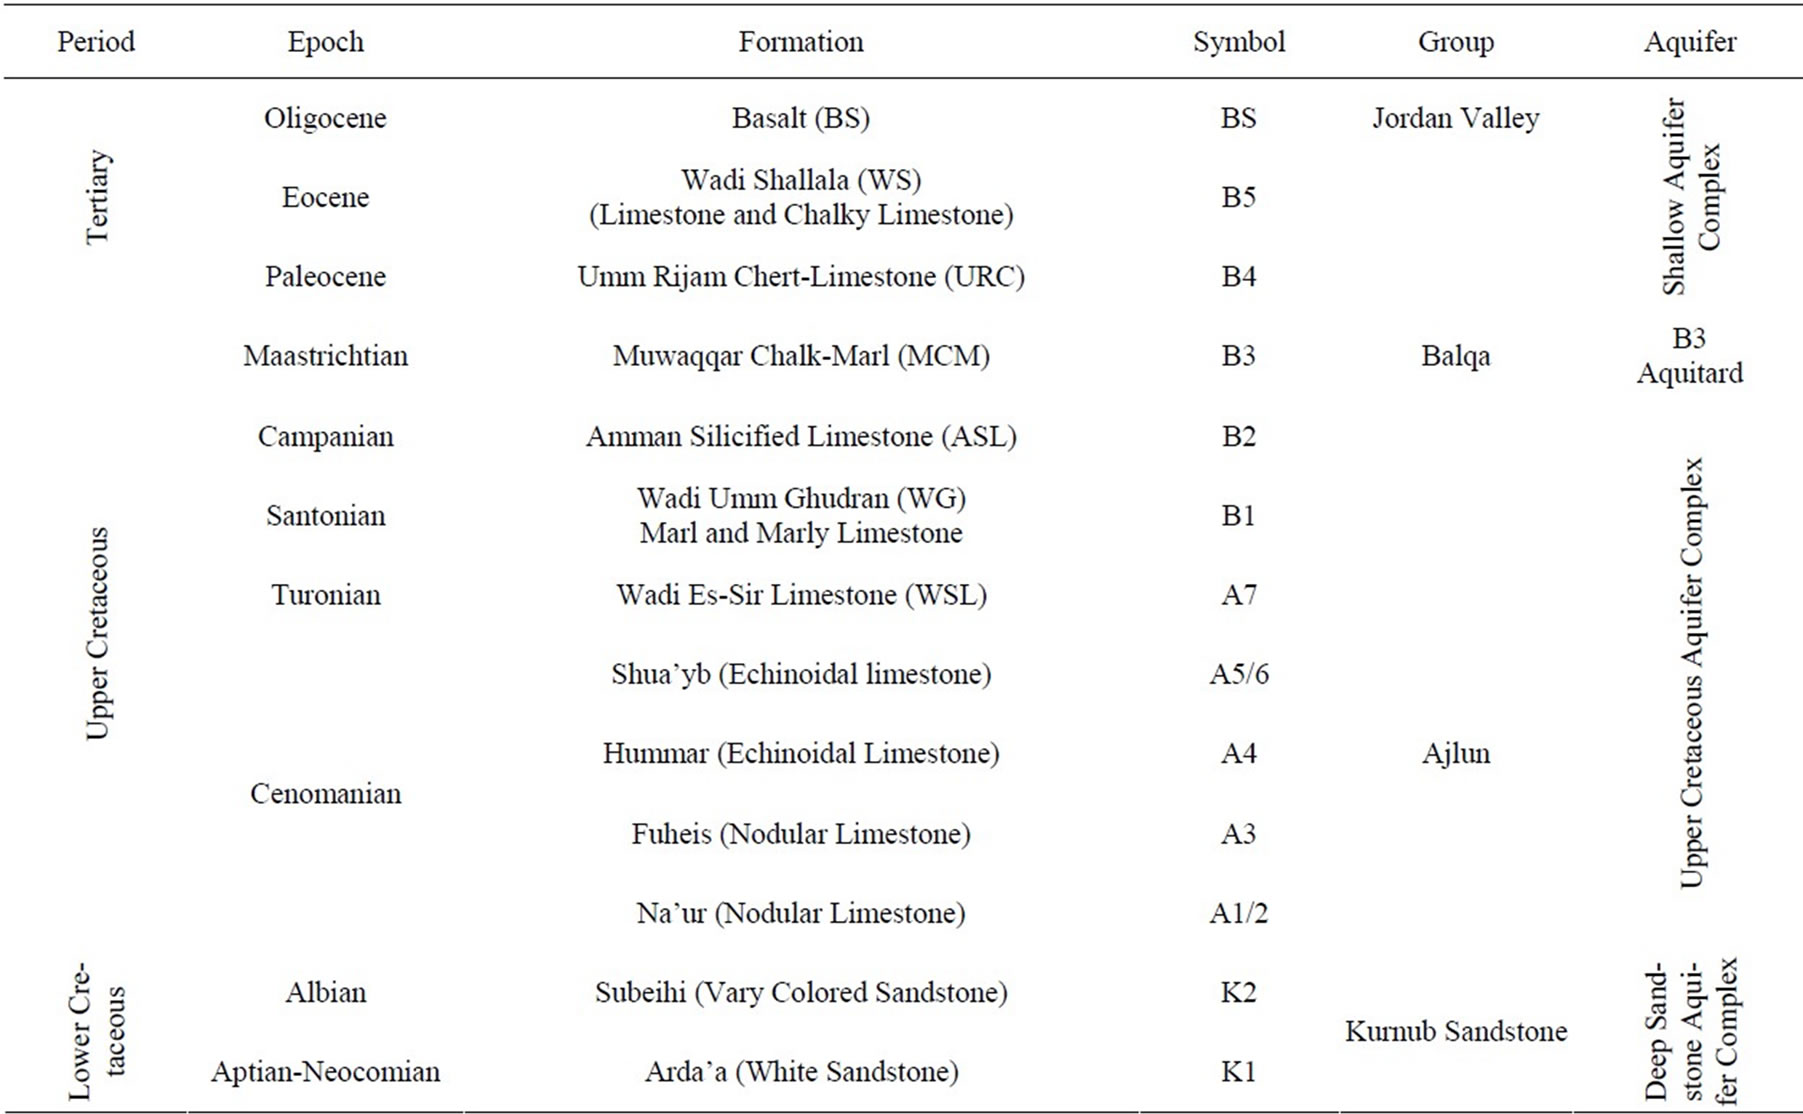
Table 1. Stratigraphic column for the geology of northern Jordan (after Rimawi et al. [19]).
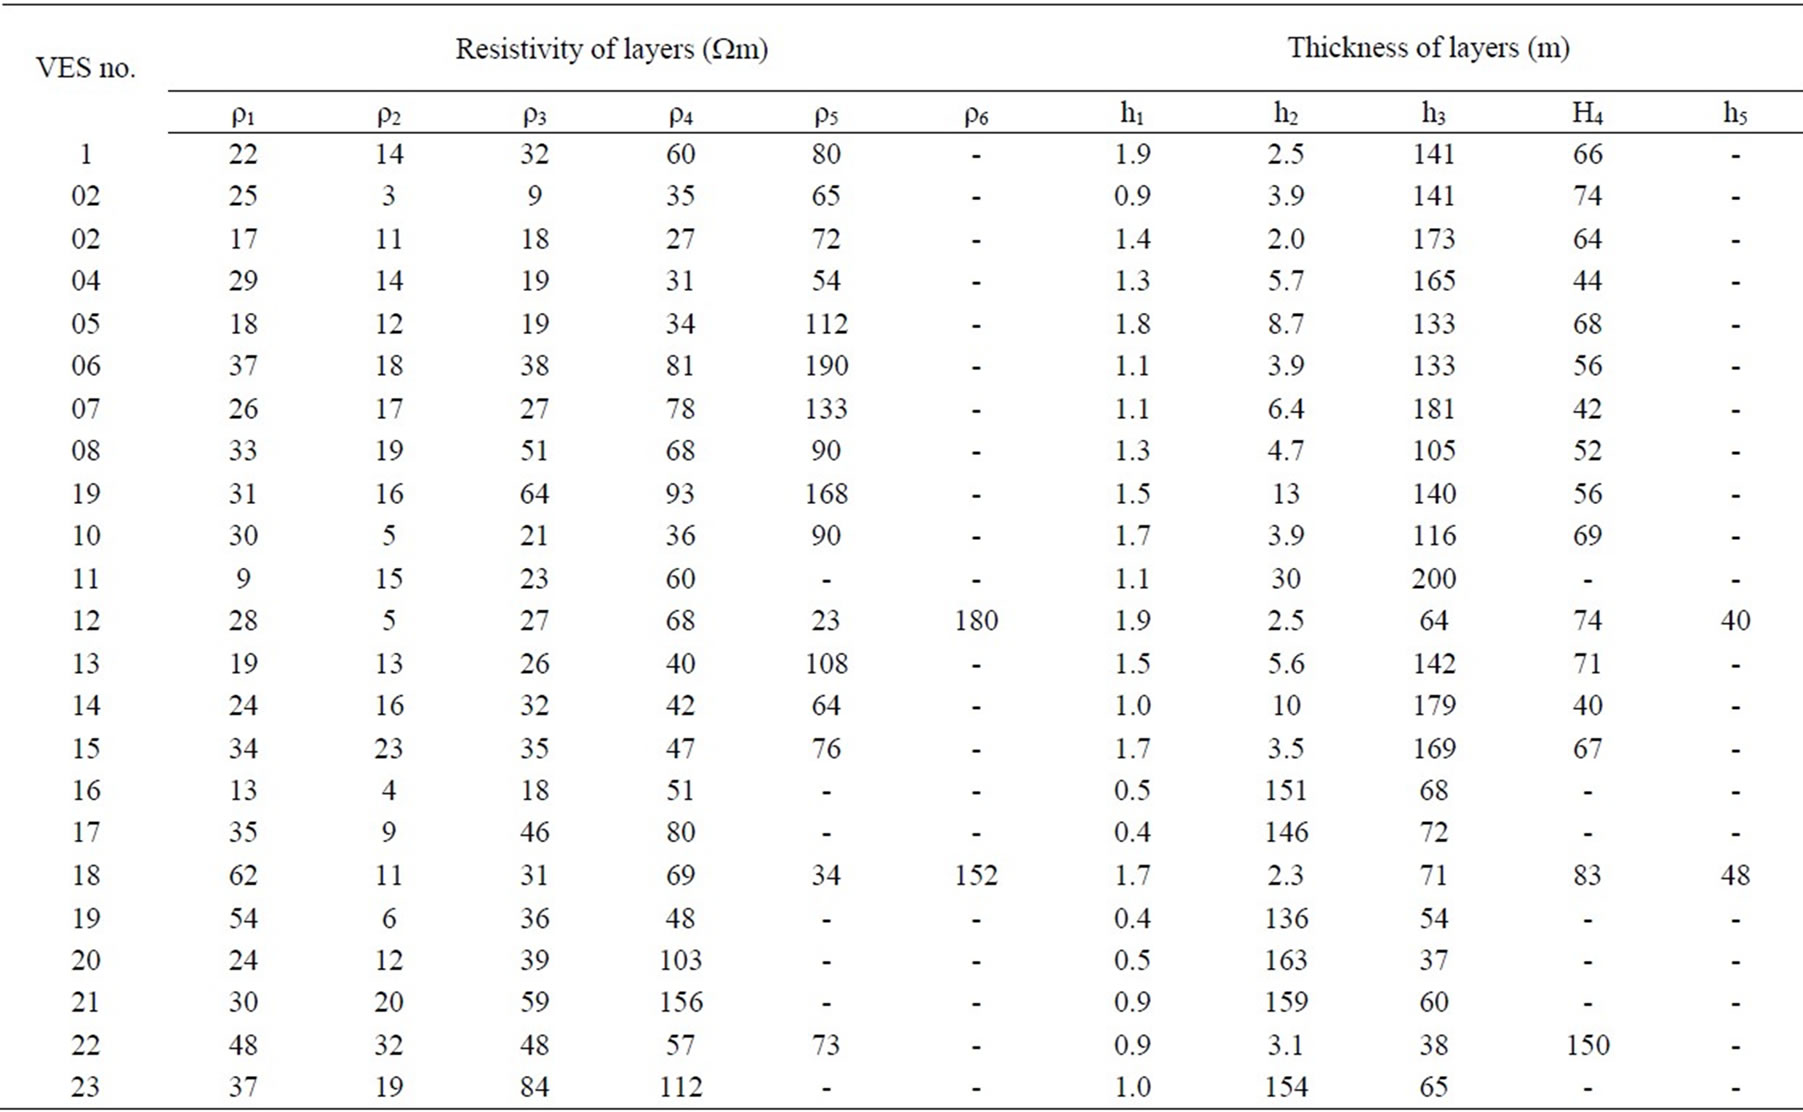
Table 2. Summary of results from computer modeling for all sounding stations.
limestone, chalk and chalky limestone. The overlying Al-Hisa Phosphorite (AHP) Formation, which belongs to the Balqa Group (Maestrichtian-Campanian in age) consists of limestone and phosphate with chalk and chalky marl units. These are overlain by sediments consisting of marl, chalk and chalky marl of the Muwaqqar Chalk-Marl (MCM) Formation belonging to the Balqa Group of Maestrichtian to Paleocene age. The overlying chalky limestone and chert of the Umm Rijam Chert-Limestone (URC) Formation (Eocene in age) belongs to Balqa Group. Surficial deposits are: marl, clay, sand and gravels of Holocene to Recent age.
2.2. Hydrogeology
Generally, the groundwater aquifers of Jordan are divided into three hydraulic complexes: Deep Sandstone Aquifer Complex, Upper Cretaceous Aquifer Complex, and Shallow Aquifer Complex (Table 1). Although this study is concentrated on the Upper Cretaceous Aquifers (namely B2/A7 aquifer), it is important to indicate the significant role of the Deep Sandstone Aquifer Complex where they occur in the adjacent highlands. They may contribute to the recharge of the Upper Cretaceous aquifers as upward leakage [19].
Based on the lithology log data of 23 wells from the study area, we divide the area into two distinct hydraulic units: Hydraulic unit-1 towards the northern and central parts comprised of almost sorted material (mainly limestone) with low uniformity coefficient and another unit comprising of unsorted materials (limestone and chert) with relatively high uniformity coefficient occurring towards the southern parts (Hydraulic unit-2) (Figure 1).
3. Field Studies
Surface resistivity methods have been used in groundwater research for many years. Earth resistivities are related to important geologic parameters of the subsurface including types of rocks and soils, porosity, and degree of saturation. The detailed description of this method is available in [20]. In general, the resistivity method involves measuring the electrical resistivity of earth materials by introducing an electrical current into the ground and monitoring the potential field developed by the current. The most commonly used electrode configuration for geoelectrical soundings, and the one used in this field survey, is the Schlumberger array. Four electrodes (two current A and B and two potential M and N) are placed along a straight line on the land surface such that the outside (current) electrode distance (AB) is equal to or greater than five times the inside (potential) electrode distance (MN). Vertical sounding, in Schlumberger array, were performed by keeping the electrode array centered over a field station while increasing the spacing between the current electrodes, thus increasing the depth of investigation.
The potential difference (rV) and the electrical current (I) are measured for each electrode spacing and the apparent resistivity (ra) is calculated by the equation:
 (1)
(1)
where
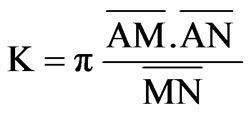 (2)
(2)
is the geometrical factor that depends on the electrode arrangement for the Schlumberger array.
An integrated approach of hydrogeological and geoelectrical soundings surveys has been used to study the relationship between the geoelectric and hydraulic parameters in the central part of Jordan. Data from 23 deep wells are available, on which pumping tests have been conducted. The pumping test data were analyzed and the aquifer hydraulic parameters (hydraulic conductivity, transmissivity and water resistivity) have been evaluated by Water Authority of Jordan in 2006. The geophysical field work in this study included recording of 23 vertical electrical soundings (VES) carried out in the fall of 2006. The VES were recorded up to a maximum electrode separation of 2000 m. The VES soundings were conducted with the help of Iris Syscal R2 resistivity instrument in the close vicinity of deep wells as shown in Figure 1.
A preliminary interpretation of the sounding curves using partial curve matching [21] provides the initial estimates of the resistivities and thickness (layer parameters) of the various geoelectric layers. The layer parameters derived from the graphical curve matching were then used to interpret the sounding data in terms of the final layer parameters through a 1-D inversion technique (RESIX-IP, Interpex Limited, Golden, Co., USA). Inversion analyses of the sounding curves have been made with an average fitting error of about 5%. Quantitative interpretation of geoelectrical sounding curves is complicated due to the well known principle of equivalence [22]. Data from the two boreholes (CD1245 and CD1232, Figure 1) was used to minimize the choice of equivalent models, by fixing thicknesses and depths to certain levels and allowing the adjustment of resistivity. Correlation between VES interpretation at stations 8 and 19 and borehole lithology determines the electrical characteristics of the rock units with depth (Figure 2). Table 2 presents the results of interpretation of the VES stations.
Figure 3 is a typical sounding data plot and best-fit four-layer model for one selected sounding data. On the left, Figure 2 shows the Schlumberger apparent resistivity curve with data (points) superimposed on the best match 1-D inversion (solid line). On the right the figures shows the interpreted results in terms of resistivity and
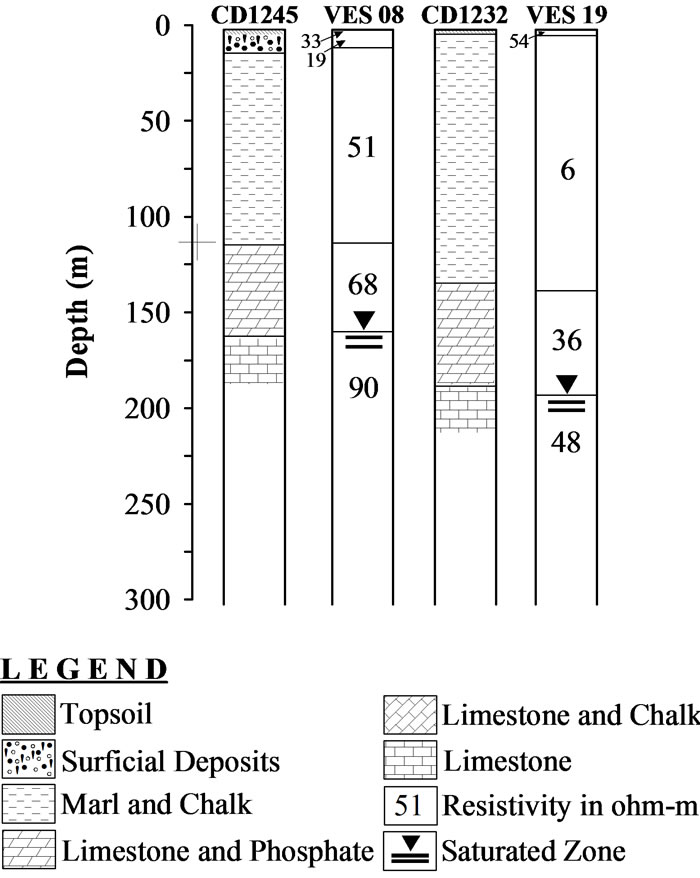
Figure 2. Comparison of interpreted VES field curves and nearby test-hole logs for two selected sites.
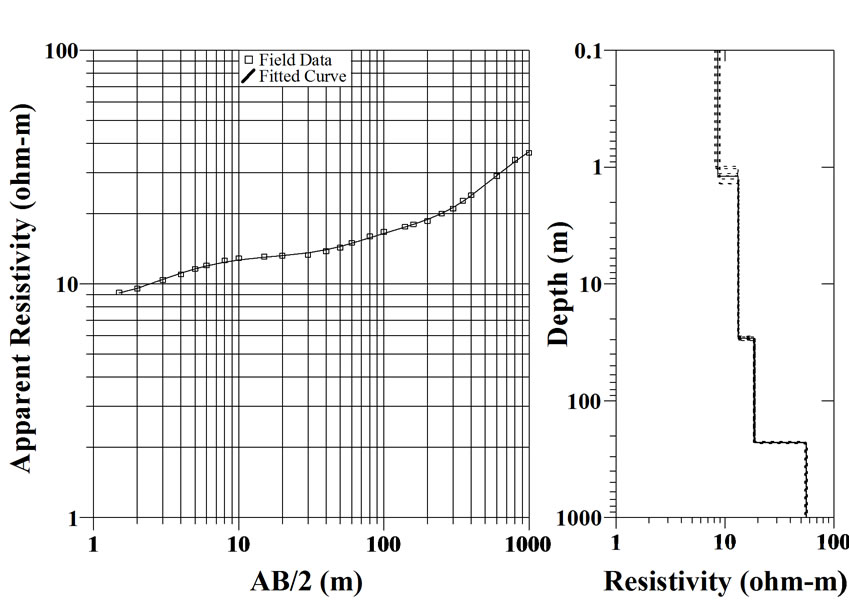
Figure 3. Typical electrical resistivity sounding data and best-fit four layer model interpretation for VES11.
depth together with the allowable range of equivalence (dashed lines). The result of the 1-D inversion of Figure 2 (right) shows a thin topsoil layer about 1 m thick, below which is a 30 m band of chalk and marl representing the upper of the MCM formation with a resistivity value of about 15 Wm. The third unit has higher resistivity values (23 Wm) and considerably thick (about 200 m). This layer represents the lower of the MCM formation. The fourth unit has resistivity values of 60 Wm, representing the saturated zone.
4. Hydraulic Parameters Versus Geoelectric
Figure 4 shows an analogy between the electrical current flow and groundwater flow in layered media. If the flow of electric current is parallel to the geological layering and hydraulic flow [20], the average horizontal hydraulic conductivity (Kh) is given as (3):
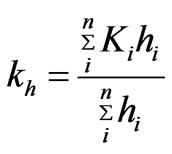 (3)
(3)
And average longitudinal resistivity (ρl) is given as (4):
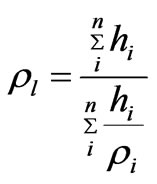 (4)
(4)
where ρi and hi are resistivity and thicknesses of ith layer, respectively. The transverse resistivity (ρt) of the aquifer is determined from the layer parameters as (5):
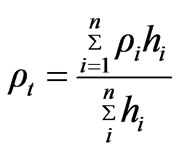 (5)
(5)
The use of electrical parameters obtained by multiplying the transverse resistance with the modification factor (ratio of average aquifer water resistivity and resistivity of water at a particular site) has been suggested by [14,15]. This approach has been used for the 23 sites using the value of aquifer water resistivity (measured from collected groundwater samples), an average aquifer water resistivity (6.28 ohm-m) and modified transverse resistance (R') have been calculated. Figure 5 shows a scatter plot of transmissivity (T) and modified transverse resistance (R'). The following linear relationships are obtained (6):
 (6)
(6)
However, when the values are sorted on the basis of hydraulic units 1 and 2, the plot (Figure 5) shows two lines with lesser scatter. The linear relationship for hydraulic unit-1 takes the form of (7):
 (7)
(7)
And for hydraulic unit-2, the relationship is (8):
 (8)
(8)
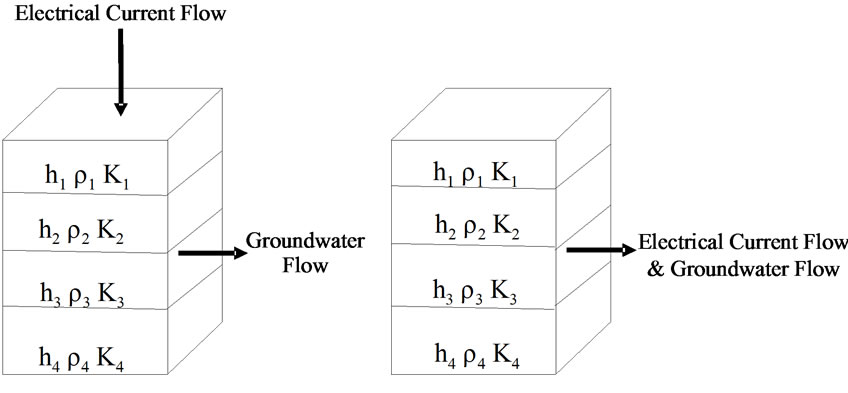
Figure 4. Layered model showing transverse and longitudinal current flow.
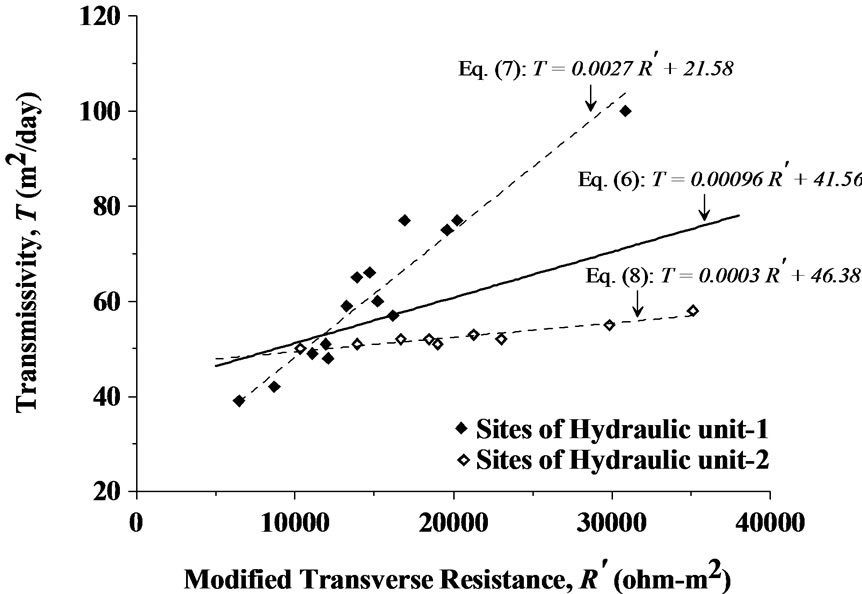
Figure 5. Transmissivity plotted with modified transverse resistance for different hydraulic units. Solid line represents the linear relationship when both hydraulic units are combined to one unit. Dashed lines represent the linear relationships for hydraulic unit-1 and unit-2.
Equations (6)-(8) are used to compute transmissivity and the same are compared with the observed data in Table 3. It is observed that the values computed from Equations (7) and (8) are generally closer to measured values in comparison to those computed from Equation (6).
The influence of aquifer anisotropy caused by layering on relations between aquifer hydraulic and electrical properties has been examined. The relationship between formation factor (F) and hydraulic conductivity (K) has been proposed [4] as (9):
 (9)
(9)
The plot of empirical relationship (Equation 9) is shown in Figure 6 for the actual field data. The values of the coefficient (A) and the exponent (m) in Equation (9) are found to be 0.04 and 0.75, respectively. Substituting the values of A and m, Equation (9) can be written as (10):
 (10)
(10)
The values of field data are sorted on the basis of hydraulic units 1 and 2, the plot (Figure 6) shows two lines with lesser scatter. The empirical relationship for hydraulic unit-1 takes the form of (11):
 (11)
(11)
And for hydraulic unit-2, the relationship is (12):
 (12)
(12)
Equations (10)-(12) are used to compute hydraulic conductivity and the calculated values were compared with the observed data in Table 4. It is observed that the values computed from Equations (11) and (12) are generally closer to measured values in comparison to those computed from Equation (10).
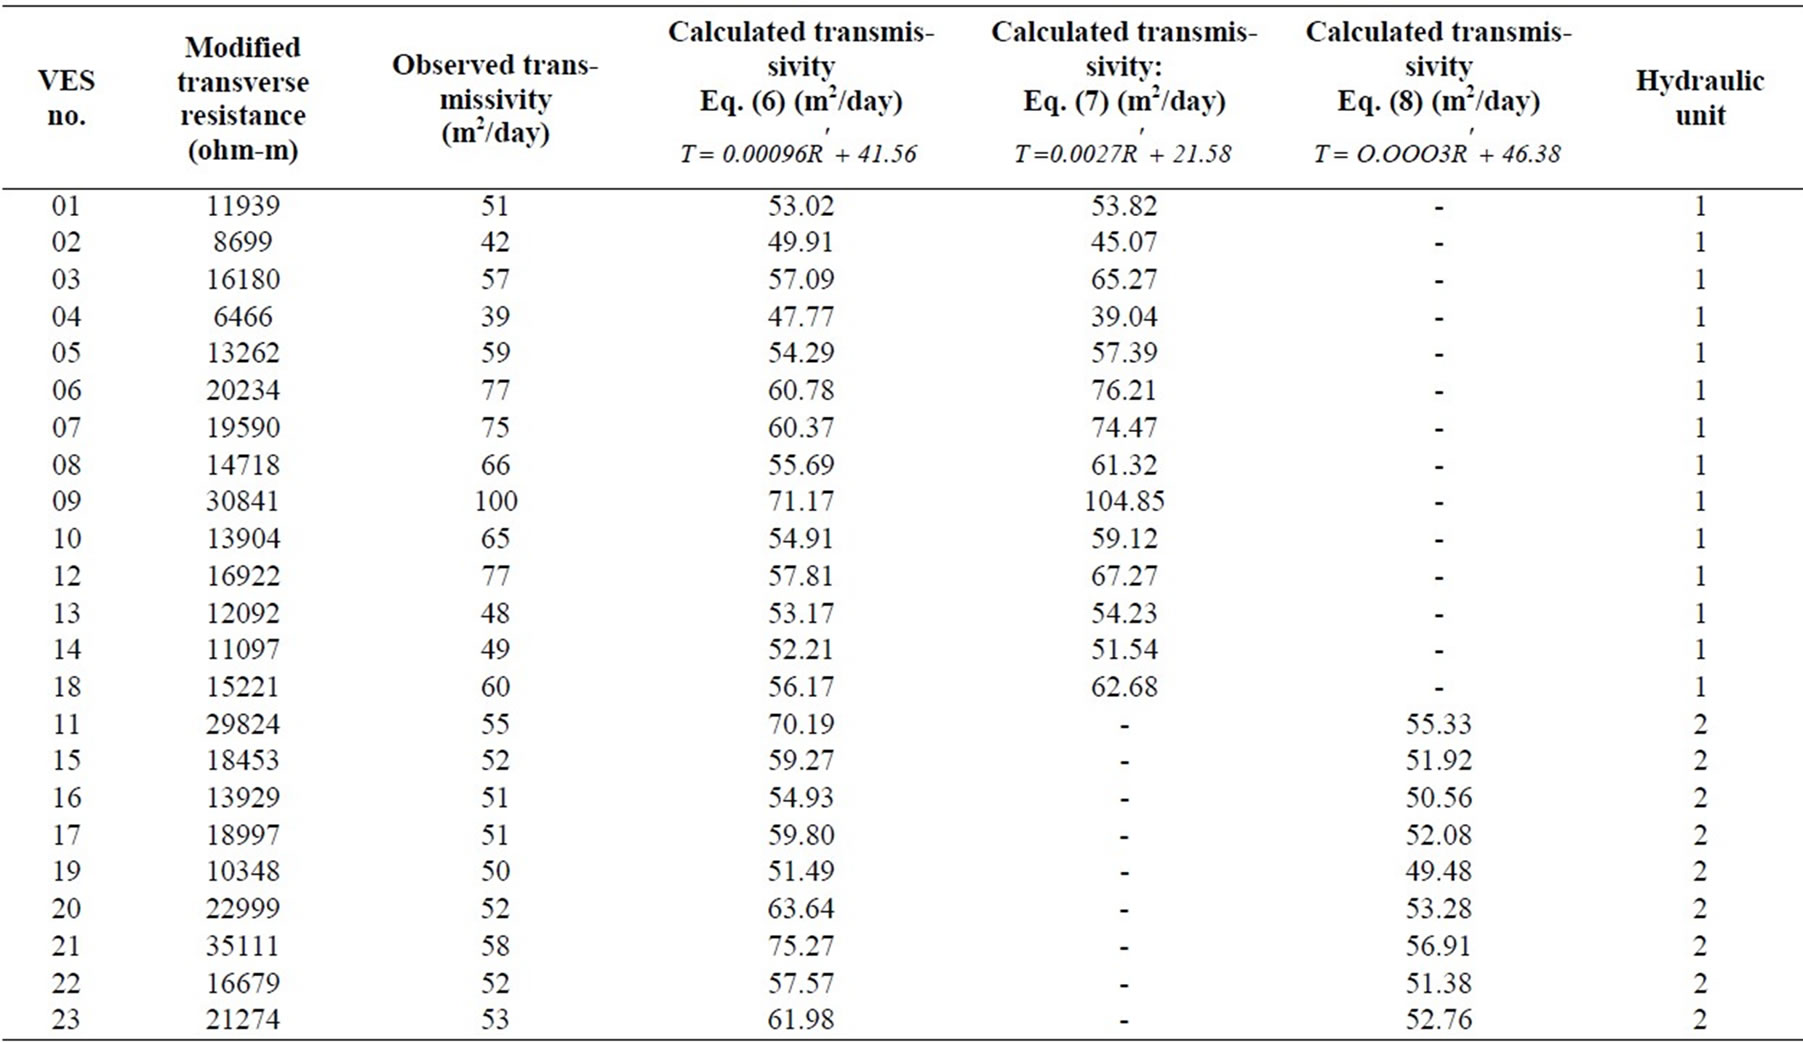
Table 3. Observed and computed transmissivity values using modified transverse resistance in different equations for all twenty three sites.
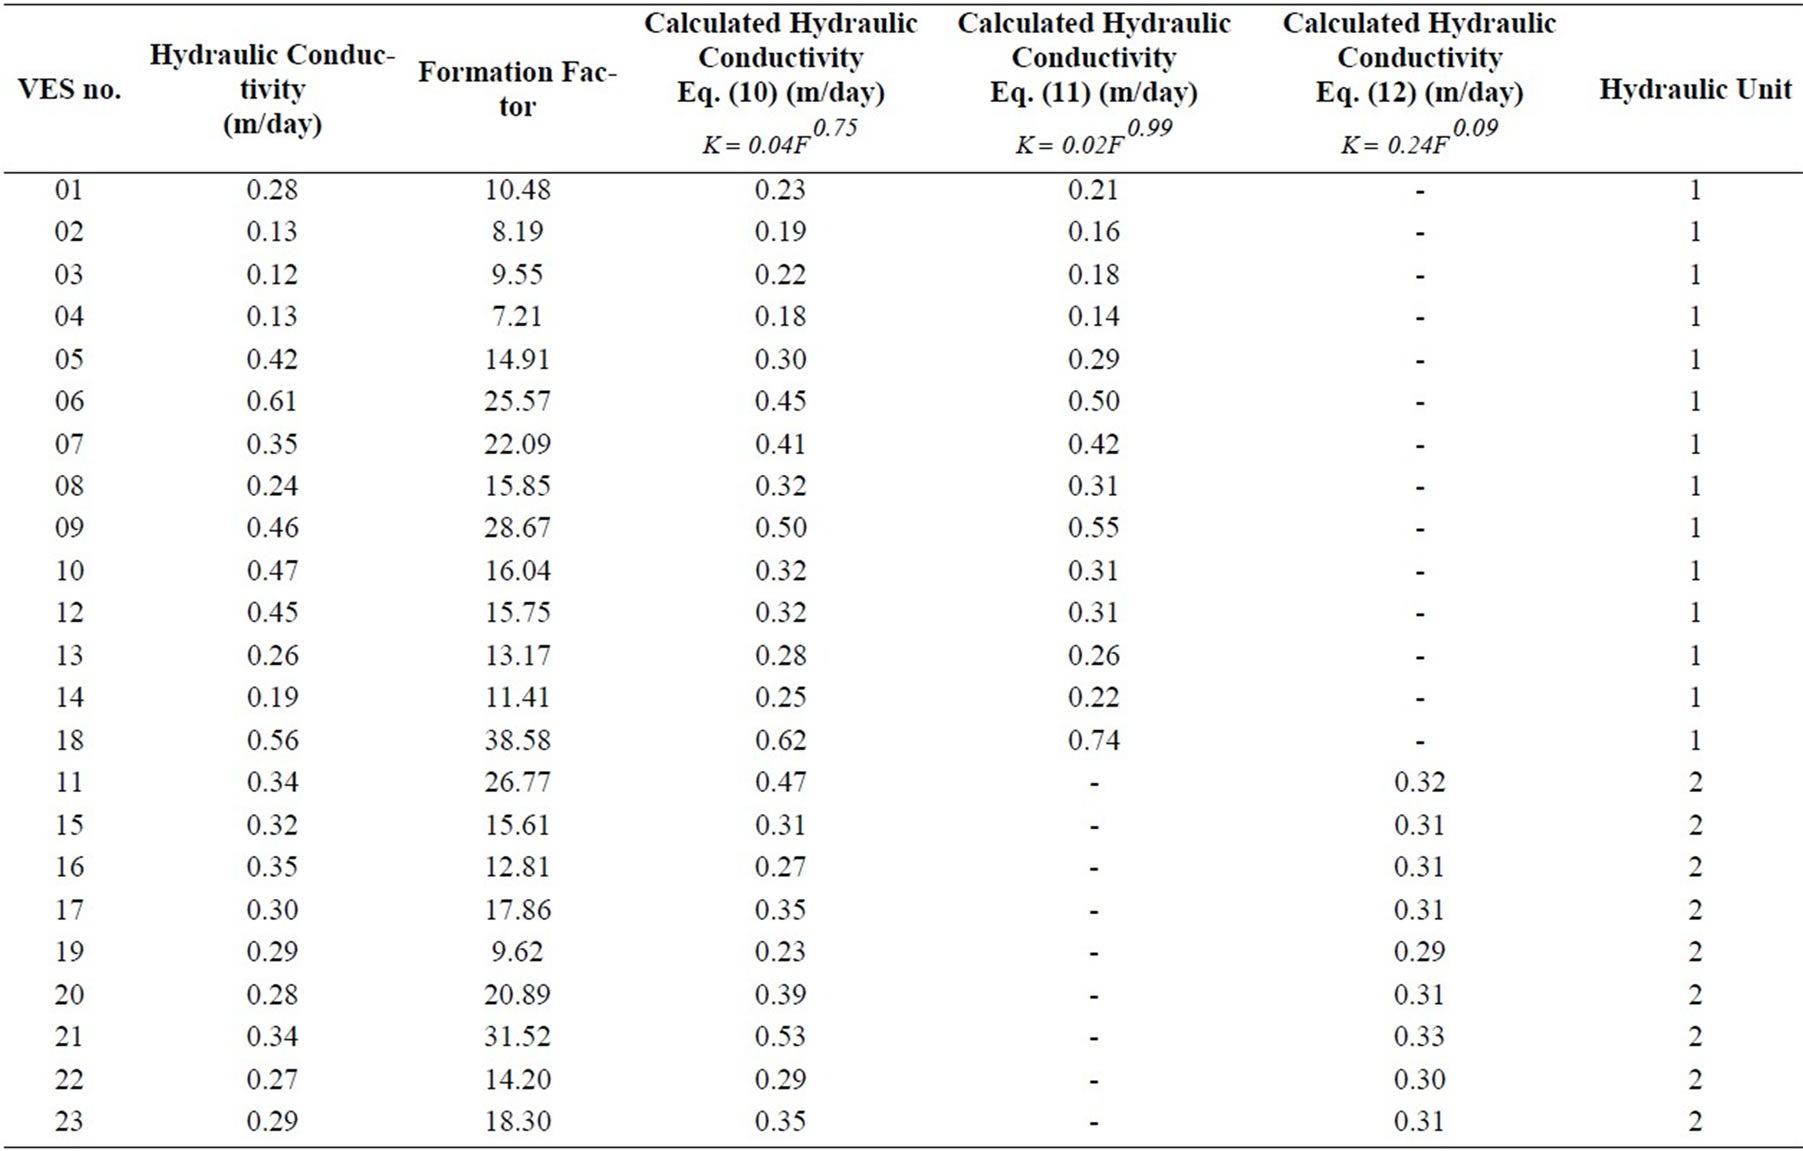
Table 4. Hydraulic conductivity from pumping test data, formation factor derived from interpreted resistivity models, along with computed hydraulic conductivity values in different equations for all twenty three sites.
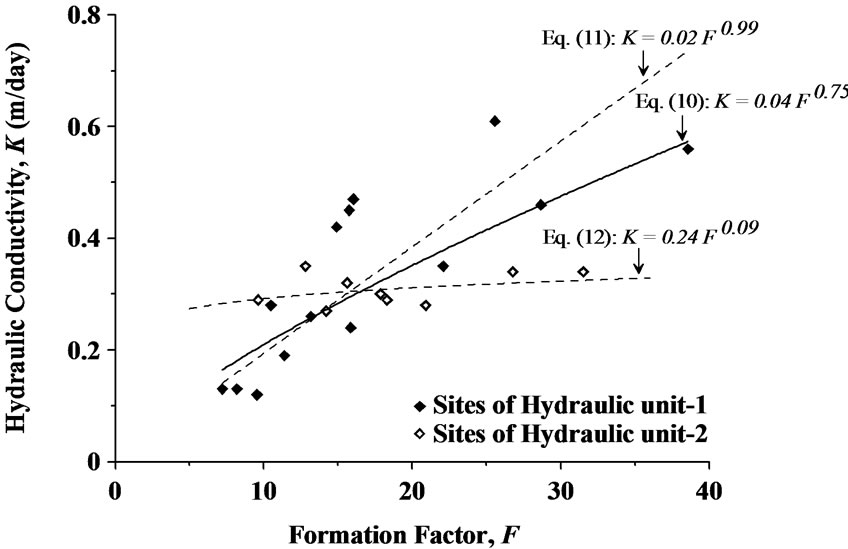
Figure 6. Empirical relation between hydraulic conductivity and formation factor. Solid line represents the relationship when both hydraulic units are combined to one unit. Dashed lines represent the relationships for hydraulic unit-1 and unit-2.
5. Conclusions
Geoelectrical surveys, using the Schlumberger array configuration, were carried out in the vicinity of 23 pumping test sites, central Jordan, with an aim to relate geoelectric properties to hydraulic parameters. The present study suggests that aquifer transmissivity and hydraulic conductivity can be estimated more accurately if the values are sorted by hydraulic units. It can be inferred from the study that the geoelectrical sounding method can be successively used not only for exploration of groundwater but also for estimating the hydraulic parameters of the groundwater aquifer.
6. Acknowledgments
The author wishes to thank Prof. M. Mukhopadhyay and Dr. F. Zaidi from the Department of Geology and Geophysics and three anonymous reviewers for comments that greatly improved this manuscript. Facilities provided by the Department of Geology and Geophysics, King Saud University, Saudi Arabia are acknowledged.
REFERENCES
- P. Jones and T. Buford, “Electric logging applied to groundwater exploration,” Geophysics, Vol. 16, pp. 115–139, 1951.
- R. Frohlich, “Combined geoelectrical and drill-hole investigations for detecting freshwater aquifers in northwestern Missouri,” Geophysics, Vol. 39, pp. 340–352, 19- 74.
- W. Kelly, “Geoelectric sounding for estimating aquifer hydraulic conductivity,” Ground Water, Vol. 15, pp. 420–424, 1977.
- O. Mazac and I. Landa, “On the determination of hydraulic conductivity and transmissivity of granular aquifer by vertical electrical sounding,” Journal of Geological Science, Vol. 16, pp. 123–139, 1979.
- W. Kosinski and W. Kelly, “Geoelectric soundings for predicting aquifer properties,” Ground Water, Vol. 19, pp. 163–171, 1981.
- U. Schimschal, “The relationship of geophysical measurements to hydraulic conductivity at the Brantley dam site, New Mexico,” Geoexploration, Vol. 19, pp. 115–126, 1981.
- W. Kelly and P. Reiter, “Influence of anisotropy on relations between electrical and hydraulic properties of aquifers,” Hydrology Journal, Vol. 74, pp. 311–321, 1984.
- G. Ponzini, A. Ostroman, and M. Mollinari, “Empirical relation between electrical transverse resistance and hydraulic transmissivity,” Geoexploration, Vol. 22, pp. 1– 15, 1984.
- R. Frohlich and W. Kelly, “The relation between hydraulic transmissivity and transverse resistance in a complicated aquifer of glacial outwash deposits,” Hydrology Journal, Vol. 79, pp. 215–229, 1985.
- P. Mbonu, J. Ebeniro, C. Ofoegbu, and A. Ekine, “Geoelectric sounding for the determination of aquifer characteristics in parts of the Umuahia area of Nigeria,” Geophysics, Vol. 56, pp. 284–291, 1991.
- G. Yadav, “Relating hydraulic and geoelectric parameters of the Jayant aquifer, India,” Hydrology Journal, Vol. 167, pp. 23–38, 1995.
- G. Yadav and H. Abolfazli, “Geoelectrical soundings and their relationship to hydraulic parameters in semiarid regions of Jalore, northwestern India,” Journal of Applied Geophysics, Vol. 39, pp. 35–51, 1998.
- O. de Lima and Sri Niwas, “Estimation of hydraulic parameters of shaly sandstone aquifers from geoelectrical measurements,” Hydrology Journal, Vol. 235, pp. 12–26, 2000.
- Sri Niwas and D. Singhal, “Estimation of aquifer transmissivity from Dar-Zarrouk parameters in porous media,” Hydrology Journal, Vol. 50, pp. 393–399, 1981.
- Sri Niwas and D. Singhal, “Aquifer transmissivity of porous media from resistivity data,” Hydrology Journal, Vol. 82, pp. 143–153, 1985.
- P. Heigold, R. Gilkeson, K. Cartwright, and P. Reed, “Aquifer transmissivity from surficial electrical methods,” Ground Water, Vol. 17, pp. 338–345, 1979.
- D. Urish, “Electrical resistivity-hydraulic conductivity relationships in glacial aquifers,” Water Resources Research, Vol. 17, pp. 1401–1407, 1981.
- D. Jaser, “The geology of Khan Ez Zabib. Map Sheet No. 3253 III.” Geological Mapping Division, Natural Resources Authority, Bulletin 3, 1986.
- O. Rimawi, A. El-Naqa, and E. Salameh, “Hydrochemical characteristics of groundwater resources in northeastern part of the Valley/Jordan,” Dirasat, Vol. 19, pp. 87–117, 19–92.
- M. Zhdanov and G. Keller, “The geoelectrical methods in geophysical exploration, methods in geochemistry and geophysics,” Elsevier, pp. 884, 1994.
- E. Orellana and H. Mooney, “Master tables and curves for vertical electrical sounding over layered structures,” Interciencia, Madrid, pp. 34, 1966.
- R. Van Overmeeren, “Aquifer boundaries explored by geoelectrical measurements in the coastal plain of Yemen: A case study of equivalence,” Geophysics, Vol. 54, pp. 38–48, 1989.

