Journal of Software Engineering and Applications
Vol.7 No.10(2014), Article ID:49626,16 pages
DOI:10.4236/jsea.2014.710075
Process Evaluation Based on Meeting Quality of Requirement Analysis Phase in Software Development Projects
Masaki Obana1, Noriko Hanakawa2
1Faculty of Information Science and Technology, Osaka Institute of Technology, Osaka, Japan
2Faculty of Management Information, Hannan University, Osaka, Japan
Email: obana@is.oit.ac.jp, hanakawa@hannan-u.ac.jp
Copyright © 2014 by authors and Scientific Research Publishing Inc.
This work is licensed under the Creative Commons Attribution International License (CC BY).
http://creativecommons.org/licenses/by/4.0/


Received 3 July 2014; revised 30 July 2014; accepted 25 August 2014
ABSTRACT
We propose a metric for meeting quality in software development. Meeting is important in order to share knowledge and experience among developers and stakeholders. Most frequent and important meetings are in software requirement analysis phase. System engineers and stakeholders discuss software requirements. However, meeting quality is various. Sometimes, stakeholders feel vague decision and suspicious discussion. It is difficult to measure quantitatively the vagueness and suspicion because the vagueness and suspicion are based on human feeling. Therefore, to measure the vagueness and suspicion, our proposed metric is useful. A feature of the metric is to measure only when and who speaks in meetings, not depending on what was said. Hence, the metric does not require software domain knowledge and development experience. The metric consists of system engineers’ speaking time and the number of stakeholders’ speaking within one question by a system engineer. The metric is applied to a practical project. As a result, we automatically extract vague discussion and suspicious discussion in quantitative analysis using the metric. The number of extracted doubtful topic is 37 in all 69 topics. After that, we confirmed that the metric can predict doubtful topics that cause software faults in precision 59.5%, recall 84.5%. In addition, we found that a repeatable topic may cause software faults in requirement meetings.
Keywords:Meeting, Software Fault, Software Requirement, System Engineer, Discussion Logs, Meeting Quality

1. Introduction
Requirement analysis of software is important on large-scale software development [1] . In industrial practice, software requirements are often defined at meetings with system engineers and stakeholders [2] . We call such meeting “specification meeting”, “requirement analysis meeting”, or “discussion of software requirement”. In the meetings, system engineers extract demands and concepts of target software from stakeholders. And system engineers also discuss a new business work flows, the details of system specifications, and GUI with stakeholders. System engineers need high communication abilities, proposal abilities of software specifications, analysis abilities of problems, and proceeding abilities of meetings [3] . On the other hand, high decision making skills, competence to judge correctness of software specifications, and regulating abilities of various opinions in their organizations are required from stakeholders. Although the requirement analysis is one of most difficult activities in software development, results of requirement analysis on meetings greatly influence software quality [4] [5] .
Many methods have been proposed for improving activities of a requirement analysis phase. Sawye et al. claimed that deep understanding of software requirement is performed on an early phase using descriptions written in a natural language from stakeholders’ interviews [6] . Domain models are constructed in order to eliminate inconsistency of descriptions in documents of system specifications [7] , a method of refining stakeholders’ requirement at meetings is proposed [8] . These studies focus on important problems of requirements analysis such as vagueness of requirements written in a natural language, inconsistency of requirements, and not-refining requirements. However, these studies depend on a target system’s domains and accumulated experiential knowledge. If a system belongs to a new domain and new development technologies, the above methods are not useful because experiential data and knowledge are not yet accumulated.
Therefore, we propose a new metric for meeting quality on a software requirement analysis phase. Our original basic idea is “high quality meetings lead high quality software requirements”. In industrial practice, system engineers discuss software requirements with stakeholders at meetings in analysis phase. The meeting quality greatly influences quality of software requirements. A feature of the metric is to measure only when and who speaks at meetings. Contexts of speaking at meetings are not a target of the metric. Hence, the metric can adapt a new project using a new system domain and new development technologies without accumulated experiential data and knowledge.
In this paper, we show measurement of meeting quality in two projects. In addition, we call all activities such as “specification analysis”, and “requirement definition” as “requirement analysis”. And a meeting of requirement analysis means a meeting where system engineers and stakeholders define software requirements and specifications with deep discussions. Section 2 shows related works. In Section 3, the meeting metric is proposed with a procedure of making the metric in an industrial project. Section 4 shows evaluation of the metric in another industrial project. In Section 5, we discuss efficiency of the metric. Section 6 shows summary, future works.
2. Related Work
There are many empirical researches for communication on software development projects. Dutoit et al. have proposed communication metrics based on experiments by university students, and established an empirical framework including a general structural equation model [9] . The relationship between the number of communication and the context of a project such as product size, development methodology, and number of developers, has been clarified. Based on empirical data, they state that the number of terms in communication and the number of communication are useful metrics for clarifying the development process. D’Astous et al. have also studied the exchange patterns in communication by an empirical approach [10] . Using the data obtained by protocol analysis in real meetings, four significant types of communication have been identified as the characteristics of peer review meetings. These researches focus on relationships between communication and a significant context such as development time, product quality, and process. However, these approaches depend on software domain and development technologies. Especially, terms in communication completely depend on software domain, and experience knowledge. Our proposed metric does not depend on software domain and experience knowledge. Our proposed metric can be adaptable to all meetings even if the meetings are not software development activities.
In addition, Seaman et al. clarified relationships between efficiency of inspection meetings and organizational arrangements [11] . Organizational relationships among developers influence meeting time and meeting processes. Damian et al. studied synchronous or asynchronous negotiations of software requirements in distributed development [12] . They claimed that efficient negotiations are to discuss details of requirements at regular meetings after asynchronous discussion of vague requirements by e-mails. The approach of these researches is based on records of practical meeting logs. The approach is similar to our research. Although these researches focus on only meeting times and efficiency of meetings, meeting qualities and predictions of software faults are not mentioned. Our research also mentions predictions of software faults caused by low quality of meetings.
On the other hand, software requirements and specifications are discussed in natural languages such as Japanese. Therefore, Sawye et al. proposed a new analysis method for acquiring deep understandings from shallow knowledge using corpus linguistics [6] . After frequent words are extracted from stakeholders’ interviews at a software requirement analysis phase, main concepts of the software domain are constructed in order to help analysts’ understandings. Doi et al. proposed USP (User-oriented System Planning method) for capturing software requirement [8] . USP presents problem solution graphs based on corpus. The corpus is constructed by recording stakeholders’ utterance at requirement analysis meetings in a natural language. The solution graphs are useful for function analysis, quality analysis, and concern analysis on both online and offline methods. Purposes of these researches are improvement of software requirement analysis activities using natural language techniques based on records of utterance at meetings. These approaches need high cost. Each utterance at meetings should be correctly recorded. The activities of recording such utterances require expertise knowledge in order to understand correctly speakers’ intentions. Moreover, because oral words at meetings include more vagueness than words written on paper documents, correct capturing of speakers’ intentions at meetings is more difficult than capturing writers’ intentions on paper documents.
In addition, many analysis techniques for meeting states are proposed using video pictures and audio recording. Miyata et al. proposed a technique of auto editing long meeting videos into a digest [13] . They find speakers’ thinking statements and thinking stop scenes using an electroencephalograph. And a new metric for meeting concentrate named “MS-Level” is proposed [14] . Values of the MS-Level present important thinking statements such as “concentration” and “concern” at a meeting. By indexing video pictures using the MS values, researchers are useful for analyzing meeting statements and thinking statements of participants. On the other hand, an auto zooming TV meeting system is proposed. In the system, a speaker’s picture of videos is automatically zoomed up when the speaker start talking [15] . These systems and researches are a kind of analysis methods using video pictures in order to clarifying meeting quality and discussions. However, these researches need large-scale equipment such as electroencephalographs, many video cameras, and TV meeting systems. The preparing and setting the equipment at meeting rooms will be costly. Our proposed metric for meeting quality needs only records: “who spoke, and when it was spoken”. Because our approach does not need large-scale equipment, various meetings on various organizations can easily adapt our metric for measuring meeting quality.
3. A Proposed Metric
3.1. Background
In our university, large-scale educational computer systems including e-learning, lecture management, and student/teacher portal site system are innovated to latest software and hardware on every four years [16] -[18] . Of course, the system development projects perform a whole system development process such as requirement analysis phase, design phase, implement phase, and test phase. Especially, before the project starts, we have competitive bidding of development of the new system toward several system development companies. A company that won the bidding starts developing. Therefore, the company that won the biddings is different in every project. To support latest functions for university education, every educational system is different.
In the repeatable development for every four years, we found relationships between requirement analysis meetings and software faults [19] . The requirement analysis meeting means a discussion in order to clarify software requirements and specifications among system engineers and stakeholders. For example, if discussion is not sufficient, several significant software faults will occur after release. Of course, software requirement documents and software specification documents were reviewed by system engineers and stakeholders. However, almost documents depend on discussion quality in requirement analysis meetings. System engineers write documents down like minutes of meetings. It is difficult for system engineers and stakeholders who were members of the meeting to identify insufficient specification and requirement.
Therefore, we focus on meeting quality in analysis requirement phase of system development projects, we propose a metric for meeting quality. The metric can measure quality of meeting based on discussion log such as video movies and minutes. To propose the metric, we use two large-scale projects in our university; one is at 2008, another is at 2012. Both the two projects’ development period were 6 months, the system development companies of the two projects are same, however, system engineers in the company and stakeholders in our university were different. We call the project at 2008 “Project A”, we call the project at 2012 “Project B”. Basically, we make the metric for meeting quality using meeting logs of Project A, we evaluate the metric using meeting logs of Project B. The summary of the two projects are shown in Table1
From here, we explain examples that actually happened in Project A. The number of meetings is 16, total time of the meetings is about 32 hours in Project A. However, major problems are caused by two significant software faults. The first problem is to send an e-mail of daily schedule in a remainder function even if there is no schedule on the day. That is, a “today has no schedule” e-mail sends to all teachers and all students. One of important concepts of the system is to avoid unnecessary e-mails as much as possible. The “today has no schedule” e-mail is obviously against the concept. The other problem is to lack an important function of sum calculation of attendance data every semester. Because stakeholders and system engineers paid attentions to only visual operability of the attendance function, the sum calculation of the attendance data was inadvertently missed. In reality, causes of the software faults already had occurred at meetings of a requirement analysis phase. The discussions of the meetings already included vagueness and a gap of the specifications between the system engineers and the stakeholders.
We became aware of meeting quality through many practical meetings with system engineers and stakeholders. For example, there is a good case in which a specification is smoothly determined through well-regulated discussions. In contrast, there is a bad case in which discussions become complicated. In the bad case, stakeholders have only vague feelings “what was determined at the meeting?” In such way, each meeting has an each quality. Therefore, we clarify differences between a good meeting and a no-good meeting. After that, we propose a meeting metric that measures quality of discussions.
3.2. Metric Concept
Figure 1 shows a typical discussion pattern when system engineers and stakeholders determine software specifications at a meeting. The discussion pattern is extracted from our experiences of practical meetings, not based on some literature. The pattern is a basis of our proposed metric. At first, a system engineer proposes a specification of a new function. The system engineer explains the specification to stakeholders using explanation documents or demonstrations (P1 of Figure 1). After that, a stakeholder asks a question about the specification to the system engineer (P2 of Figure 1). On another occasion, the system engineer asks a question to stakeholders. Next, the system engineer answers the stakeholder’s question, or the stakeholder answers the system engineer’s question (P3 of Figure 1). After a pair of one ask and one answer repeats, the stakeholders make a decision about the specification (P4 of Figure 1). Finally, the system engineer summarizes the final specification that was discussed in the iterations of the questions and answers. However, if discussions between system engineers and stakeholders become complicated, the iterations of questions and answers will be thrown into disorder. The questions and answers are confused, or, stakeholders’ decision making may be vague, or, system engineers may unilaterally talk without stakeholders’ replies. Moreover, speaking time becomes long, the number of times of speaking increases. In such case, discussion often deviates from the typical discussion pattern of Figure 1.
Therefore, we make the new meeting metric using the number of times of speaking and speaking time. The speaking of discussions is classified into system engineers’ speaking and stakeholders’ speaking. The proposed metric can measure a gap between real discussion and the typical discussion pattern such as Figure 1. The number of times of speaking and speaking time can be easily collected without domain knowledge, and expertise knowledge. Our metric is easily adapted to various projects because domain knowledge and expertise knowledge are not required.
3.3. Making the Metric
The outline procedure of making the metric for meeting quality is shown in Figure 2. At first, three basic metrics are picked up at M1. The basic metrics are simple and easy to measure from meeting logs such as video movies. Next, nine advanced metrics are defined using the three basic metrics at M2. The advanced metrics are determined based on our experiences of meeting discussions. That is, we assume that the nine advanced metrics influence system quality. In M3, values of the advanced metrics are measured in the meetings of the requirement analysis phase of the Project A. Next, we select the meaningful advanced metrics in M4. The values of the ad

Table1 Summary of the two projects.
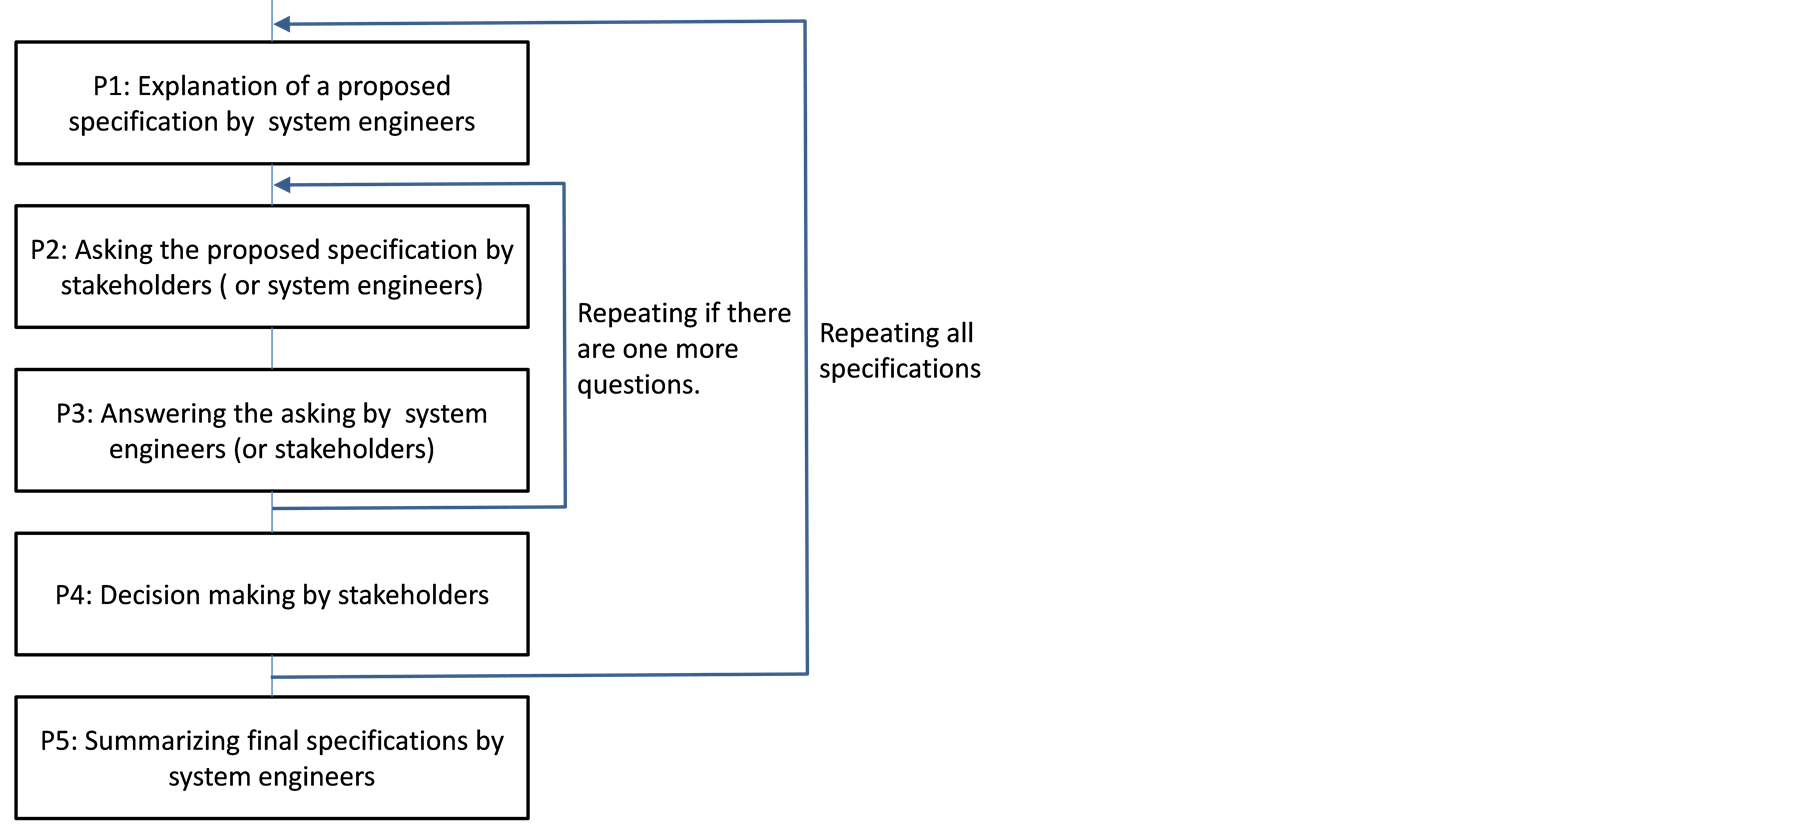
Figure 1. A typical pattern of discussion with system engineers and stakeholders.
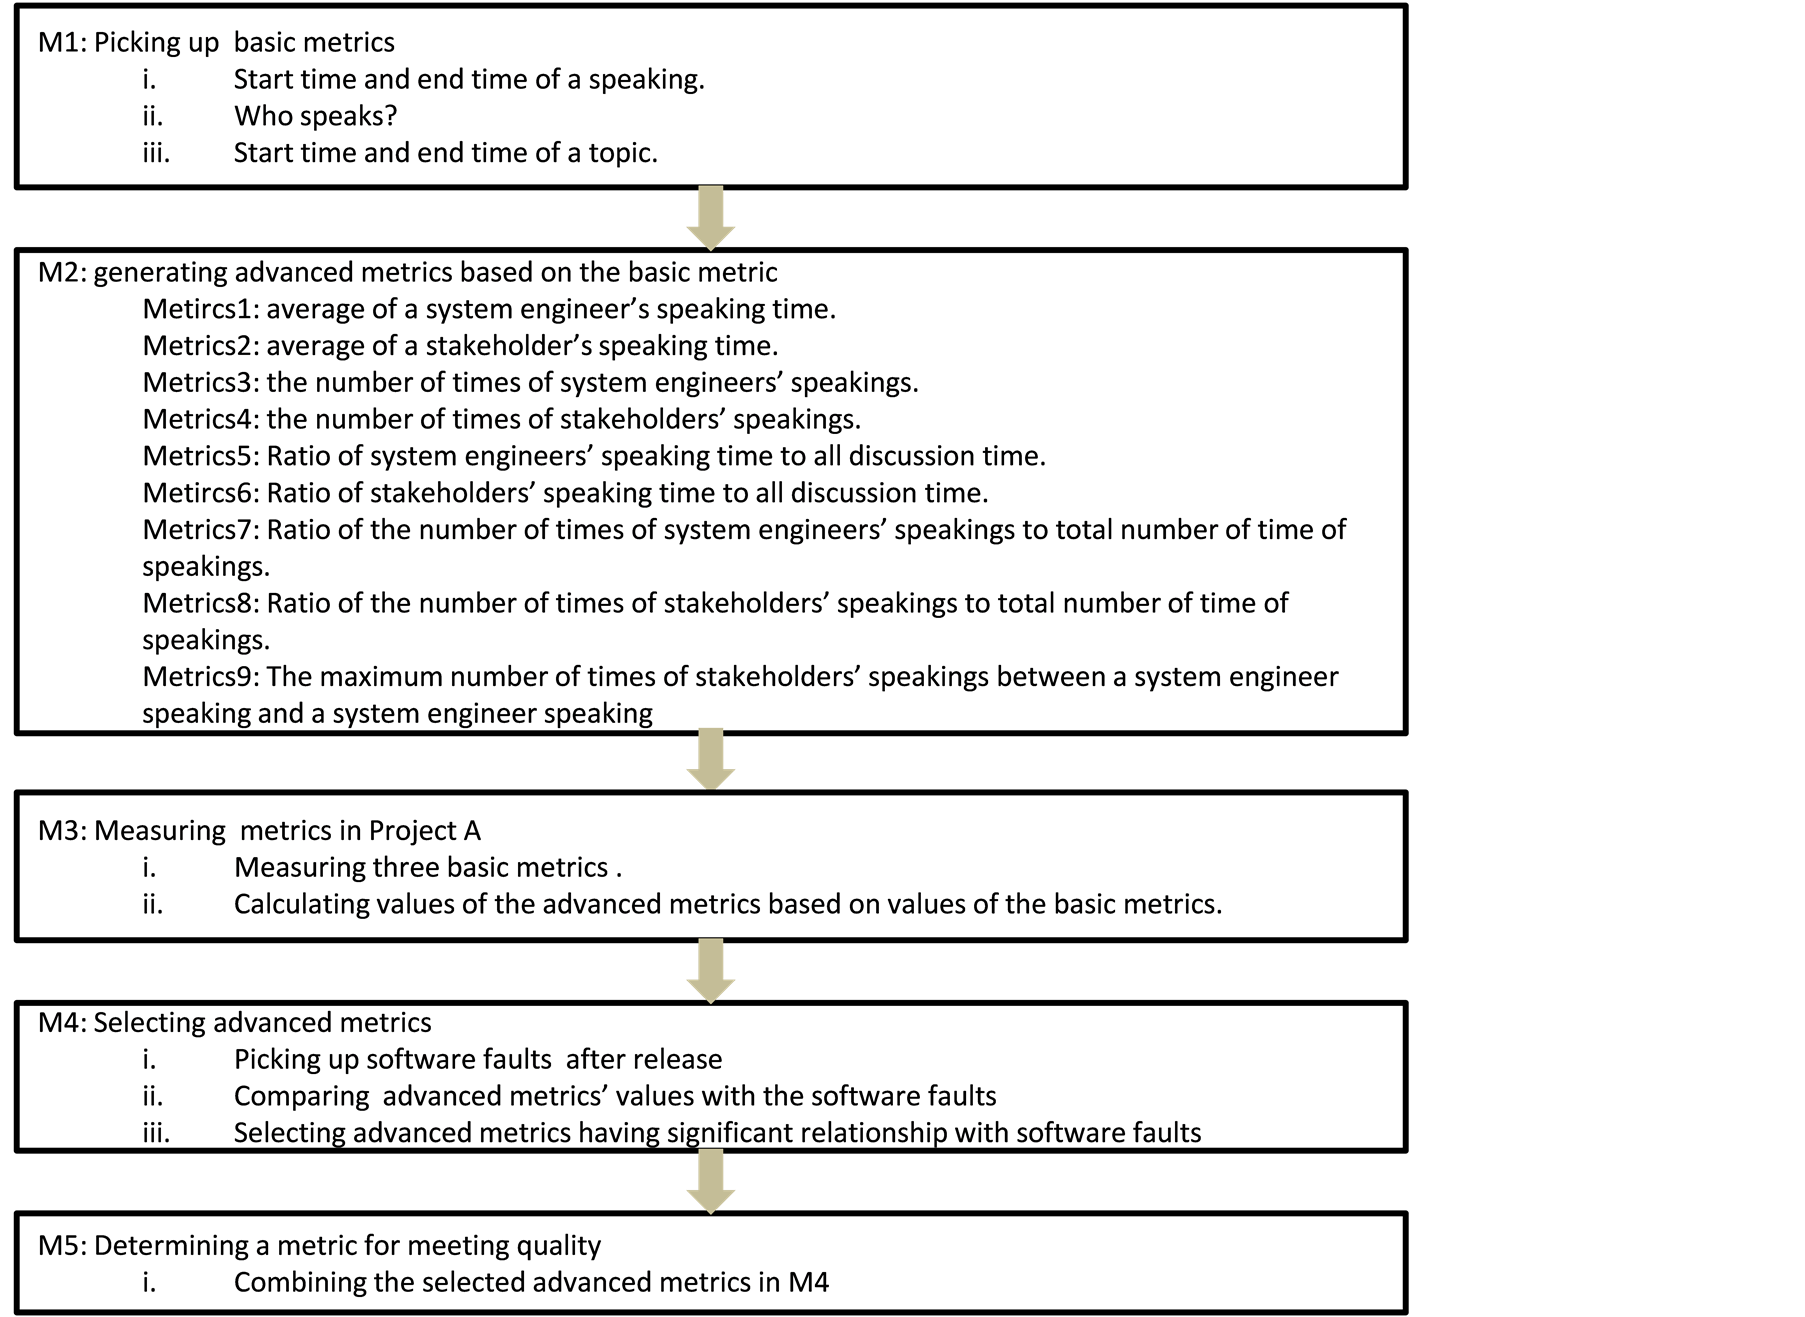
Figure 2. A procedure of making metric for meeting quality.
vanced metrics are compared with software faults after release in Project A. If an advanced metric value has relationship with software faults, the advanced metric is selected. After that, to make a simple metric for meeting quality, the selected several advanced metrics are combined in M5. Then, a metric for meeting quality in requirement analysis phase is defined. The following subsections are described from M1 to M5.
3.3.1. M1: Picking up Basic Metrics
Basic metrics are follows:
1) Start time and end time of a speaking.
2) Who speaks?
3) Start time and end time of a topic.
These basic metrics’ values are easily picked up from meeting logs such as video movies. Of course, the pickup activity does not require the expert knowledge. Everyone can pick up easily the values. “A speaking” means one conversation that a person speaks at once. For example, a report management function in an e-learning system includes two sub-functions. A system engineer explains the specifications of the report management functions in a meeting. He speaks the first sub-function from 13:10 to 13:15. Then, he speaks the second subfunction from 13:15 to 13:30, and he summarizes the function of report management from 13:30 to 13:35. In this case, “1) start time and end time of a speaking” is 13:10 and 13:15 in the first sub-function. “2) Who speaks” is the system engineer. “3) Start time and end time of a topic” is 13:10 and 13:35.
3.3.2. M2: Generating Advanced Metrics Based on the Basic Metrics
Advanced metrics based on the basic metrics are follows:
Metircs 1: average of a system engineer’s speaking time.
Metircs 2: average of a stakeholder’s speaking time.
Metircs 3: the number of times of system engineers’ speakings.
Metircs 4: the number of times of stakeholders’ speakings.
Metircs 5: Ratio of system engineers’ speaking time to all discussion time.
Metircs 6: Ratio of stakeholders’ speaking time to all discussion time.
Metircs 7: Ratio of the number of times of system engineers’ speakings to the total number of times of speakings.
Metircs 8: Ratio of the number of times of stakeholders’ speakings to the total number of times of speakings.
Metircs 9: The maximum number of times of stakeholders’ speakings between a system engineer’s speaking and a system engineer’s speaking (in Figure 1, a cycle between P2 and P3 is disordered. For example, stakeholders frequently speak without waiting for system engineer’s answer).
The advanced metrics are measured each topic. For example, in the third meeting of Project A, there are 8 topics; 1) confirmation of pending issues, 2) confirmation of a list of new functions, 3) an operation flow of attendance management in a lecture, 4) an operation flow of making a time table of examination, 5) an operation flow of making a time table for extra classes, 6) an operation flow of changing lecture schedule, 7) an operation flow of making reports, 8) an operation flow of making messages to students. Usually, 5 to 8 topics are discussed at a meeting. The topics are easily collected from a resume of a meeting. By recording start time and end time of one topic, we can make relationships the system engineer’s speaking and stakeholder’s speaking with the same topic. Figure 3 shows an example graph of system engineers’ speakings and stakeholders’ speakings in a topic. The horizontal axis means time, the vertical axis means speakers. Black names of Figure 3 mean system engineers, red names mean stakeholders. By recording each speaking start time and end time, such graph of Figure 3 can be created. In the measurement of speakings, we recorded even small speaking such as “Yes” and “I know”. The length of the vertical bars of Figure 3 means speaking time of a speaker. In addition, the rectangle area with broken line in the lower part of Figure 3 shows the Metric 9 (the maximum number of times of stakeholders’ speakings between a system engineer speaking and a system engineer speaking). In the rectangle area, a black bar means system engineer speaking, a red bar means a stakeholder speaking. The number of red bars between two black bars is a value of the Metrics 9. In the case of the rectangle area of Figure 3, the value of the Metrics 9 is 4.
3.3.3. M3: Measuring Metrics in Project A
We measured values of the basic metrics while we referred video movies. The length of the meeting video mov-
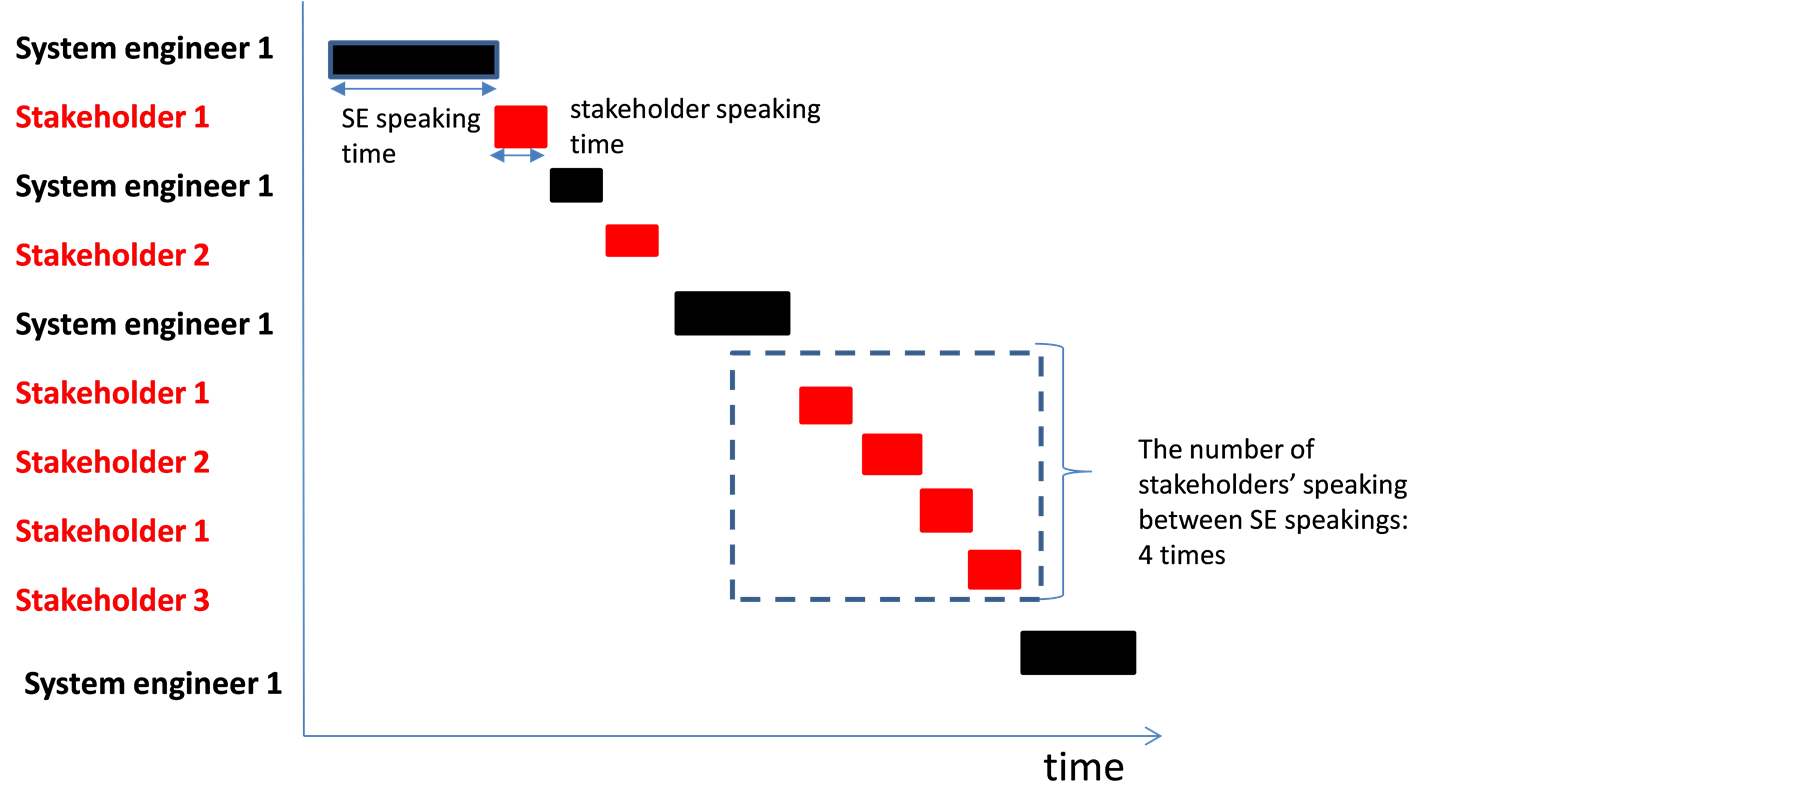
Figure 3. A graph of system engineers and customers’ speaking.
ies is 32 hours. At the beginning, we tried automatic identification of speakers and speaking time using an automatic identification technique for speakers. However, correctness of the automatic identification was very low. Then we made a support tool for measuring values of the basic metrics (see Figure 4). The tool consists of a video running area and an identifying speaker area. In the tool, while the video running, a researcher clicks a “speaker” button at the identifying speaker area. For example, a researcher watched the movie at the video area. If a speaker changes to another speaker on the movie, the researcher clicks the new speaker’s name button on the identification area. Although the change of the speaker is manual on the tool, the researcher is not required expertise knowledge and domain knowledge. In addition, the movies of the video area and the time stamp of the identification area are synchronized. Then, the work of identifying speakers can repeat like replaying videos.
3.3.4. M4: Selecting Advanced Metrics
From the advanced metrics, significant metrics are extracted. The steps of the extraction are follows:
(Step 1) All values of the basic metrics are measured. The all values of the advanced metrics are automatically calculated based on the values of the basic metrics.
(Step 2) By analyzing minutes of meetings, we classify the topics to two categories; discussions that caused software faults, and discussions that did not cause the software faults. The software faults are “sending a daily e-mail even if there is no schedule”, and “lack of a function for calculating total sum of attendance data”.
(Step 3) The significant differences of average values of each advanced metrics between the two categories are clarified by t-test. If the significant difference is large, the advanced metrics are a meaningful metrics for measuring meeting quality.
In Step 1, values of the basic metrics are measured by the tool of Figure 4. The values of the advanced metrics are automatically calculated. Figure 5 shows the values of the 9 advanced metrics in 8 topics of the third meeting of the Project A. A value of Metric 3 (the number of times of system engineers’ speakings) and a value of Metric 4 (the number of times of stakeholders’ speakings.) of the topic 3 (yellow bar) are bigger than the values of the other advanced metrics. In Step 2, we identified 8 discussions related with the software fault; “e-mail sending”, and 4 discussions related with the software fault; “sum of attendance data”. The way of the identification was to watch all video movies of the meetings, and manually identify the discussions of all minutes of the meetings. Then, the 8 discussions and the 4 discussions are categorized to a group related with the software faults. The other discussions are categorized to a group with normal specifications. As a result, there are 12 topics related with the software faults, there are 44 topics related with normal specifications.
In Step 3, averages and distributions of the 9 advanced metrics are calculated. The averages of the advanced metrics between the two categories are shown in Figure 6. Moreover, Figure 7 shows a box plot graph of the 9 advanced metrics including maximum, minimum, average, 25%, 75% values. We confirmed that the average of Metric 1 of the group related with normal specification was more than the average of Metric 1 of the group related with the software faults. Moreover, the average of Metric 9 of the group related with the software faults is
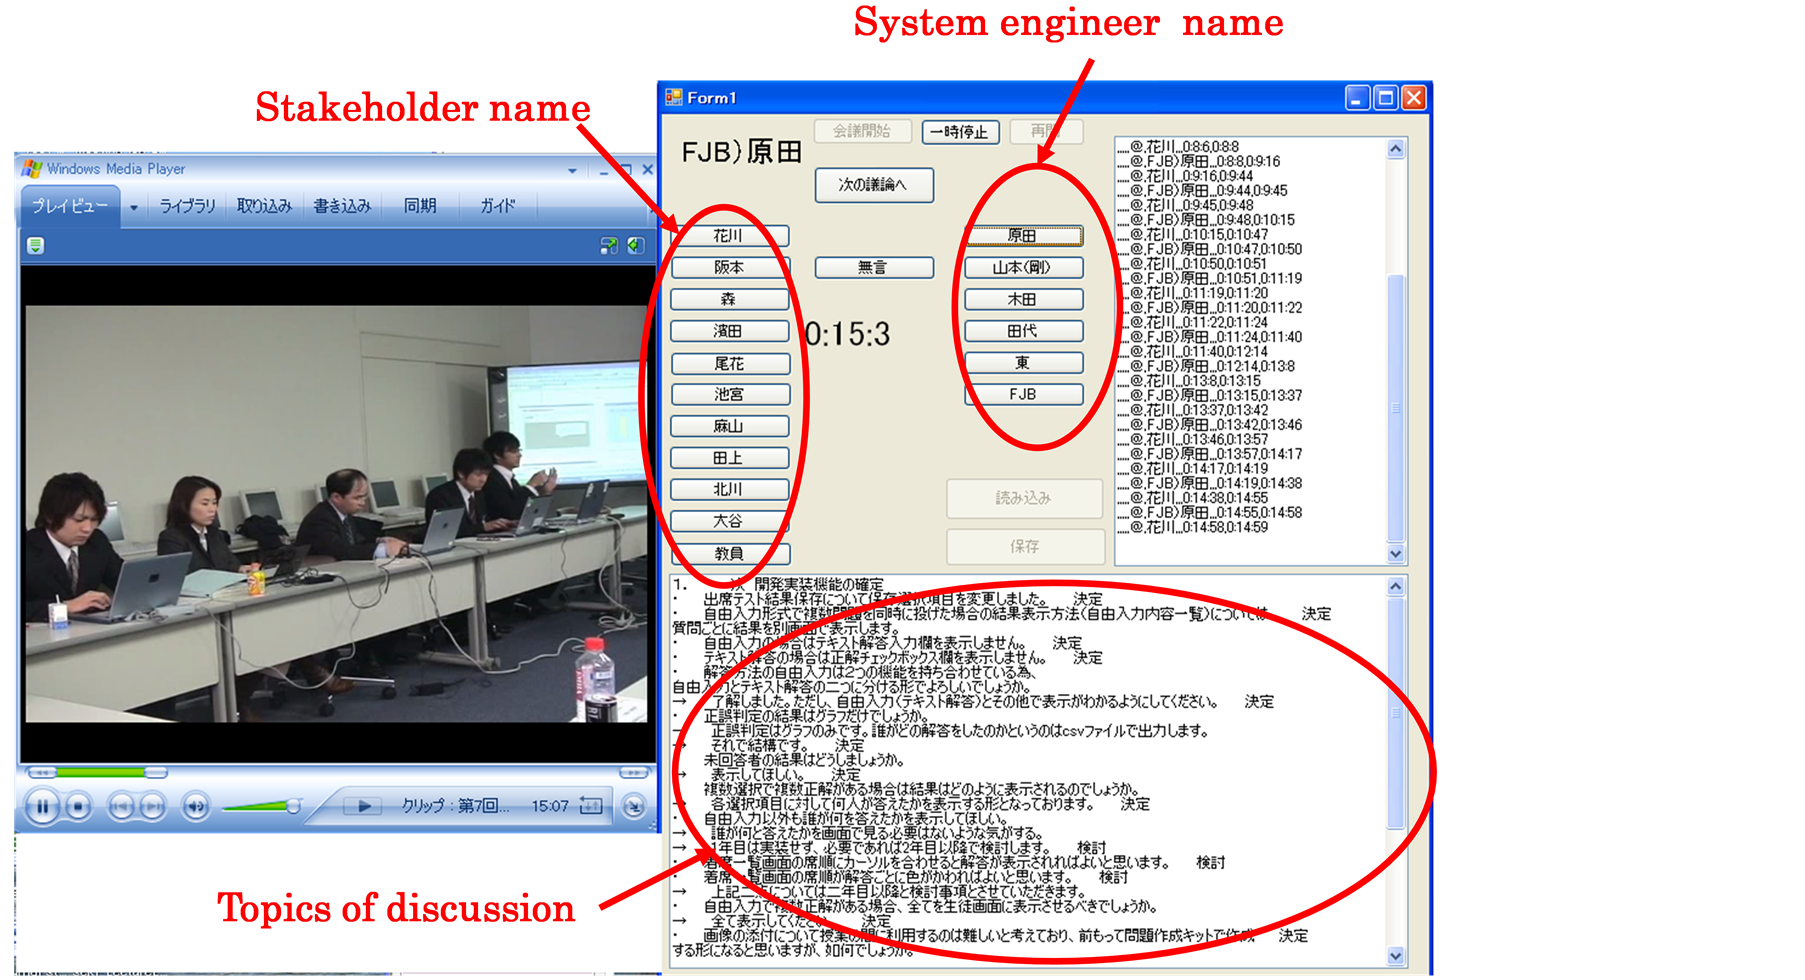
Figure 4. A tool for measuring values of the basic metrics.
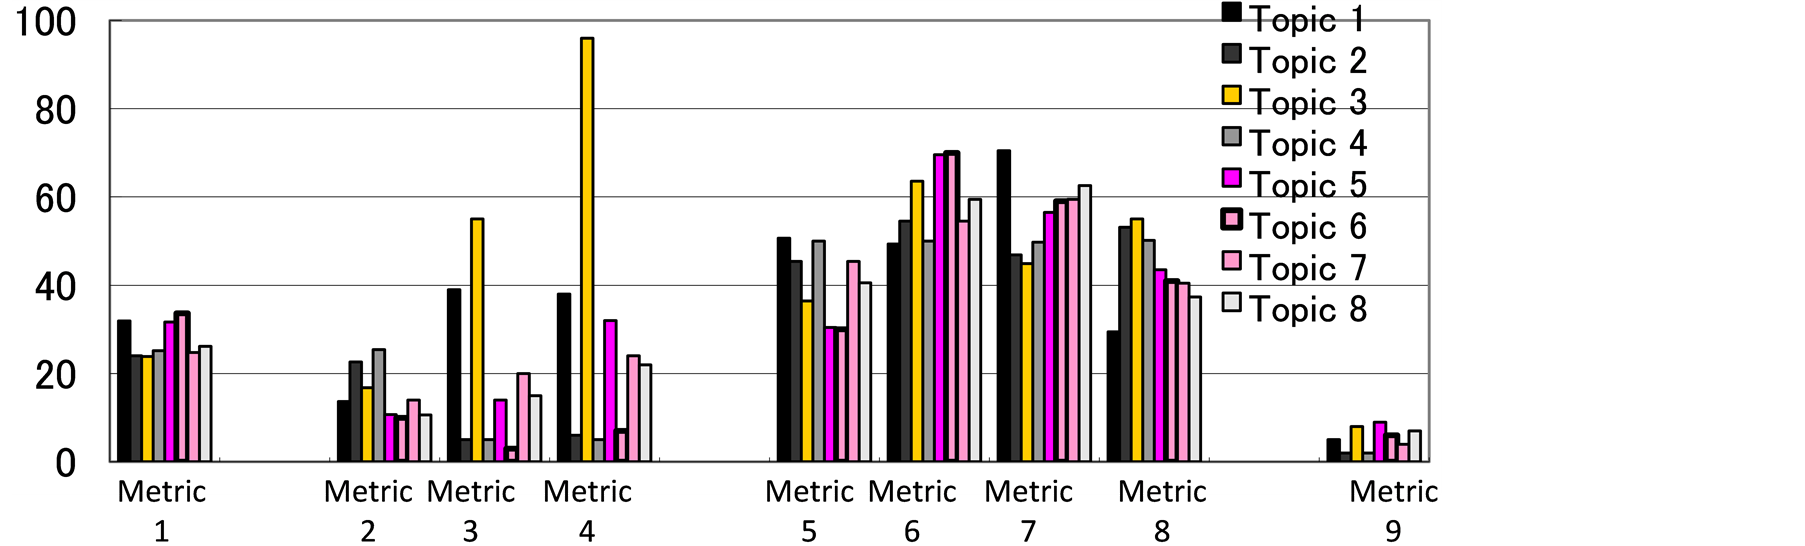
Figure 5. Values of the 9 advanced metrics of 8 topics of the third meeting of the Project A.
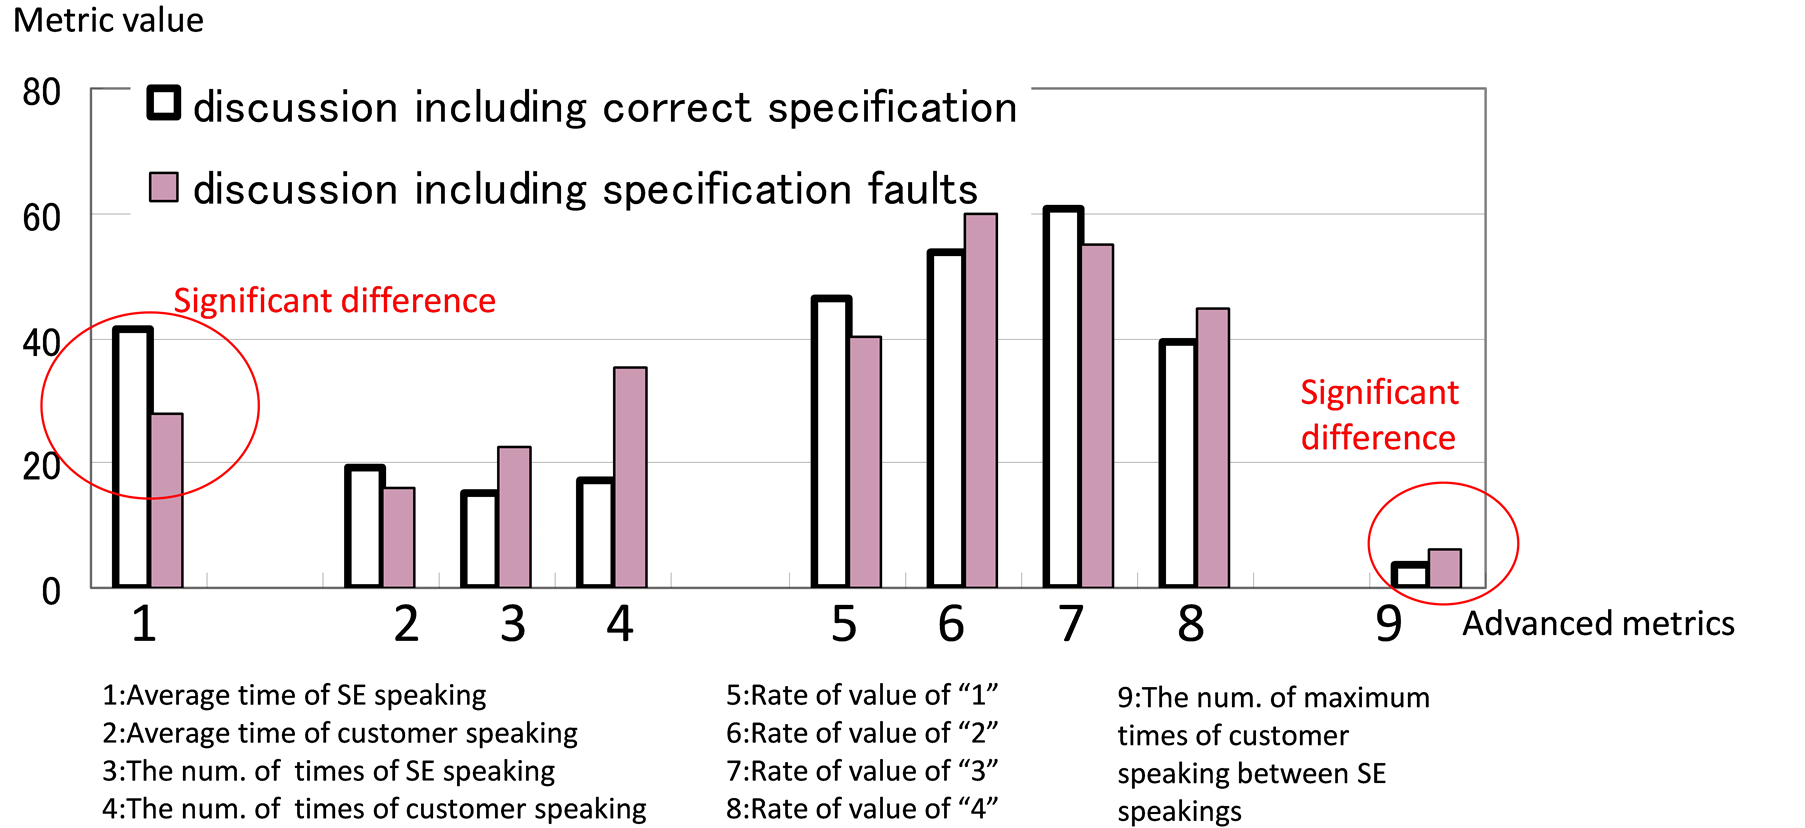
Figure 6. Average values of the 9 advanced metrics in the Project A.
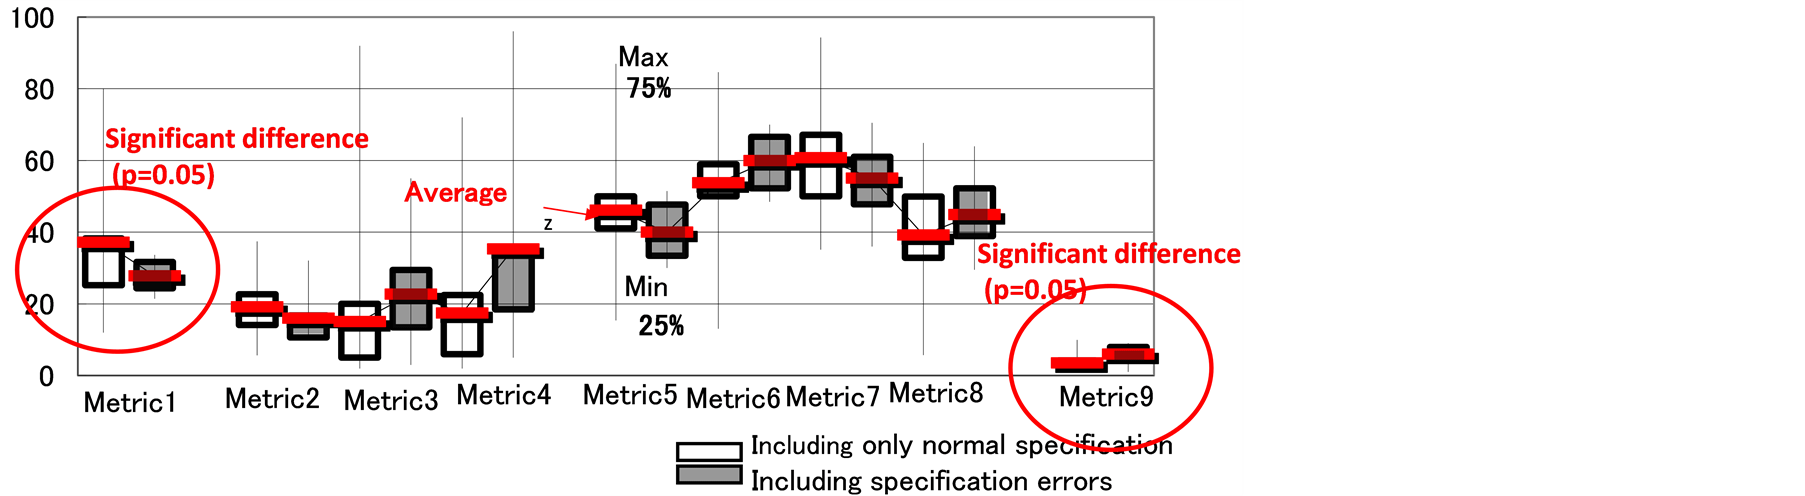
Figure 7. Box plot of values of the 9 advanced metrics in the Project A.
more than the average of Metric 9 of the group related with normal specification. The significant difference between the two categories is clear by t-test. With significant level 5%, there are significant differences between the two categories in Metric 1 and Metric 9. That is, if time of the system engineer speaking is short, and if stakeholders frequently speak between system engineer speakings, the possibility of the not-smooth discussion will be high. Quality of such discussions and meetings will be low. Then we can predict that the topics including such not-smooth discussions leads software faults in requirement analysis.
In short, a high quality meeting is that a system engineer spends much time to explain specifications (P1 of Figure 1), after that, a system engineer answers a stakeholder’s question, or a stakeholder answers a system engineer’s question (P2 and P3 of Figure 1). The “answers and questions” is near to “one answer and one question”. In addition, the system engineer spends long time to summarize the discussions and the specifications (P5 of Figure 1). We predict that the specifications are correct because the specifications were discussed in high quality meeting. In contrast, a low quality meeting is that system engineer spends little time to explain specifications, moreover, stakeholders do not sufficiently understand a concept of specifications, and a system engineer’s thought. Stakeholders ask many questions and claim their opinions without waiting system engineers’ answers and explanations. Moreover, because stakeholders and system engineers repeat questions and opinions that are off the point of the discussion topic, it takes long time to discuss. Quality of meeting in such situations will be low. The situations of complicated discussions can be detected from values of the two advanced metrics; Metric 1 and Metric 9.
3.3.5. M5: Determining a Metric for Meeting Quality
Based on the result of the previous subsection, the metric for meeting quality has been proposed as follows:
 (1)
(1)
Metric 1 is average of a system engineer’s speaking time, Metric 9 is the maximum number of times of stakeholders’ speakings between a system engineer speaking and a system engineer speaking. We found two important metrics for measuring meeting quality. Although values of the two metrics may be independently measured, we make a metric “Meeting” that is combined with Metric 1 and Metric 9. By combining the two metrics, meeting quality can be more easily measured in practical industrial society.
4. Evaluation
4.1. Outline of Evaluation
The proposed metric “Meeting” is evaluated in another Project B (see Section 3.1). A procedure of the evaluation is show in Figure 8.
At E1 of Figure 8, values of the three basic metrics are measured. By the tool of Figure 4, values of the basic metrics are extracted from video movies of Project B. Next, at E2 of Figure 8, values of “Meeting” (see Equation (1)) are calculated. A value of “Meeting” is calculated every topic. On the other hand, software faults that occurred after release are analyzed at E3 of Figure 9. We decide a topic that concerned with the software faults. The topics concerned with software faults are called “TOPICs A”. Then, at E4 of Figure 8, by values of “Meeting” every topic, the doubtful topics are extracted. If a value of “Meeting” of a topic is less than a threshold value of “Meeting”, possibility of occurrence of software faults in the topic discussion will be high. The topics that
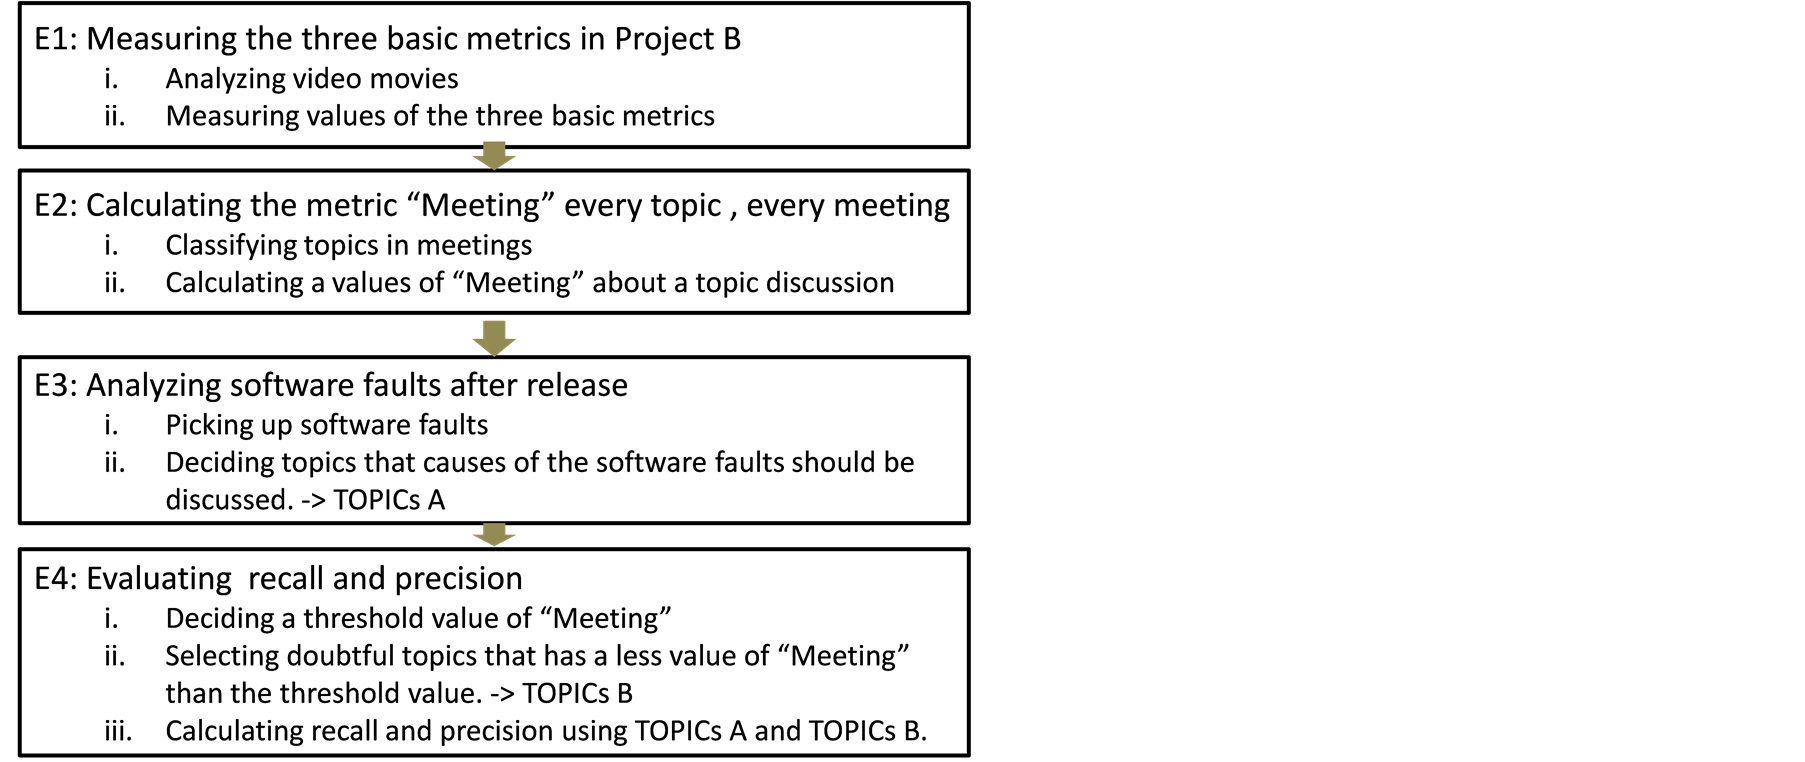
Figure 8. A procedure of evaluation of the “Meeting”.
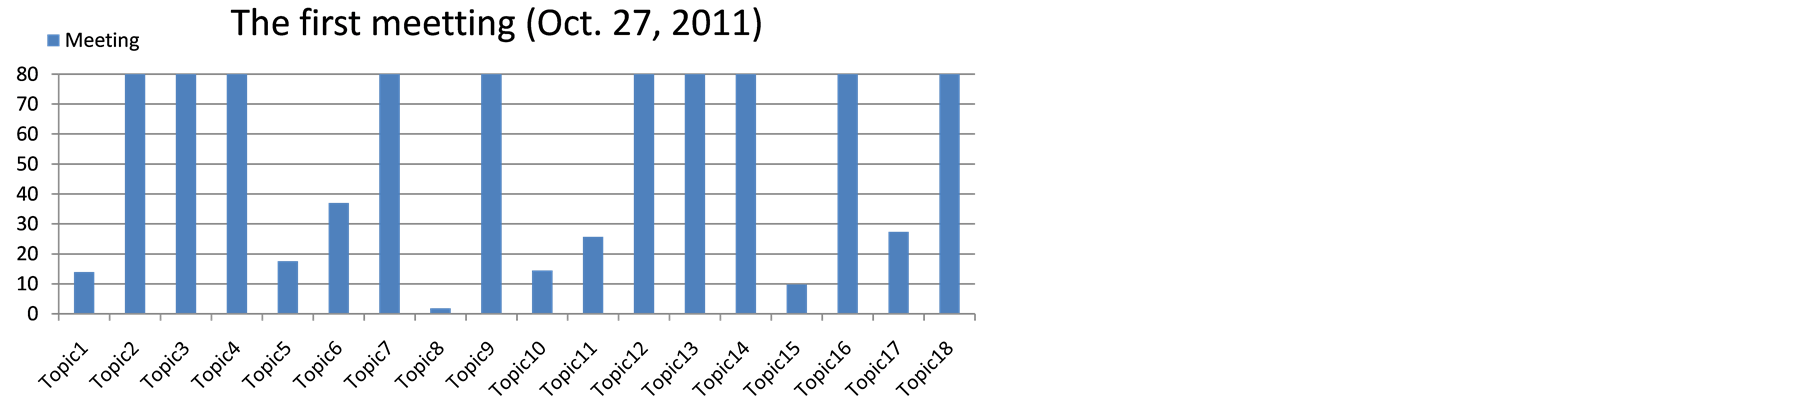
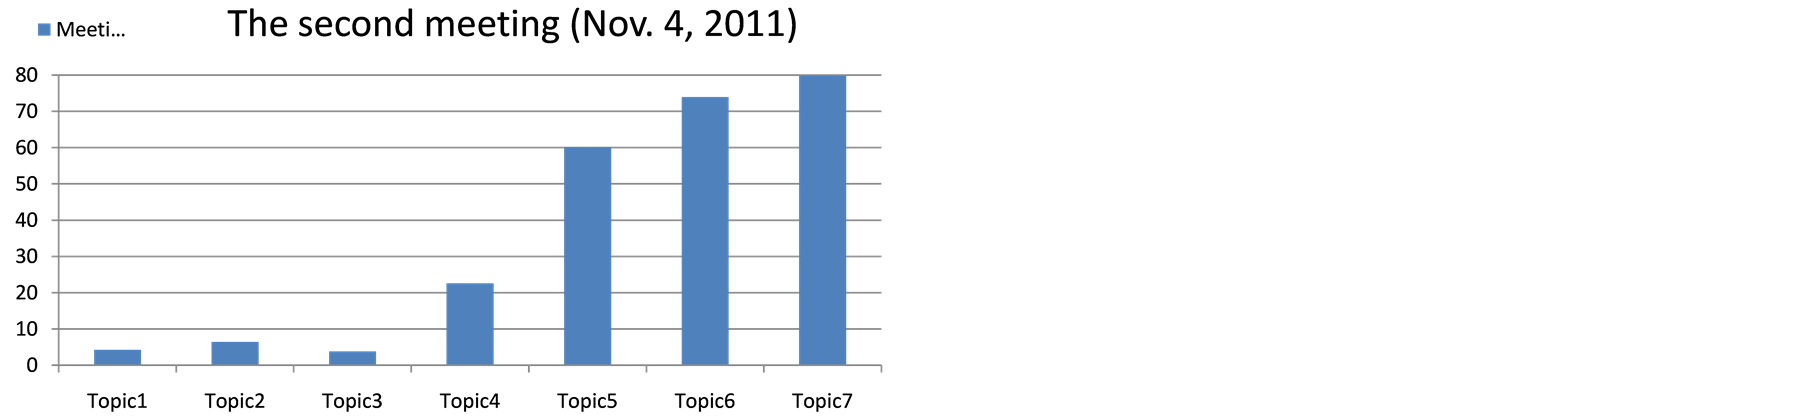
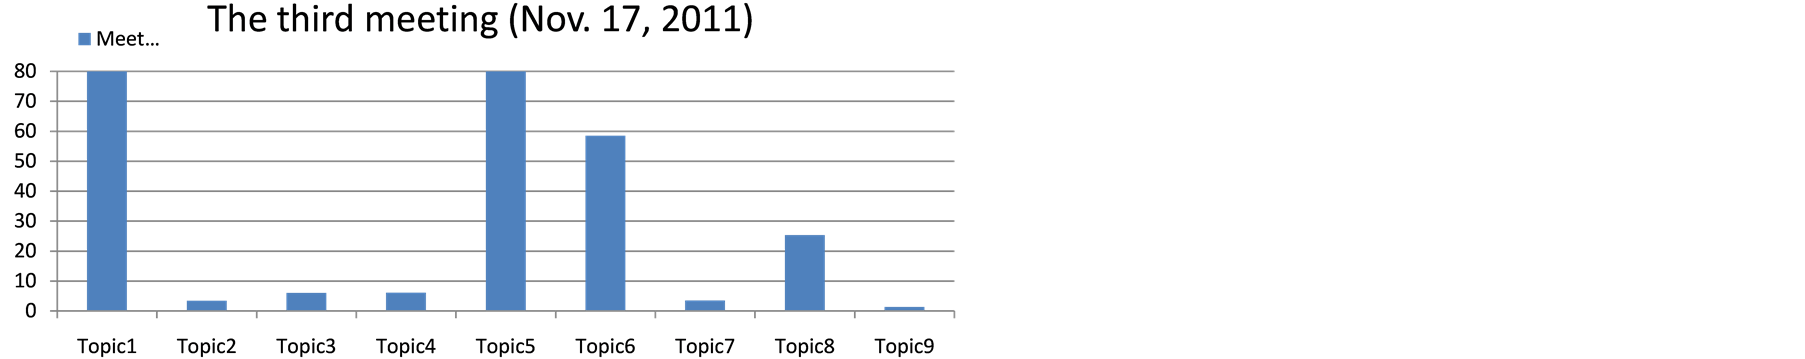
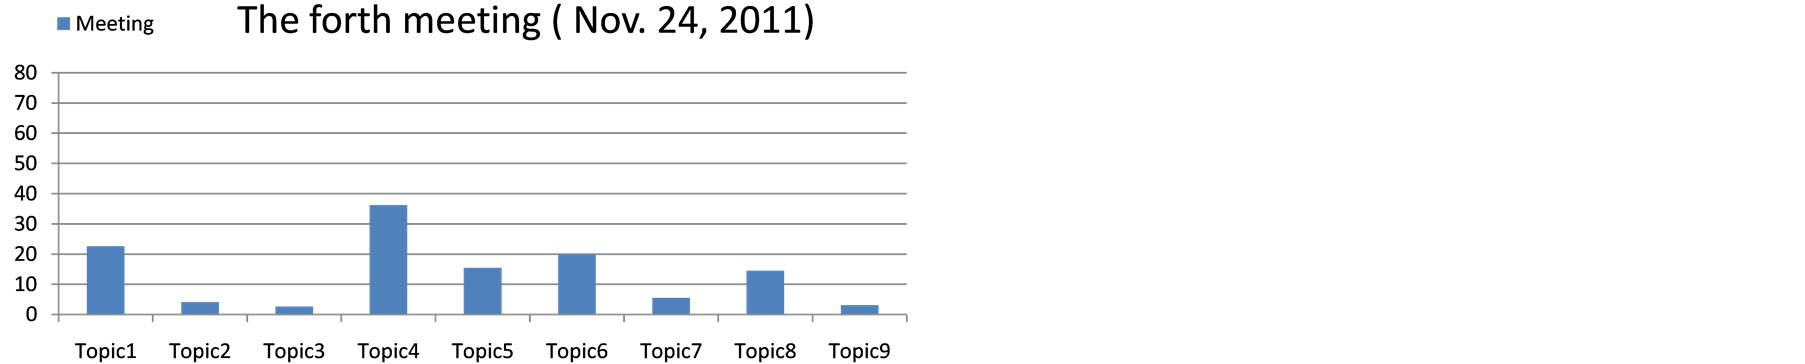
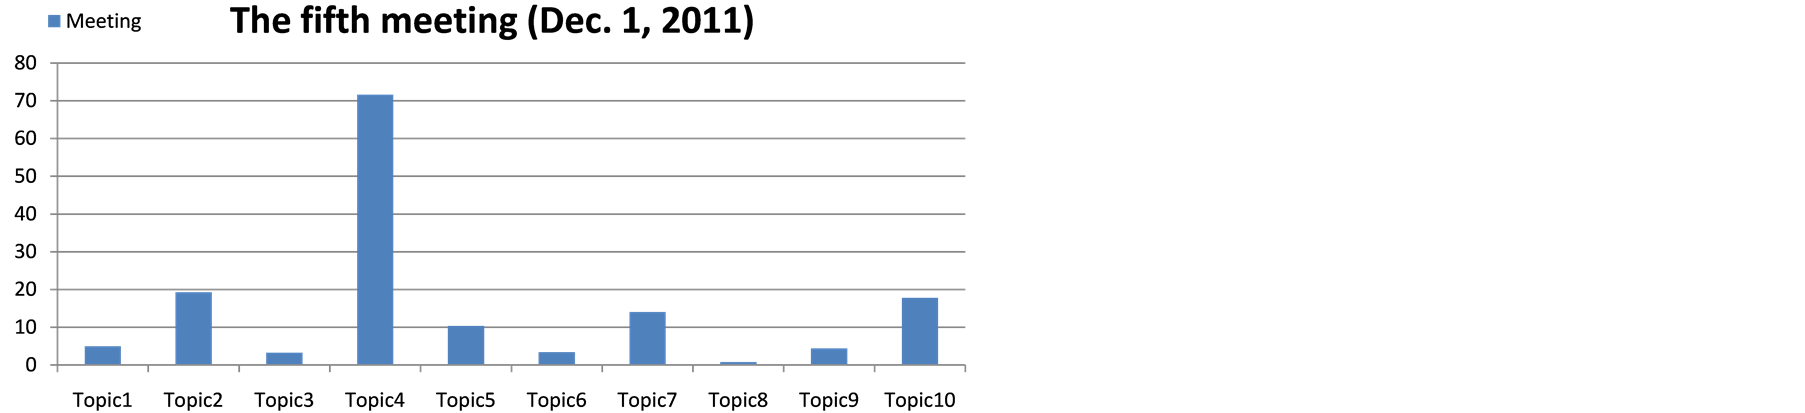
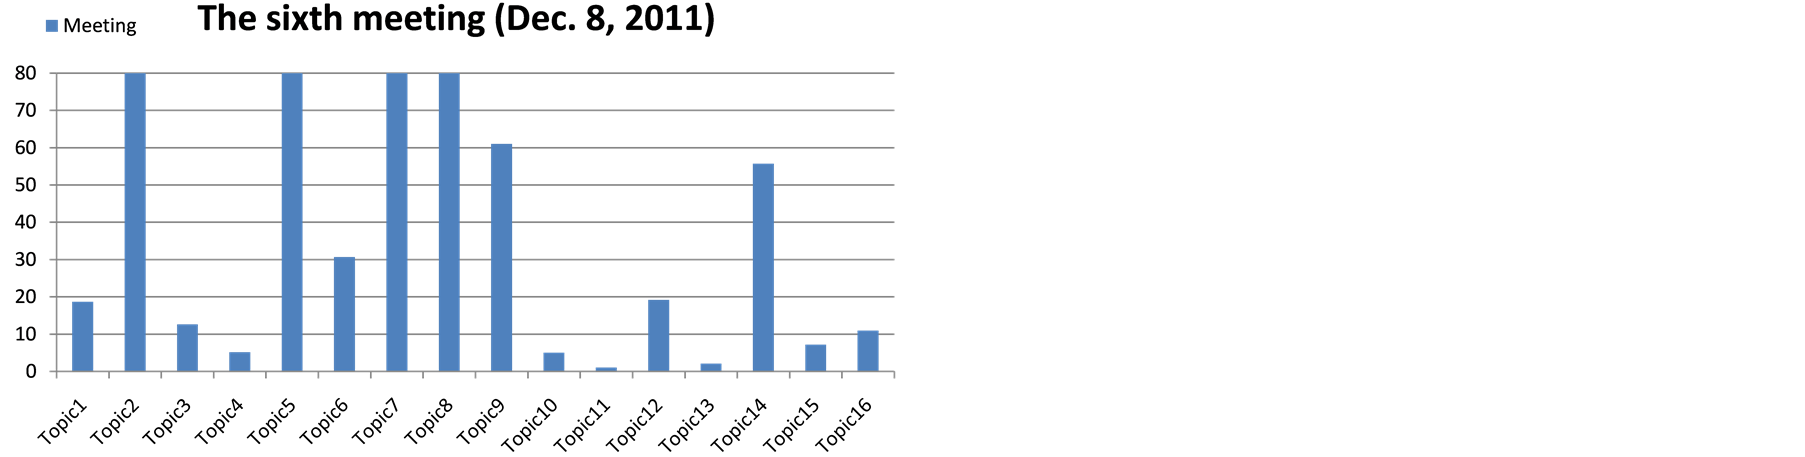
Figure 9. All values of “Meeting” in Project B.
are extracted by “Meeting” are called “TOPICs B”. After that, to evaluate correctness of “Meeting”, values of recall and precision are calculated with “TOPICs A” and “TOPICs B”. That is, a set of “TOPICs A” is a correct set in manual. A set of “TOPICs B” is a set that should be evaluated.
4.2. E1: Measuring the Three Basic Metrics in Project B
In the Project B, six meetings were held in the requirement analysis phase. Total sum of meeting time is 15 hours, total sum of the number of topic is 69. Using the tool of Figure 4, the three basic metrics were measured.
4.3. E2: Calculating Values of the Metric “Meeting”
Figure 9 shows all values of “Meeting” of all topics in the six meetings. Here, details of the six meetings are explained. The first meeting is a kick-off meeting. A system engineer mainly talked without discussion with stakeholders. The system engineer talked about introduction of members of developing, schedule, and confirmation of delivered documents and software. Software specifications such as important essence of requirement analysis were not discussed. Therefore, values of Metric 9 (The maximum number of times of stakeholders’ speakings between a system engineer speaking and a system engineer speaking) of the ten topics in the first meeting were 0, because stakeholders had no questions. Then the values of “Meeting” of the ten topics were maximum high.
In the second meeting, values of “Meeting” from Topic 1 to Topic 4 were low, although values of “Meeting” from Topic 5 to Topic 7 were high. The topics were software specifications that were essence in requirement analysis phase. Topic 1 was discussed report submission functions with sending e-mails’ confirmations. Topic 2 was about group authority for each function, Topic 3 was discussed how to display attendance information lists. The three topics’ “Meeting” values are especially low. The third meeting had nine topics. Low values of “Meeting” are Topic 2, 3, 4 and Topic 7 and 9. Attendance information lists were again discussed in Topic 2. Check items at report submission were discussed in Topic 3. Topic 4’s discussion was calendar functions and lecture time tables. Topic 7 was about operability of existing functions. Topic 9 was lists of examination schedule on calendar.
In the fourth meeting, Topic 2, and Topic 3 have low values of “Meeting”. Topic 2 was user interface of report submission. Topic 3 was a title of the top page of the system. Topic 5 had a discussion of user interface of input data of grade calendar of our university. Topic 7, Topic 8, and Topic 9 were about improvement existing functions. In the fifth meeting, values of “Meeting” of all topics were low, excepting Topic 4. Because the fifth meeting was final stage, remaining and pending specifications were discussed again. Until now, report submission functions were already discussed. However, pending specifications about report submission was discussed in Topic 1. Top pages design was again discussed in Topic 2, Topic 6, Topic 9, and Topic 10. Topic 3 was operability of system administrators of our university. Topic 5 was a policy of data sorting such as student lists. These discussions were final decisions of software specifications.
In the final sixth meeting, the topics were reconfirmation and summarization of the discussions in the five meetings. Software specifications were fixed in the sixth meeting. Therefore, a system engineer mainly talked. Stakeholders spoke only a few questions and a little response such as “Yes”, “OK”. Therefore, values of “Meeting” were relatively high. However, values of “Meeting” of Topic 1, 3, 4, 10, 11, 13, 15, 16 were low. By all rights, the complicated discussions do not occur because of reconfirmation and summarization of the discussion conducted thus far. Because the discussions of the previous meetings were not sufficient, the discussions in the sixth meeting were complicated.
4.4. E3: Analyzing Software Faults after Release
To clarify relationship between values of “Meeting” and software faults, the software faults after release were analyzed. The number of the fault is 17, examples of the faults were as follows:
- Insufficient message for communication business from school staff to students.
- Not access the existing systems because of wrong URL.
- Too short session-out time.
- Wrong newly arrived e-mail.
- Not access SSO (single sign on) in the file recovery system.
- Vague data count-information on the top page of portal-site.
- Does not display lists of personal files on the network directory.
The most significant software fault is that teachers were not able to use a function of calling the roll in all lectures. The slight faults such as message errors and vague information on the page also occurred.
These software faults are categorized to the topics that were discussed in the 6 meetings. For example, the function of calling the roll was discussed in Topic 3 of the second meeting and Topic 2 of the third meeting, Topic 7 of the fifth meeting. Moreover, the messages of communication business from school staff to students were discussed in Topic 9 of the fourth meeting. The classification of the software faults are shows Table2 For example, the first fault is a trouble of single sign on Web mail. The topic of single sign on was discussed in the
Table 2 . Classification of the software faults.
sixth topic of the fifth meeting. On the other hand, the faults No. 3, 4, 7, 11, 12, 13, 14, 15, 16, 17 are concerned with several topics in several meetings. For example, the fourth fault of cancelling lecture is concerned with two topics; the twelfth topic of the sixth meeting, and the fifth topic of the fourth meeting. The function of the lecture cancelling was discussed in the fourth meeting, after that, the function was again discussed in the sixth meeting. Especially, both the fault No. 13 and the fault No. 14 are concerned with a function of submission reports. Then the numbers of the concerned topics also are many; seven topics in the fault No. 13, five topics in the fault No. 14. That is, the submission reports were repeatedly discussed in several topics and several meetings. We can imagine that the report submission function is problematic. A most influential fault is No. 7 because teachers were not able to call the role in all lectures.
On the other hand, the fault No. 5, 6, 9, 10 were not concerned with all topics in the meetings. The fault No. 5 and No. 6 are concerned with changing password, and the fault No. 9 is concerned with character code. The “changing password” and “character code” are very general topics. Even if the “changing password” and “character code” were not discussed in the meetings of the requirement analysis phase, these functions should be designed in the design phase. Therefore, we think that these faults were caused in the design phase meetings. Meetings of design phase are out of range of this evaluation and our research.
4.5. Evaluating the “Meeting” in Recall and Precision
Purpose of the metric “Meeting” is detection of doubtful topics that may cause software faults after release. Meaning of the detection is that software faults will be predicted in requirement analysis phase. Requirement analysis phase is an early stage of software development process. If software faults are predicted in early stage such as requirement analysis phase, influence of the software faults will be smaller than detection of software faults on later stage of software development such as implement phase and test phase. Therefore, in this section, we evaluate whether the “Meeting” can predict software faults that occur after release. At first, we decide a threshold value of “Meeting”. If a value of “Meeting” is less than the threshold value, the topic may cause software faults in future. In this paper, the threshold value is set to “20.0” (see the red line of Figure 11). The value of the threshold will be discussed in future research.
Next, the 17 software faults after release are mapped to the topics of the 6 meetings (see Figure 10). For example, the first fault is that users can not do single sig on Web mail system. The “single sign on” in Web mail was discussed in the sixth topic of the fifth meeting. Therefore, in Figure 10, a square of intersection with the row of the first fault and the column of the sixth topic of the fifth meeting is filled with black color. Moreover, the third fault concerned with the four topics. The third fault is that teachers can not call the roll in lectures. The function of calling roll was discussed several times in various meetings. The matching between the software faults and the topics of the meetings is manually by ourselves. Red circles in Figure 10 means that the topics are detected using the threshold value of “Meeting” as doubtful topics. That is, the red circles show right detections of doubtful topics using the “Meeting”.
Figure 11 shows relationships between values of “Meeting” and occurrence of software faults. The red arrows in Figure 11 mean topics that were concerned with the software faults. The red arrows in Figure 11 are derived from black-filled square in Figure 10. The total number of all topics of all meeting is 69. The number of topics that have “Meeting” values less than 20 is 37, the number of topics concerned with the 17 software faults is 26. The number of topics that concerned with the software faults, at a same time the values of “Meeting” are less than 20 is 22. Precision is 59.5%, recall is 84.5%.
5. Discussion
5.1. The Low Value 59.5% of Precision
The value of precision for evaluating usefulness of the metric “Meeting” is not high. 15 detections of 37 detections were wrong (see Section 4.5). That is, although the values of “Meeting” are less than threshold value 20.0, the topics did not cause software faults. Table 3 shows obvious reasons of the wrong detections. For example, the eighth topic of the first meeting (see No. 1 of Table 3) is new application software for mobile terminals such as smartphones. The stakeholders and system engineers discussed the necessary of translating the existing e-learning system into Android OS for mobile terminals. A value of “Meeting” of the topic is 1.8. The value of “Meeting” is very low. However, software faults concerned with the translation of the existing system did not occur. The reason is that the translation of the existing system to mobile terminals was not implemented. That is, the stakeholders decided that we did not need the translation of the existing system. Of course, software faults concerned with the translation did not occur.
Next, we show reasons of the tenth topic and the fifteenth topic of the first meeting (see No. 2 and No. 3 of Table 3). The tenth topic of the first meeting is “Sending e-mail”, the fifteenth topic of the first meeting is “Intensive course”. These topics were improvement requests for the previous version of the system. That is, the topics were frequently discussed before starting of this project. The stakeholders and system engineers knew well the requests. Then, in the meeting, the stakeholders spent long time and continued speaking the troubled cases that they experienced in the previous version of the system. Therefore, the value of the “Meeting” was low. However, because the stakeholders and the system engineers sufficiently knew the troubles, it is thought that software faults caused by the topics did not occur.
Finally, these are interesting cases in the tenth topic of the sixth meeting and the eleventh topic of the sixth meeting (see No. 14 and No. 15 of Table 3). The system engineers had demonstrations in the sixth meeting.
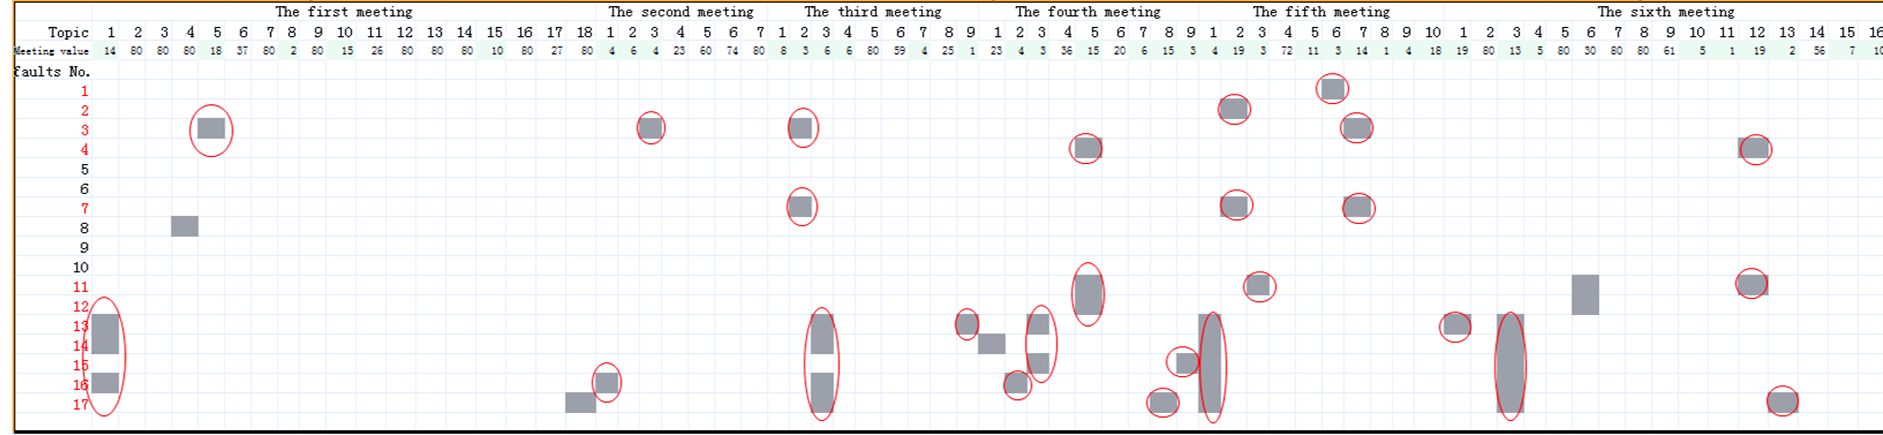
Figure 10. Matching the software faults with the topics of the meetings.
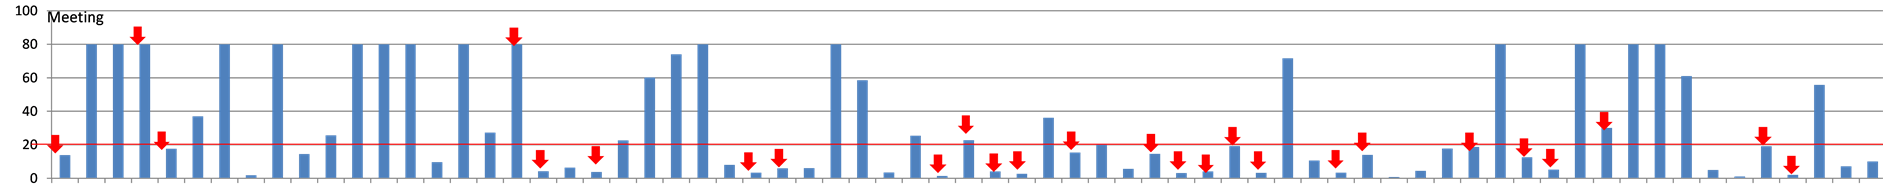
Figure 11. Relationship between “Meeting” values and software faults.
Table 3. Obvious reasons of the wrong detections.
Table4 Repeatable topics in the meetings.
However, they could not smoothly prepare the projector equipment for the demonstrations. The stakeholders waited for the system engineers’ preparation. During waiting the preparation, the stakeholders talked with the other stakeholders according to the topics, freely. As a result, the values of “Meeting” were low because Metric 9 (see Equation (1): the maximum number of times of stakeholders’ speakings between a system engineer speaking and a system engineer speaking) became high. The reason was dependent on the exceptional phenomenon. Originally, these phenomena should be deleted from video movies before measuring “Meeting”.
5.2. Failing Prediction of the Software Faults
The 17 software faults occurred after release in the project. The 12 software faults were detected by the values of “Meeting” (see Figure 10). The 5 software faults were not detected by the “Meeting”. In this section, we discuss reasons why the faults were not detected. In Table 2, No. 5, 6, 8, 9, 10 of the software faults were not detected by the “Meeting” (see Figure 10). The No. 5 and No. 6 of the software faults are concerned with “Change password”. In the No. 5 of the software faults, the length limitation of password in e-learning system was different from the length limitation of password in Web mail system. Therefore, a student who set long password was not able to sign on Web mail. In No. 6 of the software faults, after changing limitation of password length in the Web mail system, several students were not able to sign on the e-learning system. The Web mail system was an existing system that was updated in minor change in the project. Password policy of the both systems was not discussed in any topics of the meetings in this project. Completely, system engineers and stakeholders forgot the password policy. Then, a topic concerned with password policy did not appear in the 6 meetings. In addition, the password policy may be considered at the design phase in the project. As same as the No. 5 and No. 6, the software fault No. 9 (Character code), and No. 10 (Network connection) were not also discussed in the meetings of software requirement analysis phase. These topics were discussed in infrastructure design meetings of the design phase of the project, not software requirement analysis phase. In this way, software faults that were not discussed at meetings in requirement analysis phase can not be detected using the metric “Meeting”. In short, limitation of the metric “Meeting” is that software faults not discussed in meetings can not be detected.
5.3. Repeatable Topics in the Meetings
As a result of analyzing meeting video movies, we found a specific feature. The function of submitting reports was discussed in various topics of various meetings. The number of all topics of all meetings is 69. The number of topics concerned with submission of reports is 10; one time in the first meeting, one time in the second meet
ing, two times in the third meeting, three times in the fourth meeting, one time in the fifth meeting, two times in the sixth meeting. The discussion of report submission was not concentrated at one topic. The discussions were repeated in all meetings. We checked the conversation of the topics “submission report” in video movies. The details of the specification for the “submission report” were changed on every discussion. Of course, because the previous discussion was insufficient, the specification was discussed repeatedly. However, the stakeholders sometimes canceled the specification that was already determined in the previous meeting. That is, the specification was changed again and again on every meeting. The change of specification may cause software faults. Such change causes high software process complexity, then, high software process complexity causes low quality software [20] [21] . In addition, a new metric of measuring repeatability of same topic is required. In future, repeatability of a topic will be embedded to the metric “Meeting”.
The numbers of repeat of same topics are shown in Table4 The “X” marker in Table 4 means occurring of the topics. The “-” marker means not occurring of the topics. In Table 4, we pick up 6 topics that repeated frequently. The topic concerned with report submission repeated six times, that is, the topic repeated in all meetings. The topic concerned with calendar repeated five times, the topic concerned with call roll repeated four times. The numbers of repeating the topics are compared with the software faults (see Table 2). Three software faults concerned with report submission occurred, two software faults concerned with call roll occurred, one software fault concerned with calendar occurred. It is thought that the number of repeating a same topic in all meetings may indicate doubtful topics that may cause software faults in future.
6. Conclusion
We propose a new metric for meeting quality in a software requirement analysis phase. The metric needs only when and who speaks in meeting. The metric can distinguish smooth discussions with complicated discussions. As a result of application of projects, the values of the metric were able to indicate occurrence of software faults after release. Recall of detecting the software faults is 84.5%, precision is 59.5%. By analyzing the comparison between “Meeting” values and software faults in detail, topics that caused 4 software faults did not appear in any meetings. If topics did not appear in meetings, we can not predict software faults using the metric “Meeting”. This is a limitation of the metric “Meeting”. Moreover, we found that repeatable topics in several meeting may cause software faults. In future, a tool for auto-measuring when and who speaks at meetings will be developed. In addition, we will be clear relationships among various software development processes and methodologies, then, more details of relationships between values of the metric and occurrence of software faults will be clear.
Acknowledgements
A part of this work was supported by JSPS KAKENHI Grant Number 26330093.
References
- Thayer, R. and Dorfman, M. (2000) Software Requirements Engineering. Wiley IEEE Press/Books & eBooks.
- Carver, J.C., Nagappan, N. and Page, A. (2008) The Impact of Educational Background on the E?ectiveness of Requirements Inspections: An Empirical Study. IEEE Transactions on Software Engineering, 34, 800-812. http://dx.doi.org/10.1109/TSE.2008.49�
- Kamatar, J. and Hayes, W. (2000) An Experience Report on the Personal Software Process. IEEE Software, 17, 85-89. http://dx.doi.org/10.1109/52.895173
- Dyba, T. and Dingsoyr, T. (2008) Empirical Studies of Agile Software Development: A Systematic Review. Information and Software Technology, 50, 833-859. http://dx.doi.org/10.1016/j.infsof.2008.01.006
- Stellman, A. and Greene, J. (2005) Applied Software Project Management. O’Reilly Media.
- Sawyer, P., Rayson, P. and Cosh, K. (2005) Shallow Knowledge as an Aid to Deep Understanding in Early Phase Requirements Engineering. IEEE Transactions on Software Engineering, 31, 969-981. http://dx.doi.org/10.1109/TSE.2005.129
- Osada, A., Ozawa, D., Kaiya, H. and Kaijiri, K. (2007) The Role of Domain Knowledge Representation in Requirements Elicitation. Proceeding of the 29th International Conference on Software Engineering (ICSE2007), 84-92.
- Doi, K., Horai, H., Watanabe, I., Katayama, Y. and Sonobe (2003) User-Oriented Requirements Capturing Method in Analyzing Requirements Capturing Meeting Requirements Engineering. Transactions of Information Processing Society of Japan, 44, 48-58.
- Dutoit, A.H. and Bruegge, B. (1998) Communication Metrics for Software Development. IEEE Transactions on Software Engineering, 24, 615-628. http://dx.doi.org/10.1109/32.707697
- d’Astous, P. and Robillard, P.N. (2002) Empirical Study of Exchange Patterns during Software Peer Review Meetings. Information and Software Technology, 44, 639-648. http://dx.doi.org/10.1016/S0950-5849(02)00081-2
- Seaman, C.B. and Basili, V.R. (1998) Communication and Organization: An Empirical Study of Discussion in Inspection Meetings, Software Engineering. IEEE Transactions on Software Engineering, 24, 559-572. http://dx.doi.org/10.1109/32.708569
- Damian, D., Lanubile, F. and Mallardo, T. (2008) On the Need for Mixed Media in Distributed Requirements Negotiations. IEEE Transactions on Software Engineering, 34, 116-132. http://dx.doi.org/10.1109/TSE.2007.70758
- Miyata, A., Hayashi, T., Yamamoto, S., Hayashi, M., Shigeno, H. and Okada, K. (2006) Conference Movie Summarization Assistance Using Mental States and Speech Breakpoints. Transactions of Information Processing Society of Japan, 47, 906-914.
- Miyata, A., Hayashi, T., Yamamoto, S., Hayashi, M., Shigeno, H. and Okada, K. (2007) A Proposal of Indexing Conference Movies with Thinking States, Process. Proceeding of the 5th International Conference on Creating, Connecting and Collaborating through Computing, Kyoto, 24-26 January 2007, 54-61.
- Tomino, T., Inoue, A., Ichimura, S. and Matsushita, Y. (2006) A Speaker Zooming Method for Room-to-Room TV Conference. Transactions of Information Processing Society of Japan, 47, 2091-2098.
- Hanakawa, N., Akazawa, Y., Mori, A., Maeda, T., Inoue, S. and Tsutsui, S. (2006) A Web-Based Integrated Education System for a Seamless Environment among Teachers, Students and Administrators. International Journal of System & Computer in Japan, 37, 14-24.
- Hanakawa, N. and Obana, M. (2010) Mobile Game Terminal Based Interactive Education Environment for Large-Scale Lectures. Proceeding of the 9th IASTED International Conference on Web-Based Education (WBE2010), Sharm El Sheikh, 15-17 March 2010.
- http://www2.hannan-u.ac.jp/p-hint/index.html
- Hanakawa, N. and Obana, M. (2012) A Case Study: A Metrics for Meeting Quality on a Software Requirement Acquisition Phase. Proceedings of the 13th International Conference on Product-Focused Software Process Improvement, (Profes 2012), Madrid, 13-15 June 2012, 260-274.
- Obana, M., Hanakawa, N. and Iida, H. (2011) A Process Complexity-Product Quality (PQPC) Model Based on Process Fragment with Workflow Management Tables. Proceeding of the 12th International Conference on Product-Focused Software Development and Process Improvement (Profes2011), Torre Canne, 20-22 June 2011, 171-185.
- Obana, M., Hanakawa, N., Yoshida, N. and Iida, H. (2010) Process Fragment Based Process Complexity with Workflow Management Tables. Proceeding of the 2nd International Workshop on Empirical Software Engineering in Practice (IWESEP2010), Nara, 7-8 December 2010, 7-12.