Journal of Software Engineering and Applications
Vol.6 No.4A(2013), Article ID:30073,9 pages DOI:10.4236/jsea.2013.64A003
Quantitative Security Evaluation for Software System from Vulnerability Database
![]()
1Department of Information Engineering, Graduate School of Engineering, Hiroshima University, Hiroshima, Japan; 2Japan Ground Self-Defense Force, Kagoshima, Japan.
Email: okamu@rel.hiroshima-u.ac.jp
Copyright © 2013 Hiroyuki Okamura et al. This is an open access article distributed under the Creative Commons Attribution License, which permits unrestricted use, distribution, and reproduction in any medium, provided the original work is properly cited.
Received January 12th, 2013; revised February 16th, 2013; accepted February 27th, 2013
Keywords: Quantitative Security Evaluation; Vulnerability Database; Non-Homogeneous Poisson Process, Contents Management System
ABSTRACT
This paper proposes a quantitative security evaluation for software system from the vulnerability data consisting of discovery date, solution date and exploit publish date based on a stochastic model. More precisely, our model considers a vulnerability life-cycle model and represents the vulnerability discovery process as a non-homogeneous Poisson process. In a numerical example, we show the quantitative measures for contents management system of an open source project.
1. Introduction
From the latter half of 1990s, many security incidents have been reported in enterprise systems and personal computers, such as the denial-of-service attack via computer viruses and the data leak caused by unauthorized accesses.
Generally, most of security incidents are caused by software flaws and bugs called security holes and vulnerabilities. The effective counter measure against security incidents is to validate there is no flaw in the software during design and testing phases. Nowadays, for these purpose, model verification techniques are enhanced to validate the software design. For example, the model checking ensures that the software behaves according to its specification mathematically [1], and several testing techniques are developed to remove software faults as many as possible in the testing phase [2]. However, even if such techniques are applied, it is difficult to remove all the flaws before releasing the software to the market due to external circumstances of software development; development cost, delivery date and unexpected specification changes. For such software systems, a security patching is one of the feasible solutions that do not allow an attacker to exploit vulnerabilities.
A security patch is a small program to fix the software faults causing security holes and vulnerabilities, and is distributed to the end-users through the Internet or other means after the software release. The user can remove a vulnerability by applying a corresponding security patch which is distributed from the vendor. Ideally, the security patch should be distributed whenever one discovers a vulnerability of the software product. However, the development and distribution of security patches incur expenses for the vendor, and a short development time might cause the distribution of a poorly designed patch causing a new problem. Thus, many of the software vendors design a plan to distribute a security patch at a specified period of time, e.g., quarterly distribution, and the patch fixes all the vulnerabilities which have been discovered until the distribution time. On the other hand, from the user perspective, applying a patch involves not only a tedious task but also a risk that the patch causes an error like misconfiguration. Therefore, in practice, users, especially enterprises and firms, also make a plan of what patches are applied at a specified period of time. These strategies for the software patch are called patch management. In [3], Okamura et al. discussed the optimal patch release timing to help the patch management for enterprise based on the stochastic model.
Essentially, it is important to quantify degree of security for the software system to discuss the patch management. In general, there are two perspectives on the quantitative evaluation of security: vendor’s and user’s perspective. From the vendor’s perspective, the risk is that vendor is to release exploitation of a vulnerability before a patch is distributed. On the other hand, users should consider the risk caused by the delay of applying patches as well as the risk of software system itself. In fact, Okamura et al. [4] tried to evaluate the degree of security from user’s perspective by considering user profile of the system. In this paper, we focus on the security risk for vendors.
In the past literature, many researches considered the risk of security in software system from the vendor’s perspective. Wang et al. [5] presented a continuous-time Markov model to evaluate the security in the intrusiontolerant database system. Jonsson et al. [6] discussed the security model based on the analysis of attacker’s behavior. In these papers, they considered the quantitative security for specific systems and it cannot always be applied to any kind of software system. Also Kimura [7] proposed a stochastic model, which is similar to the classical software reliability growth model, and presented a quantitative evaluation for the security of software system. His method focused on the vulnerability discovery process only and therefore it can be applied to many kinds of software system. However, the model derived in [7] is essentially equivalent to testing-domain dependent software reliability growth model [8]. Thus, it cannot represent a variety of patterns for the vulnerability discovery process.
In this paper, we refine the quantitative software security model based on the vulnerability discovery process by using general distributions. Although the model presented here does not exactly include the model in [7], we adopt the similar situation where vendors and attackers compete to make a patch and to find an exploit. In addition, we present an illustrative example of the quantitative security evaluation of contents management system from the vulnerability data.
The rest of this paper is organized as follows. In Section 2, we describe the vulnerability model with respect to its discovery process. Section 3 presents the formulation of a quantitative security measure based on the vulnerability discovery process, patch release distribution and exploitation time distribution. Section 4 is devoted to the experiment for our quantitative security evaluation based on the vulnerability data.
2. Vulnerability Discovery Model
2.1. Vulnerability Life Cycle
Vulnerability is defined as a fault on system requirements or a program that allows an attacker to violate the system integrity. A vulnerability is often caused by flaws on software requirements as well as software bugs, and thus it is more difficult to find vulnerabilities by software testing than to detect usual software bugs.
Arbaugh et al. [9] presented a vulnerability life-cycle model which consists of the following seven states:
• Birth: The birth of a vulnerability, strictly speaking a flaw, occurs at software requirement or software design.
• Discovery: Someone discovers a flaw on software security, and then the flaw becomes a vulnerability.
• Disclosure: The vulnerability is disclosed when the discoverer reveals details of the problem.
• Correction: The vulnerability is correctable by developing and releasing a security patch.
• Publicity: The vulnerability and its problem become known by disclosing them to public medias.
• Scripting: An exploitation of the vulnerability is released. In this state, crackers with little or no skill can exploit the vulnerability to violate the integrity of system.
• Death: The vulnerability dies when one applies a security patch to all the vulnerable systems.
Figure 1 illustrates the state transition of a typical vulnerability in the life-cycle model.
2.2. Vulnerability Discovery Process
In the vulnerability life cycle, we focus on the discovery and disclosure states. In general, the software vendor begins to take a counteraction against a vulnerability after discovering the vulnerability in the software operation phase. That is, the number of discovered vulnerabilities is a significant measure to determine a security strategy of the vendor.
To describe the vulnerability discovery process, we make the following assumptions:
• (A-1) The software has a finite number of vulnerabilities to be discovered.
• (A-2) The time to discover a vulnerability is stochastically distributed, and all the times are mutually independent random variables.
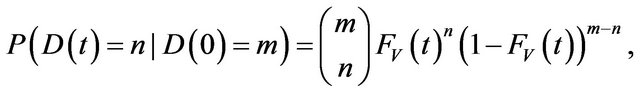
Under the above assumptions, we model the number of discovered vulnerabilities at time t, D (t), as follows.
 (1)
(1)
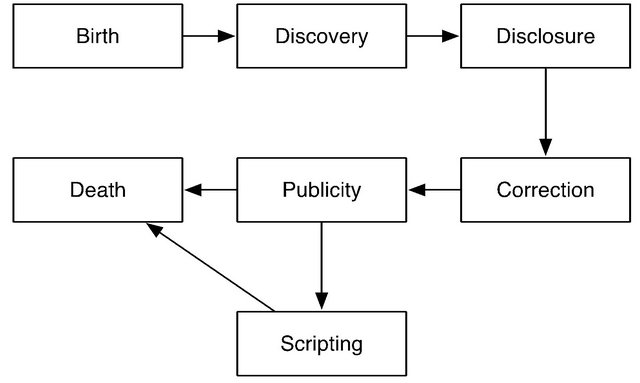
Figure 1. A typical state transition in a vulnerability lifecycle model.
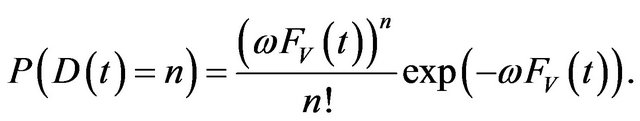
where m is the total number of undiscovered vulnerabilities at time t = 0 and FV (t) is a cumulative distribution function (c.d.f.) of the discovery time for a vulnerability. In addition, when the total number of undiscovered vulnerabilities follows a Poisson distribution with mean w, the probability mass function (p.m.f.) of D (t) is given by
 (2)
(2)
Equation (2) equals the p.m.f. of non-homogeneous Poisson process (NHPP) with the mean value function . This framework is essentially same as NHPPbased software reliability models (SRMs) [10,11]. Thus, by applying well-known statistical distributions to FV (t), we can obtain the vulnerability-discovery processes which correspond to several existing NHPP-based SRMs. For example, when FV (t) is a truncated logistic distribution, the corresponding NHPP-based vulnerability discovery model equals an inflection S-shaped model [12,13]. The inflection S-shaped model has almost same representation ability as the vulnerability discovery model proposed by [14-17], since both models draw a logistic curve as the expected number of discovered vulnerabilities.
3. Security Evaluation Model
From vendor’s perspective, the security path to fix the vulnerability should be distributed before the exploitation of it is released. That is, for the vulnerability life cycle, the state should be Death before Scripting. However, as seen in zero-day virus, the patch distribution is often delayed before releasing the exploitation. In addition, if a large number of vulnerabilities are discovered just after the release of software product, there is an increased risk of exploiting the vulnerabilities by malicious users. This is clearly the risk for the vendor.
To evaluate the vendor’s risk, let TD and TS be the random times for distributing the security path of a vulnerability and releasing the exploitation of it, respectively, just after the vulnerability is discovered. Also, we assume that TD and TS have respective c.d.f.’s FD (t) = P (TD ≤ t) and FS (t) = P (TS ≥ t), and FS (t) is allowed to be defective, i.e., it is not always FS (∞) = 1. This means that there exists a probability that the vulnerability cannot be exploited for malicious attacks.
Let S(t) be the number of vulnerabilities whose exploitation is released before the patch is distributed. Then the process S(t) can be analyzed by similar way to Mt/G/∞ queueing process with two different competitive services. Since the number of discovered vulnerabilities is described by an NHPP, we have
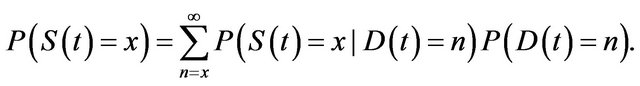 (3)
(3)
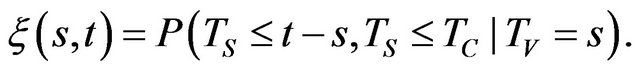
Next we focus on the probability that the exploitation of a vulnerability is released before time t, provided that the vulnerability is discovered at TV = s (≥ t). The probability can be derived by the conditional probabilities on whether the patch is distributed before time t or not. The probability in the case where the patch is released before time t is given by
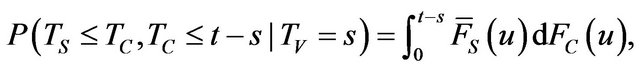 (4)
(4)
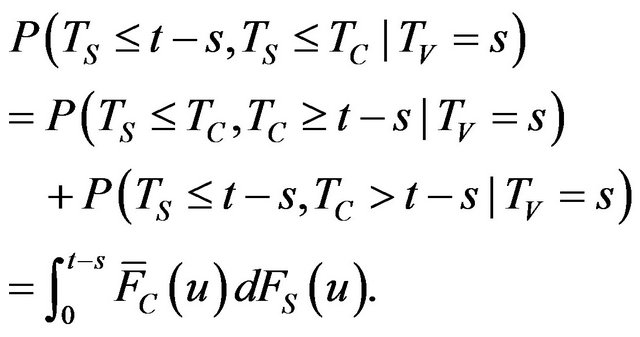
where in general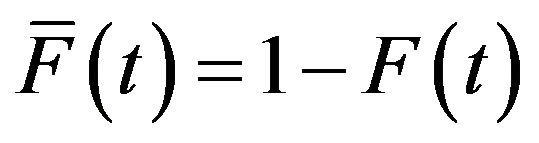 . Also, the probability in the case where the patch is not released before time t is
 (5)
(5)
Therefore, we have the conditional probability that the exploitation of a vulnerability is released before time t provided that the vulnerability is discovered at s as follows.
 (6)
(6)
According to the argument of Mt/G/∞ process [18], we obtain
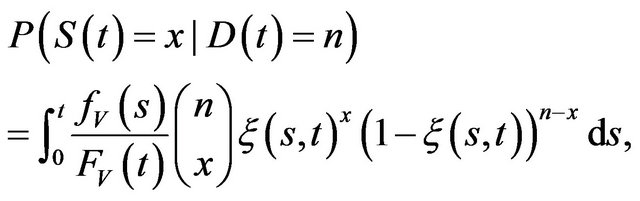 (7)
(7)
where 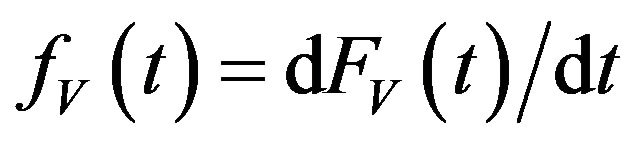 and
and
 (8)
(8)
Substituting Equation (7) into Equation (3) yields
 (9)
(9)
where
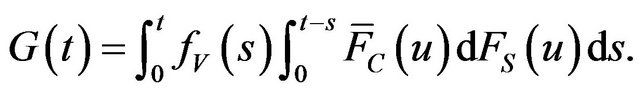 (10)
(10)
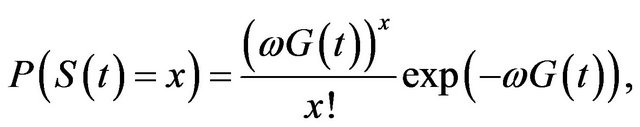
That is, the number of vulnerabilities whose exploitation is released before the patch distribution also become an NHPP with mean value function .
.
Based on the NHPP, we define the quantitative software security function from vendor’s perspective as the probability that there is no vulnerability whose exploitation is released before a patch during time interval [s, t + s):
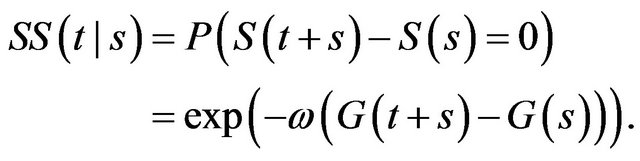 (11)
(11)
4. Numerical Example
In this section, we present quantitative security evaluation for a contents management system (CMS), which manages Web sites with graphical user interface. Since the vulnerability of CMS is exploited for altering Web site from the outside, the security evaluation of CMS is significant issue. In particular, we focus on two different versions of Joomla project1, which is a CMS developed as an open source project.
From the open source vulnerability database (OSVDB)2, we collect the vulnerabilities for Joomla 1.5.x and 2.5.x. Tables 1 and 2 present the vulnerability data for Joomla 1.5.x and 2.5.x recorded in OSVDB. The the columns Informed, Solution and Exploit Publish indicate the date when the vendor informs the vulnerability, the patch is distributed, and the exploit of the vulnerability is released. If informed or solution date is missed, we fill it as the disclosure date in the database.
Based on the vulnerability data, we first determine the vulnerability discovery process from the vendor informed date. That is, the vendor informed date is regarded as the discovery date of vulnerability. In the experiment, since the vulnerability discovery process is essentially same as the software reliability growth model, we apply the candidates presented in Table 3 as representative models. In addition, efficient ML estimation algorithms
Table 1. Vulnerability data for Joomla 1.5.x in OSVDB.
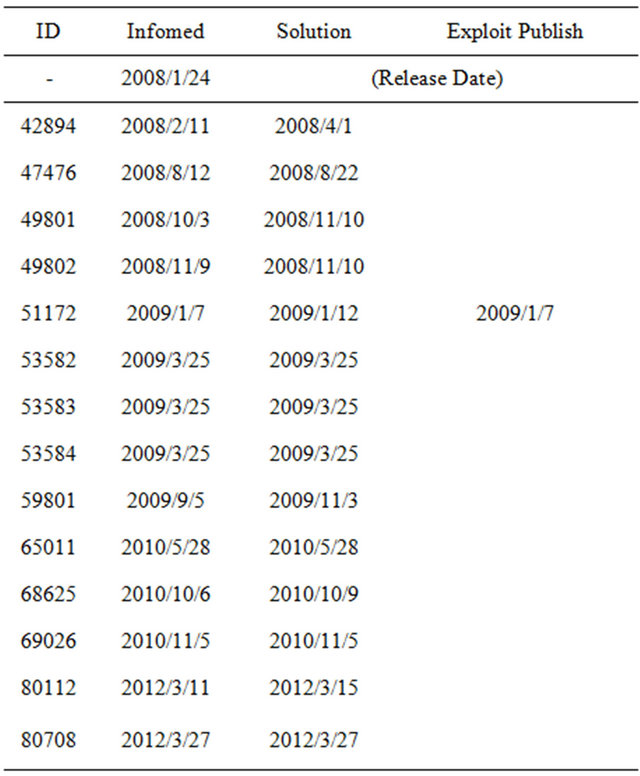
Table 2. Vulnerability data for Joomla 2.5.x in OSVDB.
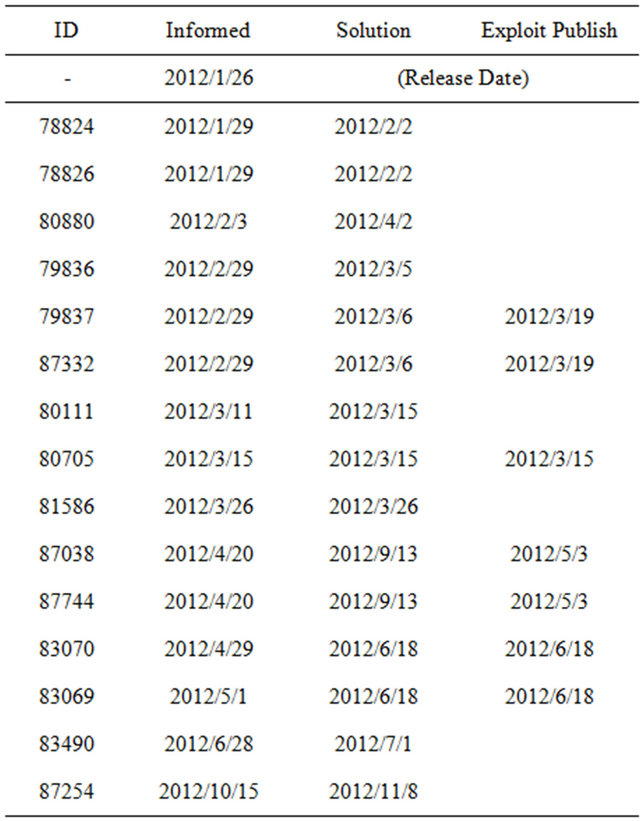
Table 3. Candidates of vulnerability discovery model.
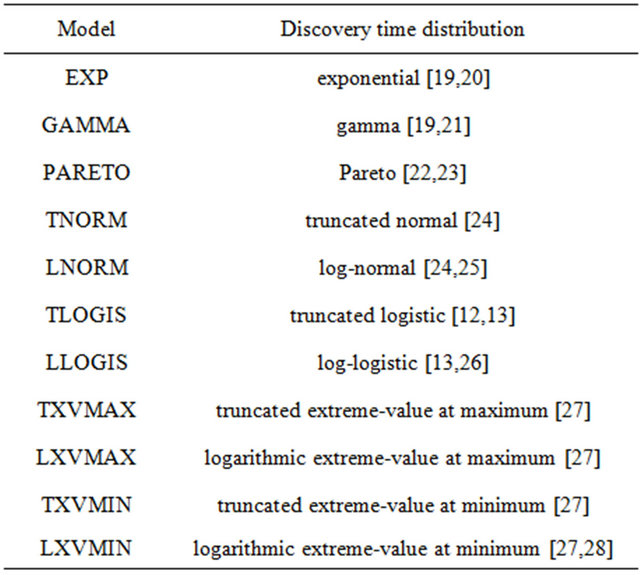
based on the EM algorithm have been developed for all the models [13,19,27,29]. Furthermore, the model selection is performed by AIC (Akaike information criterion) [30], which is defined by
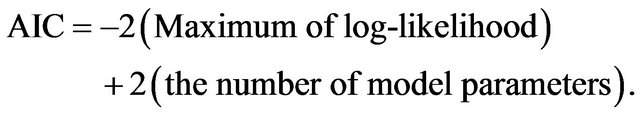 (12)
(12)
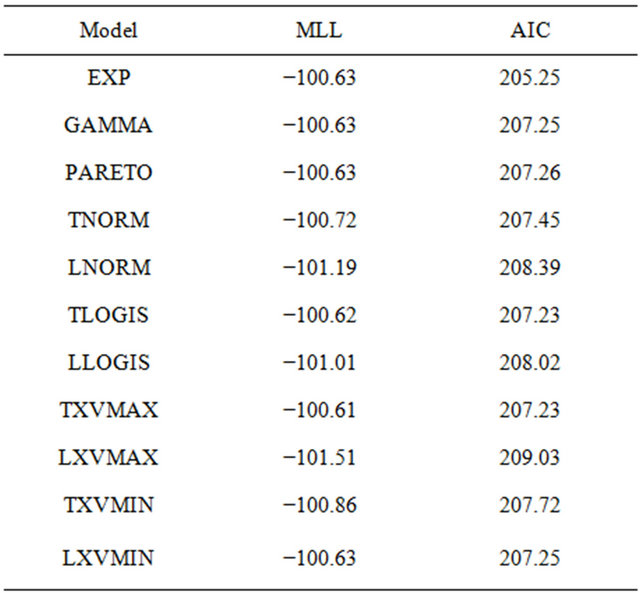
According to the argument of information criterion, the model with smaller AIC is better fitting to the observed data. Table 4 shows the maximum log-likelihood (MLL) and AIC for all the candidates in the vulnerability of Joomla 1.5.x. Similarly, Table 5 indicates the results of Joomla 2.5.x.
From these tables, it can seen that EXP is the best to represent the vulnerability discovery processes in both Joomla 1.5.x and 2.5.x. Figures 2 and 3 depict the cumulative number of vulnerabilities of Joomla 1.5.x and 2.5.x from their release date. The figures include the mean value functions of EXP models fitting to the observe data. The current date is 2013/1/11. From the figures, we find that the vulnerability discovery of Joomla 1.5.x has not converged yet. In contrast, the vulnerability discovery of Joomla 2.5.x almost converges. In fact, the
Table 4. MLL and AIC of candidates for Joomla 1.5.x.
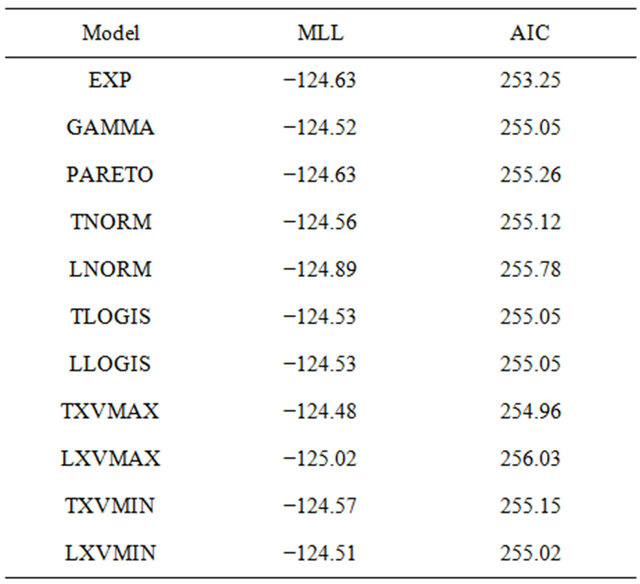
Table 5. MLL and AIC of candidates for Joomla 2.5.x.
expected number of residual vulnerabilities are 2.41 in Joomla 1.5.x and 0.12 in Joomla 2.5.x.
We estimate the distribution of patch release timing from the data. The means (variances) of patch distribution are 13.1 days (424.0 days2) in Joomla 1.5.x and 34.7 days (2474.7 days2) in Joomla 2.5.x. Since the variances are large, we cannot utilize the several well-known distributions such as normal distribution. To simplify the argument of distribution selection, this paper applies the phase-type (PH) distributions to represent for patch distribution.
The PH distribution is defined by the absorbing time in a continuous-time Markov chain consisting of several transient states and one absorbing state. It can approximate any distribution with any precision. That is, by using the PH distribution, we can reduce the problem of distribution selection into the parameter estimation of PH distribution. In addition, efficient algorithm for sample-based estimation of PH distribution has been proposed in [31]. Figure 4 illustrates estimated density function of patch distributions for Joomla 1.5.x and 2.5.x. The numbers of phases are 13 and 12 in Joomla 1.5.x and 2.5.x, respectively, which are determined by the phase orders [32]. Both distributions have two modes around 1 and 5 days. However, since the tails of distributions are long, the means (variances) of estimated PH distributions are 13.1 days (642.9 days2) in Joomla 1.5.x and 34.7 days (3380.0 days2).
Next we determine the distribution of exploitation based on the exploit publish date. However, in the tables, vulnerabilities are not always exploited for a malicious attack, and exploitation of several of vulnerabilities has not been discovered. Also, the number of vulnerabilities whose exploitation is released is too small to determine the distribution form. Thus in the paper, we assume that the distribution of exploitation is given by the following exponential-type distribution.
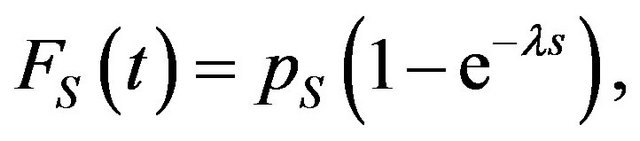 (13)
(13)
where pS is the probability that the exploitation of the vulnerability exists and λ is the exploitation rate provided that there exists the exploitation of the vulnerability. The probability pS can be estimated as the fraction of the number of vulnerabilities whose exploitation exists over the total number of vulnerabilities. Then we have pS = 1/14 in Joomla 1.5.x and pS = 7/15 in Joomla 2.5.x. Also, the exploitation rates are given by the reciprocal number of mean time to exploit, namely, 1/λ = 1 (day) in Joomla 1.5.x and 1/λ = 24.1 (days) in Joomla 2.5.x.
Since FV(t) and FS(t) are exponential distributions and FD(t) is PH distribution, Equation (10) can be expressed as a matrix exponential form. Based on G(t) in Joomla 1.5.x and 2.5.x, we can evaluate quantitative measures for security. Figure 5 illustrates the quantitative software
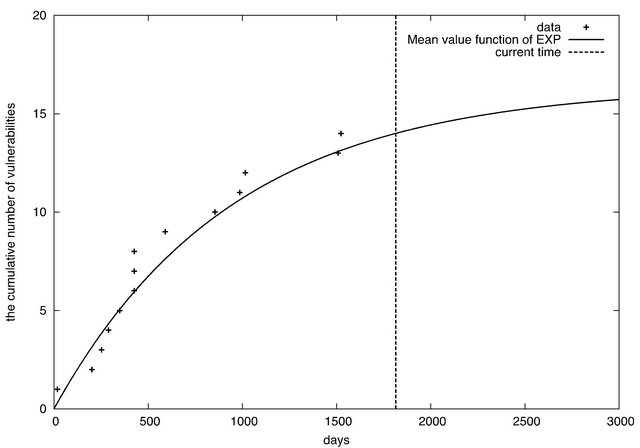
Figure 2. The cumulative number of vulnerabilities in Joomla 1.5.x.
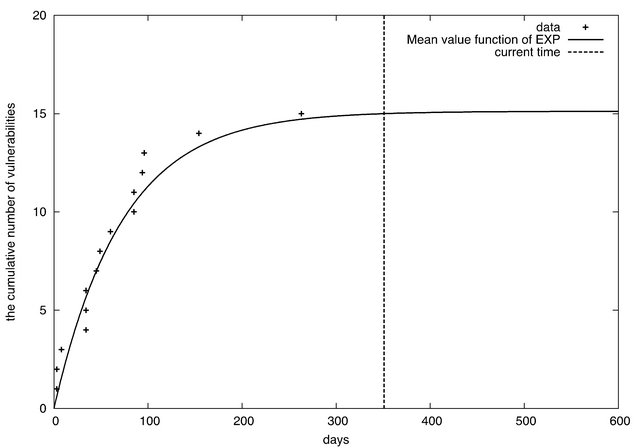
Figure 3. The cumulative number of vulnerabilities in Joomla 2.5.x.
security functions of Joomla 1.5.x and 2.5.x given by Equation (11) from their release date, i.e., SS(t|0). Also Figure 6 indicates the software security functions of Joomla 1.5.x and 2.5.x from their current date. As seen in Figure 5, the quantitative software security of Joomla 1.5.x is higher than that of Joomla 2.5.x after their re-
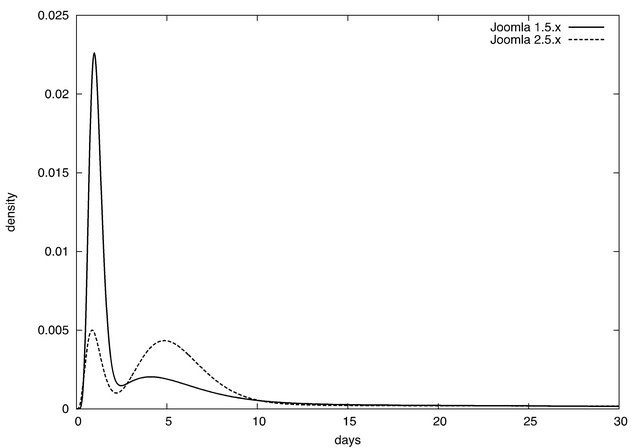
Figure 4. Estimated patch distributions.
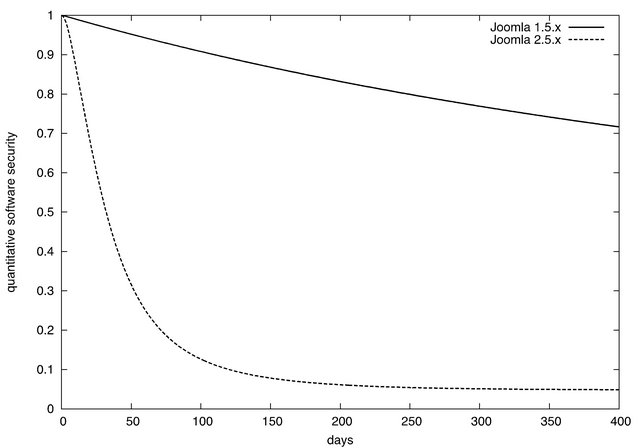
Figure 5. Quantitative software security functions from release date.
leases. This is caused by two factors: the first is to find the greater number of vulnerabilities of Joomla 2.5.x in early phase just after the release, and the second is there are a greater number of vulnerabilities whose exploitation are released in Joomla 2.5.x. On the other hand, the quantitative software security functions from the current
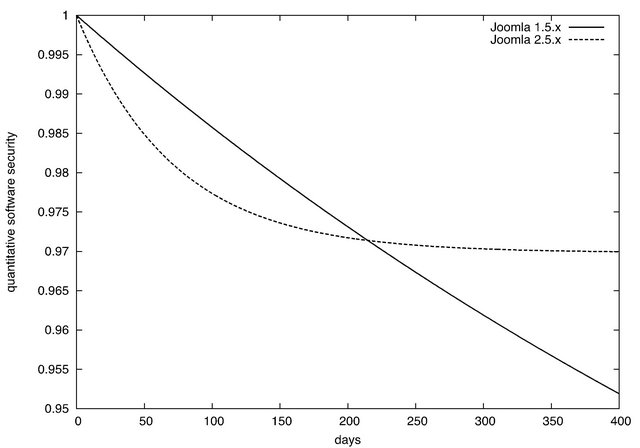
Figure 6. Quantitative software security functions from current date.
date in Figure 6 have different tendency from those from the release date in Figure 5. The quantitative software security of Joomla 2.5.x is marked by the convergence to a certain level. In the case where the operation during over 200 days, Joomla 2.5.x is more secure than Joomla 1.5.x. However, in early phase, Joomla 1.5.x is still secure, compared to Joomla 2.5.x. This is because the number of vulnerabilities of Joomla 2.5.x is almost converged at the current date as shown in Figure 3, though the vulnerabilities of Joomla 1.5.x are expected to remain even at the current date. This result suggests that Joomla 1.5.x is more secure at the current date, but it should be replaced with Joomla 2.5.x around 200 days after from the viewpoint of security.
5. Conclusions
This paper has presented a quantitative security evaluation for software system from vendor’s perspective. Concretely, we have proposed a general method to quantify the degree of security from the vulnerability database. The concept of our approach is similar to the software reliability growth models, and the advantage of our method is the applicability, namely, our method can be applied to any kind of software system if its vulnerability data can be obtained. In the numerical example, we have illustrated how to evaluate the software by using the vulnerability data for CMS.
In future, we will try to perform the experiments for other types of software system and comprehensively compare quantitative software security functions. In addition, we will derive the security measure from the user perspective based on the proposed model.
6. Acknowledgements
This research was supported by the Ministry of Education, Science, Sports and Culture, Grant-in-Aid for Scientific Research (C), Grant No. 23500047 (2011-2013) and Grant No. 23510171 (2011-2013).
REFERENCES
- E. M. Clarke Jr., O. Grumberg and D. A. Peled, “Model Checking,” MIT Press, Cambridge, 1999.
- G. J. Myers and C. Sandler, “The Art of Software Testing,” John Wiley & Sons, Hoboken, 2004.
- H. Okamura, M. Tokuzane and T. Dohi, “Optimal Security Patch Release Timing under Non-Homogeneous Vulnerability-Discovery Processes,” Proceedings of 20th International Symposium on Software Reliability Engineering (ISSRE’09), Mysuru, 16-19 November 2009, pp. 120- 128.
- H. Okamura, M. Tokuzane and T. Dohi, “Security Evaluation for Software System with Vulnerability Life Cycleand User Profiles,” Proceedings of 2012 Workshop on Dependable Transportation/Recent Advances in Software Dependability (WDTS-RASD 2012), Niigata, 18-19 November 2012, pp. 39-44.
- H. Wang and P. Liu, “Modeling and Evaluating the Survivability of an Intrusion Tolerant Database System,” ESORICS 2006, LNCS 4189, Hamburg, 18-20 September 2006, pp. 207-224.
- E. Jonsson and T. Olovsson, “A Quantitative Model of the Security Intrusion Process Based Onattacker Behavior,” IEEE Transactions on Software Engineering, Vol. 23, No. 4, 1997, pp. 235-245. doi:10.1109/32.588541
- M. Kimura, “A Study on Software Vulnerability Assessment Modeling and Its Application to E-Mail Distribution Software System,” The Journal of Reliability Engineering Association of Japan (Japanese), Vol. 25, No. 3, 2003, pp. 279-283.
- T. Fujiwara and S. Yamada, “Testing-Domain Dependent Software Reliability Growth Models and Their Comparisons of Goodness-of-Fit,” Proceedings of the 7th ISSAT International Conference on Reliability and Quality in Design, Washington DC, 8-10 August 2001, pp. 36-40.
- W. A. Arbaugh, W. L. Fithen and J. McHugh “`Windows of Vulnerability: A Case Study Analysis,” IEEE Computer, Vol. 33, No. 12, 2000, pp. 52-59. doi:10.1109/2.889093
- J. D. Musa, “Software Reliability Engineering,” McGrawHill, New York, 1999.
- M. R. Lyu, “Handbook of Software Reliability Engineering,” McGraw-Hill, New York, 1996.
- M. Ohba, “Inflection S-Shaped Software Reliability Growth Model,” In: S. Osaki and Y. Hatoyama, Eds., Stochastic Models in Reliability Theory, Springer-Varlag, Berlin, 1984, pp. 144-165. doi:10.1007/978-3-642-45587-2_10
- H. Okamura, T. Dohi and S. Osaki, “EM Algorithms for Logistic Software Reliability Models,” Proceedings of 7th IASTED International Conference on Software Engineering, Innsbruck, 17-19 February 2004, pp. 14-22.
- O. H. Alhazmi and Y. K. Malaiya, “Application of Vulnerability Discovery Models to Major Operating Systems,” IEEE Transactions on Reliability, Vol. 57, No. 1, 2008, pp. 14-22. doi:10.1109/TR.2008.916872
- O. H. Alhazmi and Y. K. Malaiya, “Measuring and Enhancing Prediction Capabilities of Vulnerability Discovery Models for Apache and IIS HTTP Servers,” Proceedings of 17th International Symposium on Software Reliability Engineering, Raleigh, 7-10 November 2006, pp. 343-352.
- S.-W. Woo, O. H. Alhazmi and Y. K. Malaiya, “Assessing Vulnerabilities in Apache and IIS HTTP Servers,” Proceedings of 2nd IEEE International Symposium on Dependable, Autonomic and Secure Computing, Indianapolis, 29 September-1 October 2006, pp. 103-110.
- O. H. Alhazmi and Y. K. Malaiya, “Modeling the Vulnerability Discovery Process,” Proceedings of 16th International Symposium on Software Reliability Engineering, Chicago, 8-11 November 2005, pp. 129-138.
- H. Tijms, “A First Course in Stochastic Models,” John Wiley & Sons, Hoboken, 2003. doi:10.1002/047001363X
- H. Okamura, Y. Watanabe and T. Dohi, “An Iterative Scheme for Maximum Likelihood Estimation in Software Reliability Modeling,” Proceedings of 14th International Symposium on Software Reliability Engineering, Denver, 17-20 November 2003, pp. 246-256.
- H. Okamura, A. Murayama and T. Dohi, “EM Algorithm for Discrete Software Reliability Models: A Unified Parameter Estimation Method,” Proceedings of 8th IEEE International Symposium on High Assurance Systems Engineering, Tampa, 25-26 March 2004, pp. 219-228.
- K. Ohishi, H. Okamura and T. Dohi, “Gompertz Software Reliability Model: Estimation Algorithm and Empirical Validation,” Journal of Systems and Software, Vol. 82, No. 3, 2009, pp. 535-543. doi:10.1016/j.jss.2008.11.840
- H. Akaike, “Information Theory and an Extension of the Maximum Likelihood Principle,” Proceedings of 2nd International Symposium on Information Theory, 1973, pp. 267-281.
- A. L. Goel and K. Okumoto, “Time-Dependent ErrorDetection Rate Model for Software Reliability and Other Performance Measures,” IEEE Transactions on Reliability, Vol. R-28, No. 3, 1979, pp. 206-211. doi:10.1109/TR.1979.5220566
- S. Yamada, M. Ohba and S. Osaki, “S-Shaped Reliability Growth Modeling for Software Error Detection,” IEEE Transactions on Reliability, Vol. R-32, No. 5, 1983, pp. 475-478. doi:10.1109/TR.1983.5221735
- B. Littlewood, “Rationale for a Modified Duane Model,” IEEE Transactions on Reliability, Vol. R-33, No. 2, 1984, pp. 157-159. doi:10.1109/TR.1984.5221762
- H. Okamura, Y. Watanabe and T. Dohi, “Estimating Mixed Software Reliability Models Based on the EM Algorithms,” Proceedings of 2002 International Symposium on Empirical Software Engineering, Napa, 3-4 October 2002, pp. 69-78.
- H. Okamura, T. Dohi and S. Osaki, “Software Reliability Growth Models with Normal Failure Time Distributions,” Reliability Engineering and System Safety, 2013 (in Press).
- J. A. Achcar, D. K. Dey and M. Niverthi, “A Bayesian Approach Using Nonhomogeneous Poisson Processes for Software Reliability Models,” In: A. P. Basu, K. S. Basu and S. Mukhopadhyay, Eds., Frontiers in Reliability, World Scientific, Singapore City, 1998, pp. 1-18.
- S. S. Gokhale and K. S. Trivedi, “Log-Logistic Software Reliability Growth Model,” Proceedings of 3rd IEEE International High-Assurance Systems Engineering Symposium, Washington DC, 13-14 November 1998, pp. 34-41.
- A. L. Goel, “Software Reliability Models: Assumptions, Limitations and Applicability,” IEEE Transactions on Software Engineering, Vol. SE-11, No. 12, 1985, pp. 1411- 1423. doi:10.1109/TSE.1985.232177
- H. Okamura, T. Dohi and K. S. Trivedi, “A Refined EM Algorithm for PH Distributions,” Performance Evaluation, Vol. 68, No. 10, 2011, pp. 938-954. doi:10.1016/j.peva.2011.04.001
- Q.-M. He and H. Zhang, “On Matrix Exponential Distributions,” Advances in Applied Probability, Vol. 39, No. 1, 2007, pp. 271-292. doi:10.1239/aap/1175266478
NOTES
1http://http://www.joomla.org/. 2http://http://www.osvdb.org/.