Journal of Software Engineering and Applications
Vol. 5 No. 6 (2012) , Article ID: 19838 , 10 pages DOI:10.4236/jsea.2012.56045
A Semi-Automation of a Cost Benefit Analysis Method
![]()
Department of Computer Science, California State University Sacramento, Sacramento, USA.
Email: darvillelm@comcast.net, zhangc@ecs.csus.edu
Received February 13th, 2012; revised March 8th, 2012; accepted March 17th, 2012
Keywords: Software Architecture; CBAM; ATAM; Non-Functional Requirements
ABSTRACT
This paper presents CBAM Assistant, a tool that semi-automates the Cost Benefit Analysis Method (CBAM) developed by the Software Engineering Institute (SEI) at Carnegie Mellon University. CBAM is a process used to estimate the Return on Investment (ROI) of various software architectural design strategies. CBAM generally follows the Architectural Trade-off Analysis Method (ATAM) also developed by SEI. ATAM aids in defining scenarios and architectural strategies. The result is a qualitative trade-off analysis of the various strategies. CBAM further refines the scenarios and architectural strategies from ATAM. CBAM aids in quantitative analysis for cost, utility and importance ratings to determine the ROI of each architectural strategy. CBAM Assistant is a web-based system that walks a user through the CBAM process which can be started by using scenarios and architectural strategies created from ATAM. The tool is intended to be used by a facilitator who will provide input from stakeholders. The primary output of the tool is the ROIs of each architectural strategy for comparison and selection.
1. Introduction
Getting a software application development completed on time, within budget with all functional and non-functional requirements originally specified has been a challenge and sometimes impossible. This issue often arises because requirements are not completely understood early enough in the development process. Non-functional requirements are often inadequately specified. As a result, many software architecture designs do not efficiently support the business needs.
As systems become larger and more complicated, the need for a structured development process becomes crucial. The right software architecture design can help improve timing of system updates, modifications and cost. To help developers determine the best architecture design for their business needs, especially the non-functional requirements such as performance, availability, security, etc., the Software Engineering Institute (SEI) at Carnegie Mellon University developed Architecture Trade-Off Analysis Method (ATAM) [1] and Cost Benefit Analysis Method (CBAM)) [1,2]. CBAM generally follows ATAM that aids in defining scenarios for nonfunctional requirements specification and analyzing architectural strategies. The result of ATAM is a qualitative trade-off analysis of the various design strategies. CBAM further refines the scenarios and architectural design strategies from ATAM. CBAM aids in quantitative analysis for cost, utility and importance ratings to determine the ROI of each architectural design strategy. These architecture centric methods can improve the quality of software systems. However, using these methods requires having access to an expert of the methods. Manually practicing these processes can be time consuming. Thus, it is desirable to have tool support for these methods.
This paper presents CBAM Assistant, a web-based semi-automation of the CBAM process. As a quantitative method, CBAM has its great value for software architecture design analysis. The development of CBAM Assistant aims at facilitating the application of CBAM so it can be widely used. CBAM Assistant walks a user through the CBAM process which can be started by using scenarios and architectural strategies created from ATAM. This tool is intended to be used by a facilitator who will provide input from stakeholders. The primary output of the tool is the ROIs of each architectural design strategy for comparison and selection.
2. Background and Related Work
2.1. ATAM
ATAM is a nine-step, four-phase process in which the stakeholders define scenarios to specify the non-functional requirements for software architecture design. Quality attribute scenario specifications provide a quantifiable requirement for quality attributes (performance, availability, modifiability, usability, security, etc.). The stakeholders prioritize the scenarios, identify and evaluate architectural approaches.
ATAM also identifies trade-offs and risks in software architecture designs. For example as a system becomes more secure, the availability of the system may have to decrease. The trade-off points are identified for scenarios that affect other quality attributes as a side effect.
The output of ATAM includes: scenarios, mapping of architectural decisions to the scenarios, list of sensitivity and trade-off points and a list of risks and non-risks. While ATAM provides the developer with guidance to which architectural strategies would best suit the business needs, it does not incorporate the economic impact of these strategies. This is where CBAM can be effective.
2.2. CBAM
CBAM uses the output from ATAM as a starting point. It can be used independently from ATAM. CBAM helps to ensure that non-functional requirements or quality attributes are fully stated. CBAM elicits and documents the benefit (or utility) and cost associated with each architectural strategy defined. The cost of implementing each architectural strategy is also gathered from the stakeholders and then analyzed. The output from CBAM summarizes the ROI (Return On Investment) for each architectural strategy in consideration. ROI is calculated to show which strategy yields the most benefit. CBAM helps the developers choose the architecture design that will yield the best return on investment for the software system. There are few techniques found that incorporate the economic impact into software architecture analysis.
CBAM is an incremental nine-step process. First, stakeholders define, refine and further prioritize scenarios. The top 1/3 scenarios are selected based on priorities established. In Step 2 stakeholders define the response goals for the best, worst, current and desired cases for the selected scenarios. In Step 3 the stakeholders vote on each of the selected scenarios considering the expected response goals. 100 votes in total are allocated by the stakeholders. The votes are used to rank the priority of each scenario. The scenario with the most votes has the highest priority. Step 4 uses the top 50% of the scenarios from Step 3 based on votes (i.e. top 1/6 of the total). In Step 4, stakeholders assign a utility rating to each response goal (best, worst, current and desired) for the selected scenarios.
In Step 5 stakeholders develop or review architectural strategies for the top 1/6 scenarios. A cost is assigned to each architectural strategy. The scenarios impacted by the strategy must also be defined. In Step 6, the stakeholders determine the expected response goals and utility rates for each scenario and architectural strategy.
The benefit is calculated in Step 7. The benefit for each architectural strategy is based on the current utility rating and expected utility rating for each scenario impacted by the strategy. The benefit (b) for a given scenario (i) based on strategy (j) is calculated bij = Uexpected – Ucurrent. Uexpected is the utility expected if the scenario is implemented and Ucurrent is the current utility.
The total benefit for the strategy is the sum of the weighted benefit for each scenario impacted by that strategy. The weight (wi) of a scenario is based on votes. The total benefit (bj) for an architectural strategy is the sum of the weighted benefit for each scenario impacted by the strategy or  where wi is the weighting for scenario i. The ROI is the ratio of total benefit for an architectural strategy divided by the estimated cost of implementing the strategy.
The output of CBAM is the ROI for each strategy being compared. The output also includes a list of architectural strategies with their expected utility and total benefit. In Step 8, the developer uses CBAM output to determine the architectural strategies that best suits the business needs. In Step 9, the developer must confirm results based on experience and intuition. For example if a costly strategy that the developer expected to have lower benefit, is returned with the best ROI, the developer may need to review prior steps for accuracy and revisions may be required. The user can run an updated report and review again.
2.3. CBAM and ATAM Integrated
SEI also developed an integrated method for ATAM and CBAM [3]. This method optimized the steps if both ATAM and CBAM are going to be performed. The integrated process further differentiates between new architecture and changes to existing architecture. The process is intended to save stakeholders time and to be more precise than doing ATAM and CBAM separately.
2.4. ATAM Assistant
ATAM Assistant [4] is a tool developed to semi-automate the ATAM process. ATAM Assistant is a desktop tool that walks a user through the various phases of the ATAM process. The ATAM Assistant tool provides output including architectural approaches discovered, scenarios defined, votes and priorities for scenarios. This output can be used as inputs for CBAM Assistant. The tools are not fully integrated at this time and a user must manually enter inputs into CBAM Assistant, but this can be automated. CBAM Assistant also requires additional information to calculate the ROI of each architectural strategy.
2.5. Other Methods
Other methods for evaluating software architecture include: Software Architecture Analysis Method (SAAM) [5], Software Architecture Analysis Method Founded on Complex Scenarios (SAAMCS) [6], Software Architecture Analysis Method for Evolution and Reusability (SAAMER) [7], Scenario-Based Architecture Reengineering (SBAR) [8], Extending SAAM by Integration in the Domain (ESAAMI) [9], Architecture Level Prediction of Software Maintenance (ALPSM) [10] and Software Evaluation Model (SAEM) [11].
SAAM is a five-step method to analyze software architecture. SAAM evaluates impact of architecture on each scenario. The result of SAAM is an evaluation of how well each architectural design supports various tasks. SAAMCS is a risk assessment. The output of SAAMCS shows various factors that indicate the number of components affected, how complicated maintenance will be and a conflict rating. SAAMER builds on SAAM. SAMMER evaluates the evolution and reusability of architecture. SAAMER determines the cost of an architecture, where the cost in terms of effort required for change. SBAR determines the most efficient use of an architecture design to achieve quality attribute goals. ESAAMI expands SAAM to focus on reuse within the specified domain. ALPSM analyzes maintainability and SAEM predicts system quality.
Some methods evaluate specific quality attributes. SAAM, ESAAMI and ALSPSM evaluate modifiability [12]. SAAMCS evaluates flexibility. SAAMER evaluates evolution and reusability and SAEM evaluates overall quality. CBAM varies from these methods by evaluating multiple architectural strategies and quality attributes. ATAM & SBAR evaluate multiple quality attributes and architectural designs but provide qualitative results where CBAM is quantitative. CBAM also includes an economic impact which is not considered in the other methods.
3. Design and Implementation
3.1. Architecture
CBAM Assistant walks a user through the CBAM process which can be started by using non-functional requirement scenarios and architectural strategies created from ATAM. The tool takes inputs from stakeholders during the process, performs quantitative architectural analysis, and generates reports primarily showing the ROIs of each architectural design strategy for comparison and selection.
Model-View-Controller (MVC) architecture pattern was chosen for the CBAM Assistant application. MVC separates concerns so that one can change the design of a web page without changing the data content of the page. This is done within the views. The models get the data content to be displayed. Queries in the models can be modified without affecting the web page, as long as the components do not change. The business logic is contained within the controller. The project is intended to be available for future enhancements. The architecture allows other programmers to work on a single component without having knowledge of the entire system.
CBAM Assistant is built in Microsoft’s ASP.NET 4.0 using MVC 3 (Model-View-Controller). ASP.NET is part of Microsoft Visual Studio (2010) which is integrated with SQL Server Express (10.0.1600). Data classes and relationships are managed by Linq to SQL which is part of the Visual Studio package. The framework provides a lot of built in functionality for routing, user authentication and validation. The project can be easily modified and is available to developers for future enhancements.
In MVC, the model defines the data components (view models), data repositories and validation needed for each view. The controller contains the business logic. The controller uses the view models and repositories to send information to the view. The view simply displays the data. The view expects information in the form of some view model object.
As shown in Figure 1, the CBAM Assistant architecture consists of the CBAM database, CBAM data classes, models (view models and repositories), the controllers and views. NPOI is an open source Apache project that facilitates generating Microsoft Excel reports for the user [13]. The CBAM data classes are abstractions of the database. Users do not directly access the database. The CBAM models contain data repositories and data views which describe data components available for use in each view. For example, if a user clicks on “Create Scenario” in the scenario view, the request goes to the scenario controller. The controller then gets information such as project name and project ID from the model repository then returns the scenario view model to be displayed. The view describes
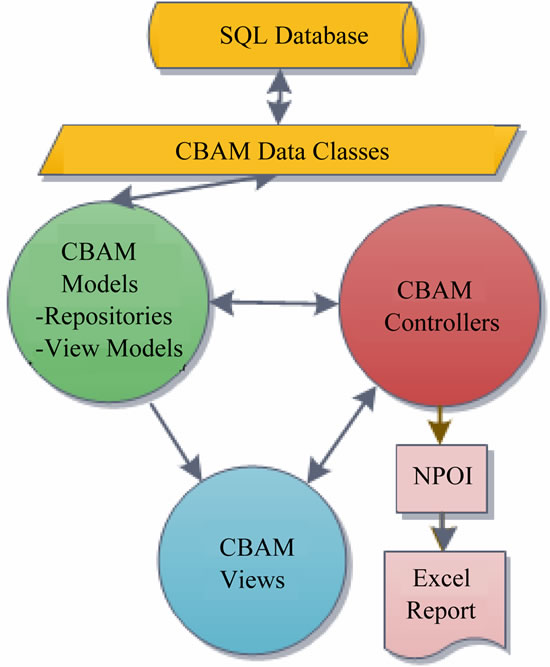
Figure 1. Architecture.
the format and layout of the information sent by the controller and displays the information to the user.
The CBAM Assistant models contain repositories and view models. The model repositories contain the functions needed to get or modify data. The view models define objects and the relevant components for a specific view. The validation rules for the components are defined as well. Recall, CBAM is an incremental process. The prior step must be completed before one can move on. The validation for the same object can vary depending on the step. For example, a vote for each scenario is not required in CBAM Step 1, yet it is required for scenarios in CBAM Step 3. ASP.NET MVC makes it easy to define the validation rules for each model separate from the view.
The CBAM Assistant views display information provided by the controller. Each web page displays at least one view and may include partial views. When a user submits information or clicks on the page, the request is sent to the controller.
The CBAM Assistant controllers process requests from the view. Updates are made through the model repositories and new information for the next display is requested from the model views. The controller then responds to the view and sends the new output.
The reports are generated in excel using NPOI. NPOI is an open source apache project. It allows one to read and write to excel without having excel installed on the server. NPOI currently supports Excel 2003. An XML template is used to define the report format. There are multiple sheets defined within the template. The Report controller handles rendering the final report. The report controller calls a stored procedure to calculate some of the final numbers for the output. The controller then gets the data for each sheet and writes the data to the template using NPOI. Then the controller sends the excel report as an HTTP response. The end result is a downloaded excel report for the user.
Data classes show how the models, views and controllers interact in CBAM Assistant. CBAM Assistant uses JQuery tabs to display information for each step. Validation varies at each step in the project. For example in Step 4 users assign utility to the top 1/6 scenarios. Utility is not required prior to this step. The following section explains the role of the models, views and controllers. Step 4, assigning utility, will be used in the examples.
3.2. Data Classes
The structure and relationships of the data objects are defined in the data classes. The data classes have corresponding repositories and view models. The repositories define actions and queries to be performed and the view model defines the data components needed for a specific view.
Figure 2 shows the data classes. Steps are updated by the system after a user makes a change. Each project has a list of scenarios and a list of architectural strategies. The utility class contains the current, best, worst and desired utility and response goals for each scenario. The relationship between scenarios and architectural strategies are defined in the expected utility class. The expected utility class identifies the response goal and expected utility for each scenario that is impacted by an architectural strategy. The Importance and Quality Attribute classes are lookup classes that hold descriptions only. The measures needed to calculate the ROIs are defined in the benefit class. A stored procedure, spGetBenefit does the calculations to get the measures needed for the ROI.
3.3. CBAM Assistant Models
Each data class has a corresponding repository, data model and a view model as shown in Figure 3. The repositories define the functions needed to get data for each class. For example, Scenario Repository contains queries such as:
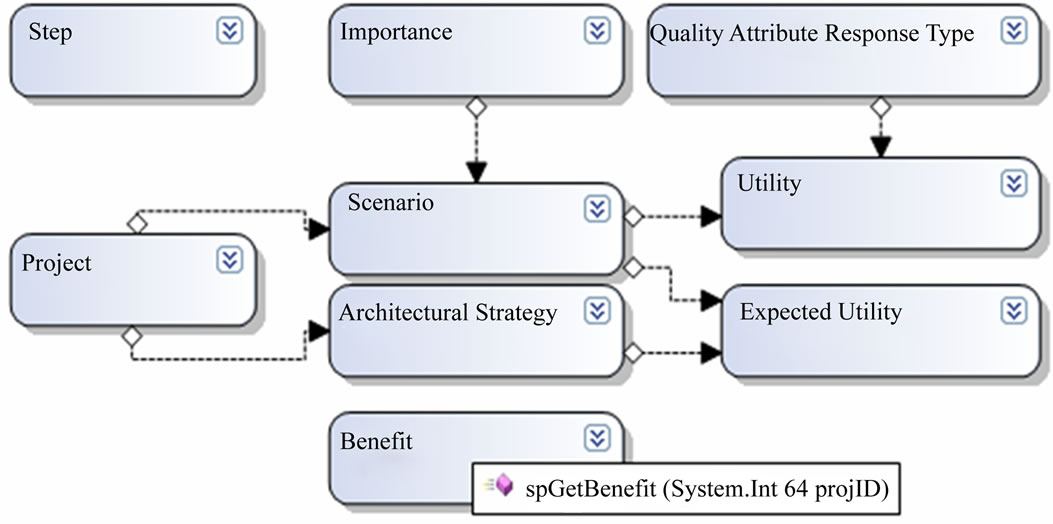
Figure 2. Data classes.
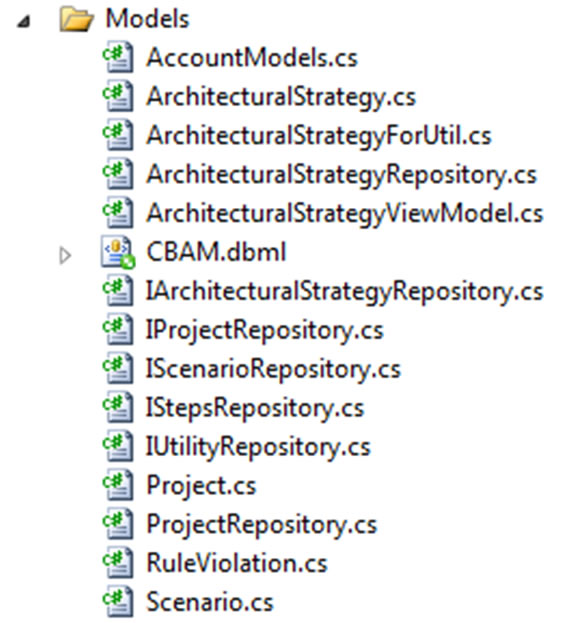
Figure 3. CBAM models.
Get By ID and Get Top Third. The repositories also contain update functions such as: Add and Save. The data models show the components and validation for the model. For example, Scenario.cs in Figure 3 is the data model for the scenario data class. Figure 4 shows the metadata for Scenario.cs that defines name and description as required along with the error message to user.
As a user goes through the CBAM steps, the validation rules will change. For example, utility is defined in Step 4 for only the top 1/6 scenarios. To account for this a model is created for use in the view corresponding to each step. These models define the components and validation applicable to that step. Figure 5 shows the scenario object used in Step 4. A list of utilities is added to the scenario object. Each scenario in Step 4 (top 1/6) must have a description for the utilities. Thus, the utility description is defined as required for validation.
The view models connect all components needed by a view, or multiple views, with data from the repository. Figure 6 shows the Create Index view model which is used to create a scenario index or list. Create Index view model includes: the project name and ID, a list of scenarios for the project, the number of steps and next step to be completed. These are all the components that show on the web page. Create Index is used by all steps to get the information that shows on the top of the page and the initial scenario data.
3.4. CBAM Assistant Views
The application is set up using JQuery tabs. There is a tab for each step. Each tab contains at least two view pages, the tab header, “Step” and another view, which displays the detail.
The step view displays the information shown in Figure 7. This is a shared view available to all controllers. If
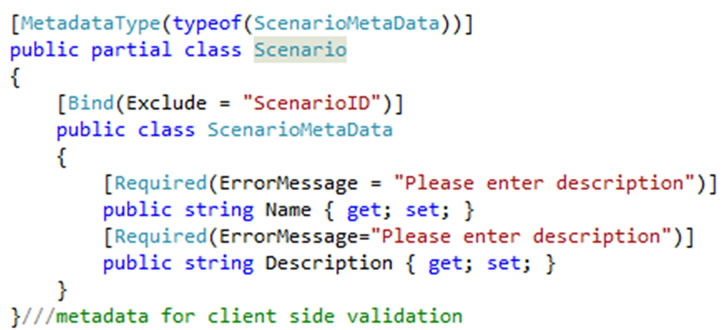
Figure 4. Scenario meta data.
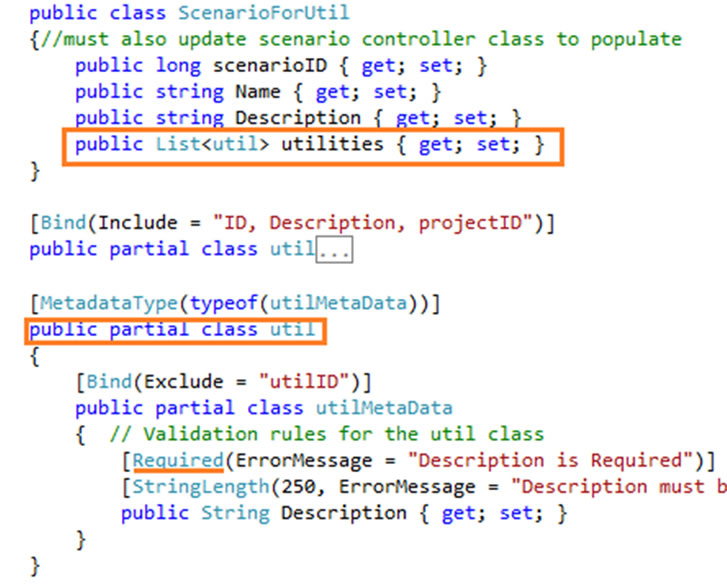
Figure 5. Scenario for Step 4.
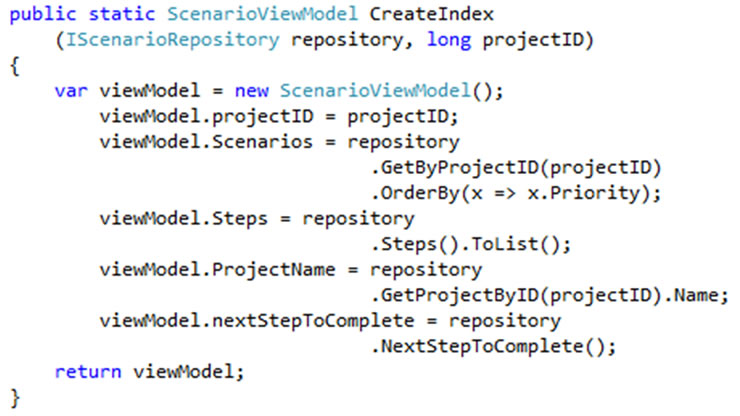
Figure 6. View model.
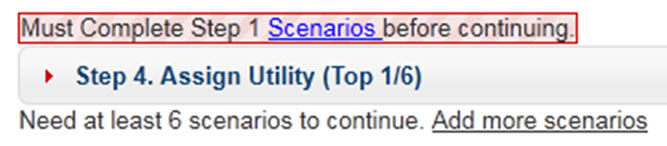
Figure 7. Tab header.
all prior steps have been completed, then the tab header has an “Edit” link. If there is still work to be done on prior steps, the view will show a link directing the user to the next step to be completed. The tab header, “Step” also displays an expandable help reference that provides more information about the step to a user. Figure 7 shows step view for Step 4 if Step 1 has not yet been completed. The second view on each tab displays the detail.
Figure 8 shows the view control page for Step 4. The view page takes a model of type “Scenario View Model”. This view renders the “Step” view, to display header information, followed by a view called “Top Sixth List”, which shows the scenario detail list. The controller will send the data to the view for display. The Step view takes two parameters; 4 for the step and the project ID. Each step is set up in a similar manor.
3.5. CBAM Assistant Controllers
There is a controller for each data class as well. The controller has “Action Result” functions to get or post data as requested or sent by the views. The business logic for updating the database in contained in the controller classes. Figure 9 shows the scenario controller actions triggered when a user selects tab 4. Action result, Step 4 instantiates the Create Index view model and sends it to the Step 4 view for display. Recall, the Step 4 view expects an object of type Scenario View Model which is the view model type sent by the controller.
The controllers handle the data that go into and come out of the views. Controllers request information from the repositories to populate view models. The view models contain various data models. The views display information from the controller in the format of a model.
4. CBAM Assistant Workflow
The workflow of CBAM Assistant is shown in Figure 10. CBAM Assistant is intended to have a main user who
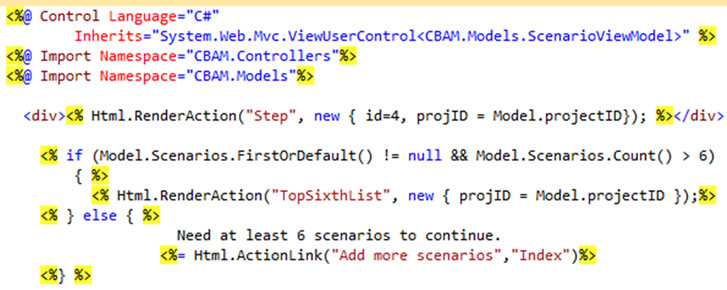
Figure 8. View control—Step 4.
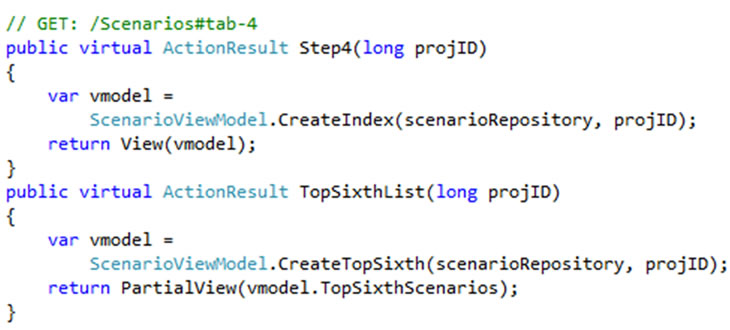
Figure 9. Scenario controller—Step 4.
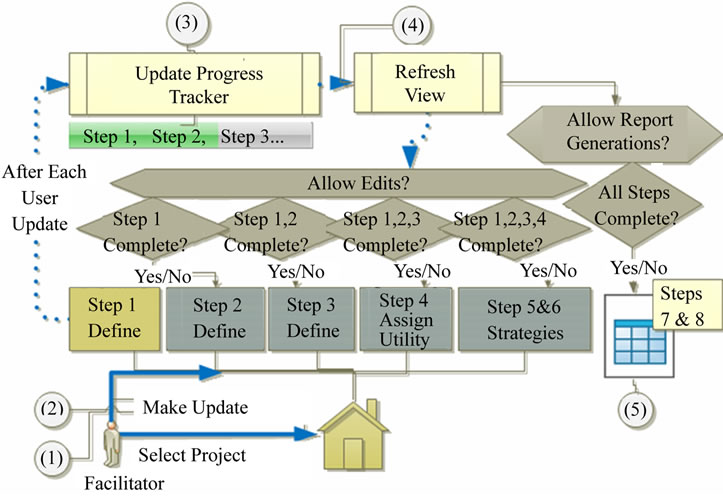
Figure 10. Workflow.
acts as a facilitator for the CBAM process. CBAM is an iterative process, where prior steps must be completed before you can move on. In each step, a user or facilitator would gather feedback from all stakeholders and enter their input into the system. This tool walks a user through the steps, lets a user know what step is to be completed next, tracks all input and finally, once all steps have been completed, a user can generate a report showing ROI and other indicators.
As shown in Figure 10, first, a user must select or create a project (1). Next, a user will select a step to work on (2). For a new project, a user must start at Step 1. Each time a user saves changes (3), the system will check to see if there is enough information to move on to the next step. A user ultimately determines when each step is complete, but the system will ensure there is sufficient information for calculating the results.
The system will update the progress indicator after the user saves updates. The progress indicator shows the user which steps are available for edits (3). The screen will update and open any new steps for editing (4). Each step is always available for review in case a user makes changes later in the process that requires them to go back a few steps.
Once a user has completed all steps, the system has enough information to calculate benefit and ROI, at Steps 7 and 8 of CBAM. A user can then select to generate a report (5). The system creates an excel report showing the ROI for each architectural strategy. Other inputs from a user are included in the report including the priority of scenarios and the scenarios impacted by each architectural strategy.
5. CBAM Assistant Application
This section presents CBAM Assistant in action by showing an example using NASA ECS [1]. The system collects and processes data from satellite. In the example, the project manager is deciding which system enhancement should be made based on the budget. Software Architecture in Practice [1] provides the step by step details used in this example.
Figure 11 shows the first screen when the user launches CBAM Assistant. The user can create a new project (1) or go into an existing project (2). Create New requires the user to add a name and description for the project. Once that is done, the user can work on the project by selecting “Start” (2). Project “ECS-EODIS Core System” will be used for this example.
Figure 12 the project home page is displayed once the user selects “Start” in the home page. The project home page displays the project name in top right corner (1). The “Project” menu button (2) takes the user back to this screen. The “Home” button leads the user to the list of projects available shown in Figure 11.
The address bar (3) tells the user where they are in the project. For example “…/1/Scenario/Edit/5” tells the user, they are in project 1, editing scenario 5. The progress bar (4) tracks completed steps and shows the user the next step to be completed. Each step is laid out in tabs (5). Each tab has an expandable help bar (6) that provides more information about the step. The detail for each tab is shown (7). If the user has completed the prior steps, the user can also make edits.
The CBAM Assistant steps vary slightly from CBAM since some steps are automated by the system. CBAM Assistant steps are shown in Figure 12 (5) and in Figure 13. In Step 1, the user must enter and prioritize scenarios. Steps 2 through 4 are the same as CBAM. Step 5 in CBAM Assistant covers both steps 5 and 6 of CBAM. Steps 7 and 8 of CBAM are automatically calculated by the CBAM Assistant system in the report output that is available after all steps have been completed.
The first step in CBAM Assistant is to define and prioritize scenarios. If CBAM is following the ATAM process, scenarios from ATAM can be used. The tool allows the user to create new scenarios and enter the details. Users can then drag and drop scenarios into priority order as shown in Figure 14. Once the user has defined and prioritized at least three scenarios, Step 2 is available for edit.
In Step 2, the user adds the best, worst, current and desired response goals for the top 1/3 scenarios. Any missing definitions are highlighted to inform the user of missing items. When complete, Step 3 is available for edit.
In Step 3, the stakeholders vote on the top 1/3 scenarios. The distribution of votes among stakeholders is determined by the group. A total of 100 votes must be used. The user or facilitator enters the total votes for each scenario. Once the votes for the top 1/3 scenarios equal 100, the group is ready for Step 4.
In Step 4, the user enters the utility gained by each response goal for the top 1/6 scenarios (see Figure 15).
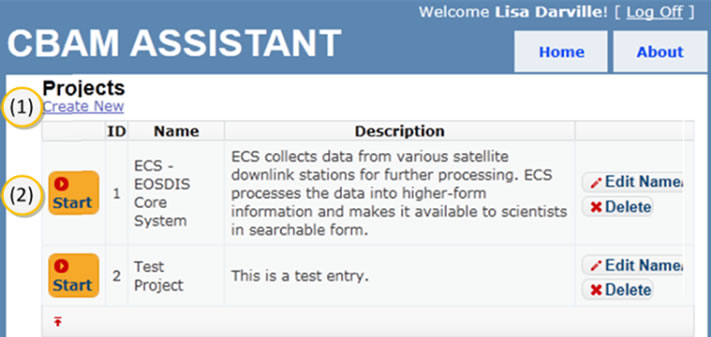
Figure 11. Home page.
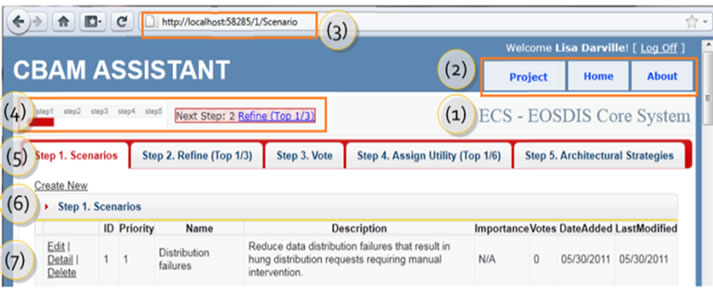
Figure 12. Project home.
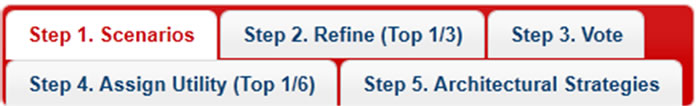
Figure 13. CBAM assistant steps.
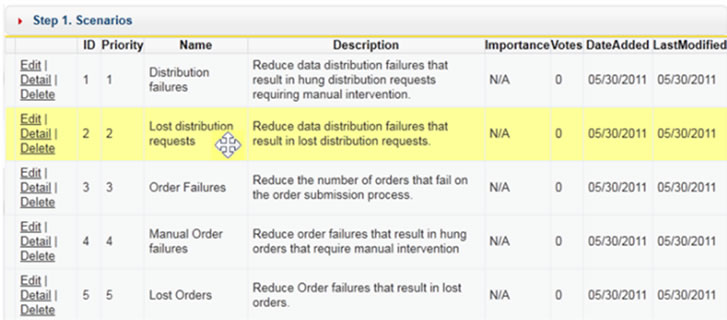
Figure 14. Prioritize scenarios.
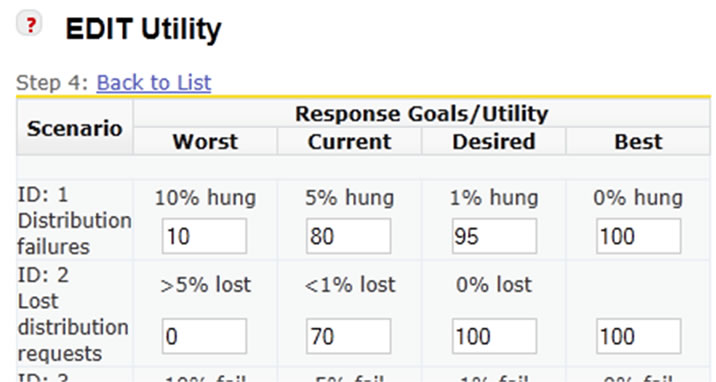
Figure 15. Step 4 entry screen (sample data, not all records included).
The top 50% of scenarios from Step 3 are used based on votes. Utility is between 0 and 100. The user may choose to use a scale between 1 and 5 or 1 and 10 for example. Once utility is entered for each, Step 4 is complete.
In Step 5, the architectural strategies are defined. The user describes the strategy, estimates the cost of implementing the strategy and tags all scenarios impacted by the strategy. Next, the user defines the expected utility and expected response of each scenario if the strategy was to be implemented. Once all strategies and impacts on scenarios are defined, Step 5 is complete.
Once the steps above have been completed, the user can use the system to generate a report. When the user clicks on the report option, the system summarizes the benefit for each strategy, as described in Step 7 of CBAM, and calculates the ROI, described in Step 8 of CBAM. An excel file is downloaded to the user. The file contains five reports or worksheets: ROI, Architectural Strategies, Strategy Benefit Detail and Scenarios. Below describes and shows an example of each.
The most critical worksheet, shown in Figure 16, displays the ROI of each strategy. The strategies are ranked in descending order with the best ROI listed first and ranked 1. The Benefit, Cost and ROI of the top three strategies ranked by best ROI are graphed to display the difference in ROIs.
The Architectural Strategy worksheet (Figure 17) shows name, description, the scenarios affected, current response, expected response, current utility and expected utility for each architectural strategy included for review.
The Strategy Benefit Detail worksheet (Figure 18)
shows the raw benefit, the weight (or votes) and the normalized benefit (raw benefit multiplied by weight) for each scenario affected by an architectural strategy. The cost for the architectural strategy is also shown. Other worksheets include the scenario details and the response goals for each scenario.
In the Scenario worksheet, the user can review information entered for each scenario (Figure 19). All scenarios entered to the system are included in the Scenarios worksheet. Figure 19 shows the top 10 scenarios as an example. The user can see the priority, name, description, source, artifact, environment, response, response measure and votes for each scenario.
In the Scenario Response Goal worksheet, the user can review the descriptions and response goal information. The Scenario Response Goals worksheet displays the best, worst, desired and current response goals for the top 1/3 scenarios based on priority. Figure 20 shows a sample of the report. The Scenario Response Goals worksheet also shows best, worst, desired and current utility for the top 1/6 scenarios based on priority. The priority, name and votes for the scenarios are included as well.
6. Validation and User Help
CBAM Assistant contains client and server side validation and help for each step. Figure 21 shows validation for
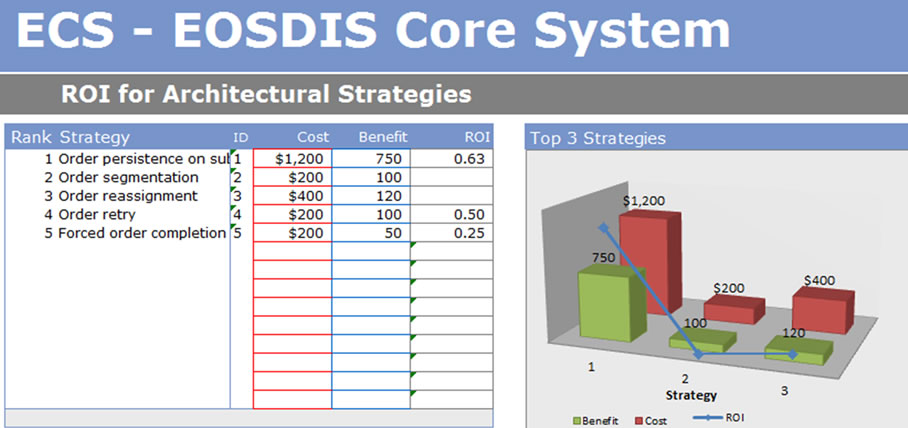
Figure 16. ROI worksheet.
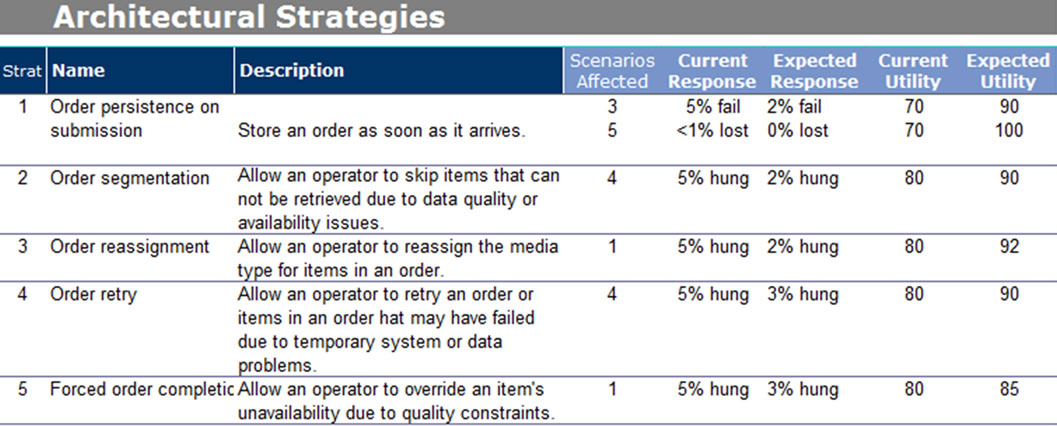
Figure 17. Architectural strategy worksheet.
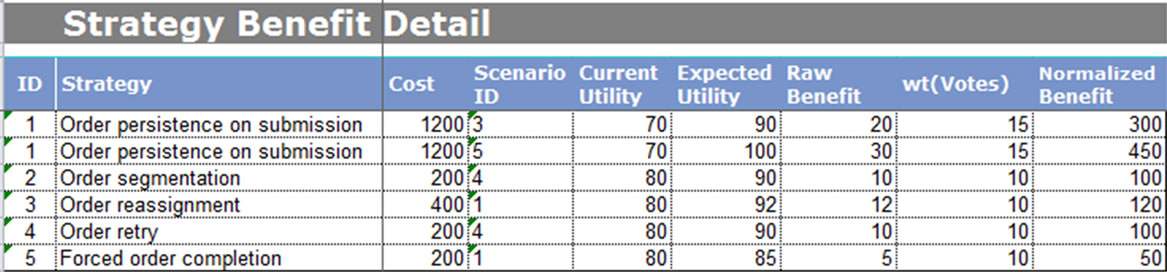
Figure 18. Strategy benefit detail.
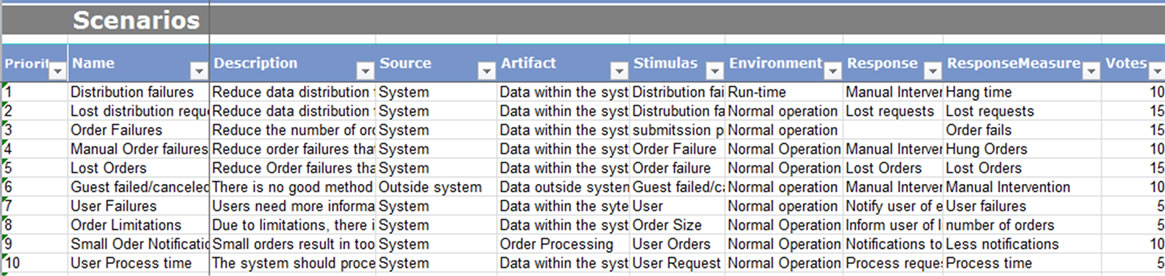
Figure 19. Scenarios.
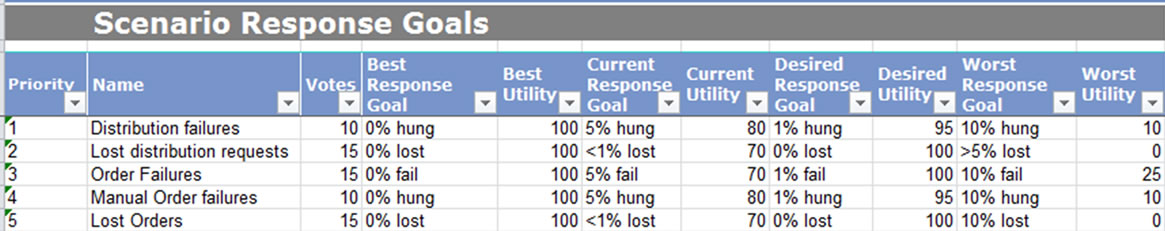
Figure 20. Scenario response goals.
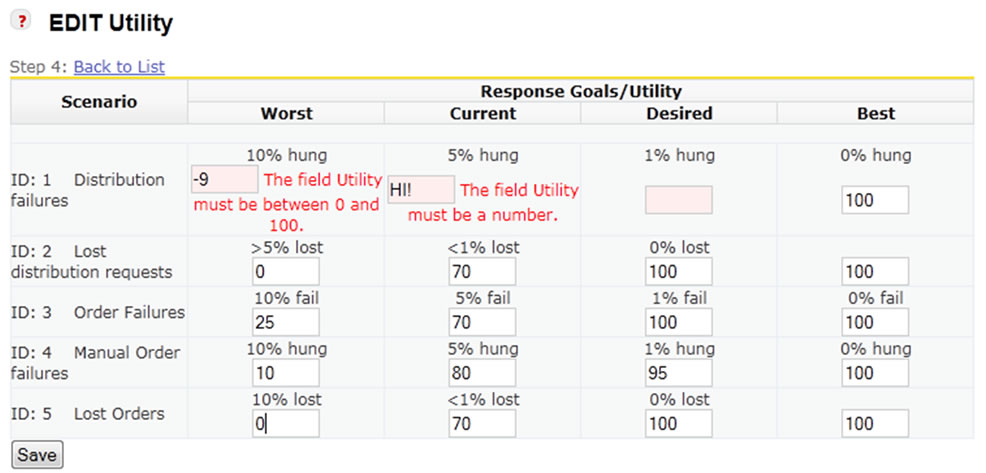
Figure 21. Client side validation.
the utility page in Step 4. Errors are highlighted and the user is informed on how to correct.
CBAM Assistant assumes that users will not always be able to complete a step in one session, Validation for these cases are done server side only. The user will be warned, but completed entries will be saved. The step will not be considered complete until all the utilization fields are updated. Figure 22 shows the messages to the user once they hit save. Two records are saved correctly and the user is warned that a rating is required.
To help the user, the description of each step can be expanded to show an overview of the step. This is shown in Figure 23. Within each edit page, there are question mark icons to help the user understand how to fill out information and guide the user on what is required for the step to be complete, see Figure 24.
7. Conclusions
CBAM Assistant is a web-based tool designed to semiautomate the CBAM process. The CBAM process is designed to lead the developer to the architectural strategy that best meets the business needs. The semi-automation of this process makes it available to more developers for
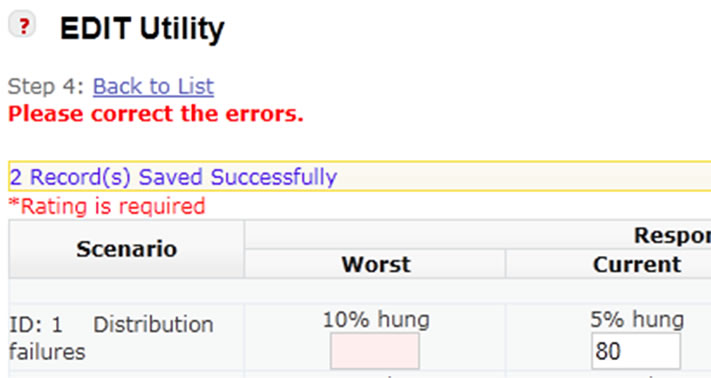
Figure 22. Error on save.
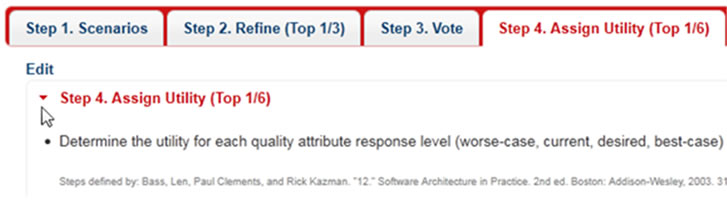
Figure 23. Help—step description.
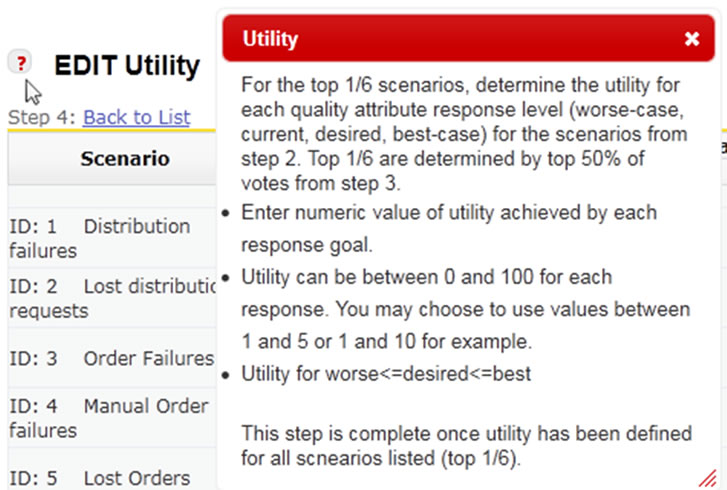
Figure 24. Help—edit pages.
use.
A facilitator is needed to coordinate meetings with stakeholders and gather the information required. CBAM Assistant will walk users through the steps, track the next step to complete and perform calculations to show the user the architectural strategy that yields the best ROI. The developer can then use this information to choose the strategy, which best suites the needs for the business.
Software is becoming more complex, which makes methods such as CBAM a necessary part of the software development process. The system can help users without CBAM expertise to go through a well-defined process. This system can promote use of CBAM in the software development process, improving efficiency, time, cost and quality of software in the long run.
There are future enhancements in consideration. The project currently does not have strict rules for authenticating users. With ASP.NEW MVC, it is simple to add user authentication. Automated integration of ATAM Assistant and CBAM Assistant will reduce data entry efforts if both systems are used for a project.
REFERENCES
- L. Bass, P. Clements and R. Kazman, “Software Architecture in Practice,” Addison-Wesley Longman Publishing Company Incorporated, Boston, 2003.
- R. Kazman, J. Asundi and M. H. Klein, “Making Architecture Design Decisions: An Economic Approach,” Technical Report, Carnegie Mellon University, Pittsburgh, 2002.
- R. Nord, M. R. Barbacci, P. C. Clements, R. Kazman, M. H. Klein, L. O’Brien and J. E. Tomayko, “Integrating the Architecture Tradeoff Analysis Method (ATAM) with the Cost Benefit Analysis Method (CBAM),” Technical Report, Carnegie Mellon University, Pittsburgh, 2003.
- B. Lionberger and C. Zhang, “ATAM Assistant: A SemiAutomated Tool for the Architecture Tradeoff Analysis Method,” Proceedings of the 11th International Conference on Software Engineering and Applications, Cambridge, 19-21 November 2007, pp. 330-335.
- R. Kazman, L. Bass, M. Webb and G. Abowd, “SAAM: A Method for Analyzing the Properties of Software Architectures,” Proceedings of the 16th International Conference on Software Engineering, Sorrento, 16-21 May 1994, pp. 81-90. doi:10.1109/ICSE.1994.296768
- N. Lassing, D. Rijsenbrij and H. Vliet, “On Software Architecture Analysis of Flexibility Complexity of Changes: Size Isn’t Everything,” Proceedings of 2nd Nordic Software Architecture Workshop, Ronneby, 12-13 August 1999, pp. 1103-1581.
- C. H. Lung, S. Bot, K. Kalaichelvan and R. Kazman, “An Approach to Software Architecture Analysis for Evolution and Reusability,” Proceedings of the 1997 Conference of the Centre for Advanced Studies on Collaborative, Toronto, 10-13 November 1997, pp. 144-154.
- P. Bengtsson and J. Bosch, “Scenario-Based Architecture Reengineering,” Proceedings 5th International Conference on Software Reuse, Victoria, 2-5 June 1998, pp. 308- 317.
- G. Molter, “Integrating SAAM in Domain-Centric and Reuse-Based Development Processes,” Proceedings of 2nd Nordic Workshop Software Architecture, Ronneby, 12-13 August 1999, pp. 1103-1581.
- P. Bengtsson and J. Bosch, “Architecture Level Prediction of Software Maintenance,” Proceedings of 3rd European Conference on Software Maintenance and Reengineering, Amsterdam, 3-5 March 1999, pp. 139-147.
- J. C. Dueñas, W. L. de Oliveira and J. de la Puente, “A Software Architecture Evaluation Model,” Lecture Notes in Computer Science, Vol. 1429, 1998, pp. 148-157. doi:10.1007/3-540-68383-6_22
- L. Dobrica and E. Niemela, “A Survey on Software Architecture Analysis Methods,” IEEE Transactions on Software Engineering, Vol. 28, No. 7, 2002, pp. 638-653. doi:10.1109/TSE.2002.1019479
- http://npoi.codeplex.com/