Journal of Service Science and Management
Vol.7 No.4(2014), Article
ID:49136,11
pages
DOI:10.4236/jssm.2014.74026
Implementation of Lean Service with Value Stream Mapping at Directorate Airworthiness and Aircraft Operation, Ministry of Transportation Republic of Indonesia
Zulfa Fitri Ikatrinasari, Erlana Ichsan Haryanto
Industrial Engineering, Mercu Buana University, Jakarta, Indonesia
Email: zulfafitri@gmail.com
Copyright © 2014 by authors and Scientific Research Publishing Inc.
This work is licensed under the Creative Commons Attribution International License (CC BY).
http://creativecommons.org/licenses/by/4.0/


Received 12 May 2014; revised 8 June 2014; accepted 1 July 2014
ABSTRACT
The purpose of this paper is to apply value stream mapping (VSM) for enabling leanness in Directorate Airworthiness and Aircraft Operation, Directorate General of Air Transportation, Ministry of Transportation Republic of Indonesia. A current state mapping is made to determine the activities that provide value-added and non-value-added activities or waste. Weaknesses in the current state process mapping will be analyzed and improved in the future state mapping to obtain a better flow, faster and more efficiently. The reduction of total lead time, makes total cycle time decrease significantly, i.e. 69%, or from 94.5 to 29.5 days, while the process time is constant, i.e. 18 days. Future state mapping can reduce lead time and increase cycle time efficiency. Current State Mapping shows weaknesses/waste and is non value added. Current state shows quite a high lead time value, so that cycle time efficiency is low. The efficiency value is 0.112 and after future state mapping becomes 0.70. Lean service research in government organizations has been the first time done in Indonesia.
Keywords:Lean Service, Waste, Current State Mapping, Future State Mapping

1. Introduction
The development and improvement of airline services are increasing from year to year. This can be seen from the growing number of airlines. Air transport services in Indonesia in 2012 were served by 61 operators, consisting of 26 scheduled operators and 35 unscheduled operators (source: Ministry of Transportation). The total number of registered aircraft is 1209 units with 865 units of active operations. In addition, aviation supporting industries are also rapidly growing, such as the emergence of schools for pilots, maintenance technicians, cabin crew, and aircraft maintenance companies. In total, there are 200 companies engaged in the area of aviation industry today.
The application of lean in government organizations may be unheard of. However, it does not mean that it cannot be applied. According to [1] , the lean method has been applied in the United States, particularly in environmental agencies since 2003. They could carry out their mission in a better, faster and cheaper way, and increase effectiveness, efficiency, and transparency of government programs and services. In the aviation world, [2] mentioned that lean was already applied by the Boeing Company. Boeing could eliminate waste and make its products more cost-competitive. The Boeing Company successfully reduced 75% of its defect costs. This equals to approximately $655,000 cost savings per aircraft.
Currently, there is a shift in the form of lean in manufacturing used in service industries called lean service that has the same concept, i.e. value-creating activities, eliminating waste that is present in the service process and making a flow of added value. The application of lean in the services sector is needed to reduce operational costs, development time, transactions and licensing, and increase flexibility, which allows it to adapt more quickly to customer requests. Lean has been successfully applied in the non-manufacturing sectors, such as banking, hospitals, education, government, administration, insurance and health. The government has been running business activities traditionally for years.
Traditionally, the operation of business services is a major opportunity for improvement. Lean transformation aims to reduce 50% of cycle time and defect rate. According to [3] , lean service is a quick way to increase service productivity. Lean production developed at Toyota has totally revolutionized the way we produce in various types of manufacturing industries everywhere around the world, and has shown remarkable results. Lean service approach can systematically identify and eliminate waste in activities that do not add value. For example, too many tables to obtain approval signatures, waiting for information, expired database/files/folders, errors in documents, etc. The application of lean concepts in government organizations is expected to be able to create work process that flow smoothly, controlled in accordance with public demand. This will shorten the time of licensing.
Lean approach is one of the best approaches to identify waste that occurs in the work environment. According to [4] Transactional Six Sigma and Lean Servicing, the overall principle of lean is the elimination of all kinds of waste. If we apply lean, only value-added activities will produce quality products or services. With lean service approach to conduct a study on current process conditions using the value steam mapping tool, it is expected to answer the problem formulation and at the same time to achieve the goal and final benefit of this study:
1) Identifying the current state mapping of work process.
2) Identifying the value added and non-value added or waste that is currently present.
3) Improvement planning on the current state.
4) Proposal for an efficient and value-adding future state mapping process.
1.1. Lean
[5] mentioned that lean was initially born out of the manufacturing industry. However, the concept of lean can be applied in service-based fields. Lean in the field of service bears the same principle, namely “continuous improvement” and “eliminating non-value-added activities alias waste”. However, these principles are also currently applied in service businesses such as call centers, health care, higher education, software development, and other professional services. According to [6] , lean production is the philosophy and practical ways to eliminate all waste in all production processes continuously. By applying the principles of lean, we practically can successfully improve the production processes continuously. [7] stated that the service industry using lean service refered to the application of lean manufacturing ideas. In relation to lean manufacturing, lean service also focuses on eliminating waste and increasing efficiency in the work process. Lean techniques identify and eliminate unnecessary process steps (non-value) and activities are built and improved from time to time and continuously.
[5] mentioned that the term lean was known for the first time in the automotive industry. Lean can be interpreted as “slim”, in accordance with the concept of lean that wishes a process only contains necessary activities and has added value, while unnecessary/non-value added activities defined as waste must be eliminated. Lean focuses on value-added, and it can be achieved through constant evaluation on the improvement process. The application of lean principles in offices is feasible. According to [8] , lean in the office is streamlining and eliminating waste from administrative processes and adding value. If lean is applied in the office environment, it is expected to gain several advantages, among others reducing paper usage, improving work flow, improving productivity, better teamwork, reducing stress on staff, reducing operating costs, increasing customer satisfaction, reducing lead times (waiting times), reducing inventory levels and costs, improving the quality of services and products, and improving cycle times.
According to [9] , both engineering lean manufacturing and lean enterprise mean that a company focuses on what is desired by the customer, the product purchased is not defective and right on time. This can be achieved by minimizing waste during the production process. The principles are as customer value, value stream, continuous flow, pull process, and continuous improvement or perfection.
1.2. Lean Service in Non-Manufacturing and Government Organizations
[10] mentioned that lean was not only for manufacturing. Although the initial concept was introduced from the manufacturing industry, in its development, this concept could be applied in the service industry. Lean techniques can be applied in all process businesses, including the administration department. [11] stated that lean in the service industry was very important to be able to provide added value for services provided, as well as a rapid process and less resources, yet precise. Therefore, a deep analysis on non-value added activities is required. The aim of service organizations is to increase customer service satisfaction, reduce waste and increase capacity. According to [12] , lean service in the public sector has a saving potential of around 50% - 75% compared to the traditional process, done through shorter cycles, continuous flow, and faster decisions. This provides evidence that the adopted method from manufacturing provides effective solutions for the service sector. Eliminating non-value added steps and reducing response time can increase the level of efficiency.
[13] said that using lean can improve quality, cost effectiveness, service and sense of responsibility. Lean contains a collection of principals, methods, and tools that improve the speed and efficiency of any process by eliminating waste. Although lean originated from manufacturing activities, lean tools have been successfully applied in organizations in all sectors, including the government.
1.3. Value Stream Mapping
These tools are used to identify waste and non value-added activities. Then an attempt is made to eliminate or reduce waste. According to [14] , value stream mapping is a visual way to tell the flow of information in the service production process. Value stream mapping refers to the activity of developing a high-level visual representation of the process flow involved in providing products or services to customers. VSM events focus on the identification of non-value added activity sources (waste) and prioritize future activity improvements.
[1] mentioned that VSM checked the flow of information and the flow of products or services. VSM can improve the understanding of the decision making process and identify non-value added activities. VSM identifies the desired current state process and future state process and related implementation plans for process improvement activities in the future. VSM will contain information about the time, number of labor, transportation, etc. According to [15] , Value Stream Mapping can be divided into six steps:
1) Identification of service family.
2) Creating a current value stream from the organization and customer point of view.
3) Making an ideal future state mapping.
4) Improvement actions to close the gap between current and future conditions.
5) Conducting improvement actions.
6) Making a new current state mappping.
2. Research Methods
Stages of systematic research can be developed to handle the research process. The stages are as follows:
1) All work identification process.
2) Collecting and analysis work process time.
3) Current state analysis (process mapping).
4) Calculating total lead and process time.
5) Analysis of value added and non-value added (waste).
From the mapping process made, the value of each time will be calculated. According to [16] [17] , there are 3 (three) operation groups taken, namely: non-value adding (NVA); necessary but non-value adding (NNVA); and value-adding (VA). From the NVA, NNVA, dan VA values, the value of total time for approval cycles will be obtained.
6) Making future state mapping.
[18] mentioned that in planning for improvement, some of the considerations that may be used when analyzing the current state mapping to create a future state mapping:
• Is this high service demand variability? So that the data required minimum and maximum?
• Where is the bottleneck of the order process services?
• Where could be made one piece flow? Relay out? Work cell? Standardized work?
• How readiness supermarket pull the data? What used to pull the signal?
• How to model the most optimum schedule? Related to rush schedule? Visual board? Time frame fixed schedule?
• How to monitor and control the performance bottleneck?
• In a process which must be prioritized repairs?
3. Result and Discussion
Table 1 below show licensing type issued by the Sub-Directorate of Standardization. Permitting divided into two categories: initial approval and renewal of approval. Initial approval for a certificate given to new organizations that process takes 30 to 90 days. Renewal is a renewal of a certificate of approval. Time required for the renewal process is not yet determined.
All sequences of activities and work from beginning to end are identified and grouped into 9 (nine) processes. Only the AMO 145 organization filed for a re-application letter. This shows a variation of a non-standardized process and is not profitable. Process namely registration counters, register and signatures director, register and signature sub director, selection inspector, audit, post audit/process behind, administration, certification, handover.
In constructing the current state, the time flow data is required. The average time for administration activities is 11.5 days. This is a non-value added process. The audit plan is made based on the certificate validity period. Some audit plans were improved due to the addition of organizations. This is a form of rework and requires an average of 5 days. According to [18] , in starting the Value Stream Mapping, we need to look at the current process, which has 6 stages, namely:
1) Select a product family that will be mapped.
2) Decide the goal to be improved (what goal for improvement will be).

Table 1. Licensing type (family service) and duration time management current state.
3) Collect data and make the selected value stream mapping.
4) Run and collect data on value stream mapping.
5) Understand the value stream from the customer’s point of view.
6) Describe the value stream mapping.
3.1. Maximum and Minimum Data of Current State Mapping
[19] mentioned that before making a future state mapping, identification of the valid certificate renewal process or known as current state mapping must be conducted (Table 2).
3.2. Current State Mapping
Information flow mapping is required to complete the certificate renewal from beginning to end. Current state mapping is used to categorize processes, namely value add (VA): no value, (NNVA): need to be done, and nonvalue (NVA): no need to be done. Processes belonging to the category of waste will be eliminated or reduced.
The difference in inventory data on the number of organizations registered in 2012 and data in 2013: In 2012, a total of 166 organizations were registered, whereas in 2013, 136 active or operating organizations were registered. The number of active or operating organizations was 136 organizations from a total of 166 in 2012. 30 organizations were inactive. This shows wrong information, and is a waste in data. Schedule of inspector appointments until the month of October 2013 only allocated 106 organizations. Some organizations were not recorded in the planning of activities. This is missing data and is categorized as waste.
3.3. Delay Process
In the certificate renewal process, a delay was found. The completion of one audit process passed the target of the certificate validity period. This means that many organizations receive their certificates after the validity period has expired. A greater delay percentage value (78%) indicates waste on services for certificate renewal applicants. Of the total 82 renewed organizations, 78 percent experienced a delay of audit completion to a maximum of 186 days. The average delay obtained was 33.73 days. This means 78 percent of organizations received certificates after 33.73 days or more than 1 (one) month after the validity period of their certificates had expired.
Table 2. Current state.
Delays even reached a maximum of 163 days. This exceeds requirements for new organizations, i.e. 90 days. The total number of organizations that could be recorded, in which their data was successfully traced completely, were only 82 out of 166 organizations or less than 50%.
The calculated value indicates the value of lead time, waiting and process time. After the total lead time is known, the next step is to calculate the value of process cycle efficiency. The lead time should be reduced. Waste can be seen in the values of waiting and process time which are quite high. The processes of 1a, 1b, 2a, 2b, 3a, and 3b require a total time of 11.5 days.
3.4. Current State Mapping and Kaizen Burst (Figure 1)
To design the future value stream, a gap analysis on the current state with the kaizen burst sign is required. Kaizen burst is the area that needs improvement, by eliminating or reducing non-value added:
1) Kaizen burst 1: Registration process at the counter is perceived unnecessary. Not all applications for certificate renewal go by this process; out of 82 organizations, only 17 organizations that have complete records follow this process. Applying the pull demand system will reduce lead time and process time.
2) Kaizen burst 2, 3, and 4: The processes on numbers 2, 3 and 4 are duplication processes. These processes conduct incoming letter recording or re-registration done in different departments. This leads to overproduction, non-value added processing, adds inventory, adds variation, and causes waiting and finally requires movement of information or paperwork to other departments.
3) Kaizen burst 5, 6, and 7: The processes on numbers 5, 6 and 7 are duplication processes. This process is the same as processes number 2, 3 and 4. The difference is, this process is conducted after the audit process runs. This process causes response time and does not provide added value.
4) Kaizen burst 8: The drawback of this process is variations in scheduling. The waiting time against the appointment schedule is at a minimum of 4.7 and a maximum of 17.8 days. In the future state, it is reduced by applying the pull demand system based on the validity period signal.
5) Kaizen burst 9: The drawback of this process is too long waiting time, both before and after the audit. The length of waiting time can be reduced by giving greater authority and responsibility to the inspector to receive a direct response from the operator. Audit response is replaced by e-mail or fax.
6) Kaizen burst 10: The certificate handing process is conducted by collecting a number of signed certificates then handed together in a formal ceremony. In the future state, it can be reduced by directly handing the

Figure 1. Current state mapping & Kaizen burst.
certificate.
3.5. Work Process Improvement/Flow Chart (Figure 2)
From the future state mapping, a work process improvement or a new flow chart can be made. This diagram does not need to wait for an application from the company, but uses the pull demand system so that only supermarket personnel data and database register operators are required.
3.6. Redesigning of Future State Mapping
After going through improvement by eliminating non-value adding process and lead time, the value is re-calculated to determine the time difference before and after the implementation of lean. Based on the current state mapping (Figure 1) and future state mapping (Figure 3), then raised lead time and process time before lean is 94.5 day, and lead time and process time after lean is 29.5 day. There was a decrease 94.5 − 29.5 = 65 day or 68.78%. After the improvement process design has been applied, during a certain period which can be on work days, a measurement on the process performance needs to be conducted to ensure that the process that occurs can indeed give a significant impact on the process performance, in accordance with the expected goal or target. Based on the future state mapping, unnecessary process duplication was found. This process takes quite a significant duration. There are 8 (eight) processes of non value activities that can be eliminated, among others:
1) The process of counter registration.
2) The process of registration and obtaining the Director’s signature.
3) The process of registration and obtaining the Sub Director’s signature.
4) The process of response registration after the audit process at the counter.
5) The process of audit response registration and memo from the Director.
6) The process of audit response registration and memo from the Sub Director.
7) The process of invitation and formal ceremony for monthly certificate handing.
8) The process of scheduling and monthly schedule appointment into a pull demand system.
Answering audit findings does not need re-registration. This will reduce the waiting time (delay). Inspectors have the authority of process response until it is verified. Eliminating the registration process can reduce time to 11 days. The formal ceremony of certificate handing does not give added value. Organizations should immediately receive certificates. It takes up to 20 days to wait for an invitation letter.
3.7. Total Cycle Time Before and After Lean
The comparison of total cycle time between the renewal process before and after lean is distinguished based on the variation of days in the audit process. The audit process on value stream mapping is determined by the value of 5 days.
Observing the Table 3, it was found that the longest total cycles time occur in the AOC 135 organization certificate renewal process, and the lowest total cycles time in the AMTO 147 organization. The time for renewal process of the 135 organization turns out to be 50% exceeding the processing time which should be 90 work days. This is one of the forms of waste.
4. Conclusions
Organizational performance in the certificate renewal process is not optimal and there is a delay from the target of the validity period. Out of a total of 82 companies, 78% of them are late. There are quite a large number of missing data. Out of a total of 166 organizations registered in 2012, 86 organizations were identified with incomplete data so that the validity and reliability of data were doubtful. Only 17 companies were recorded with recapitulation data of complete incoming and outgoing letters. This shows a great waste. Non-value added is often due to high lead time or waiting time value. Lead time reduction becomes a prime target to be decreased on future state. The reduction of total lead time makes total cycle time decrease significantly, i.e. 69%, or from 94.5 to 29.5 days, while the process time is constant, i.e. 18 days. Future state mapping can reduce lead time and increase cycle time efficiency. Current State Mapping shows weaknesses/waste and is non value added. Current state shows quite a high lead time value, so that cycle time efficiency is low. The efficiency value is 0.112 and after future state mapping becomes 0.70.
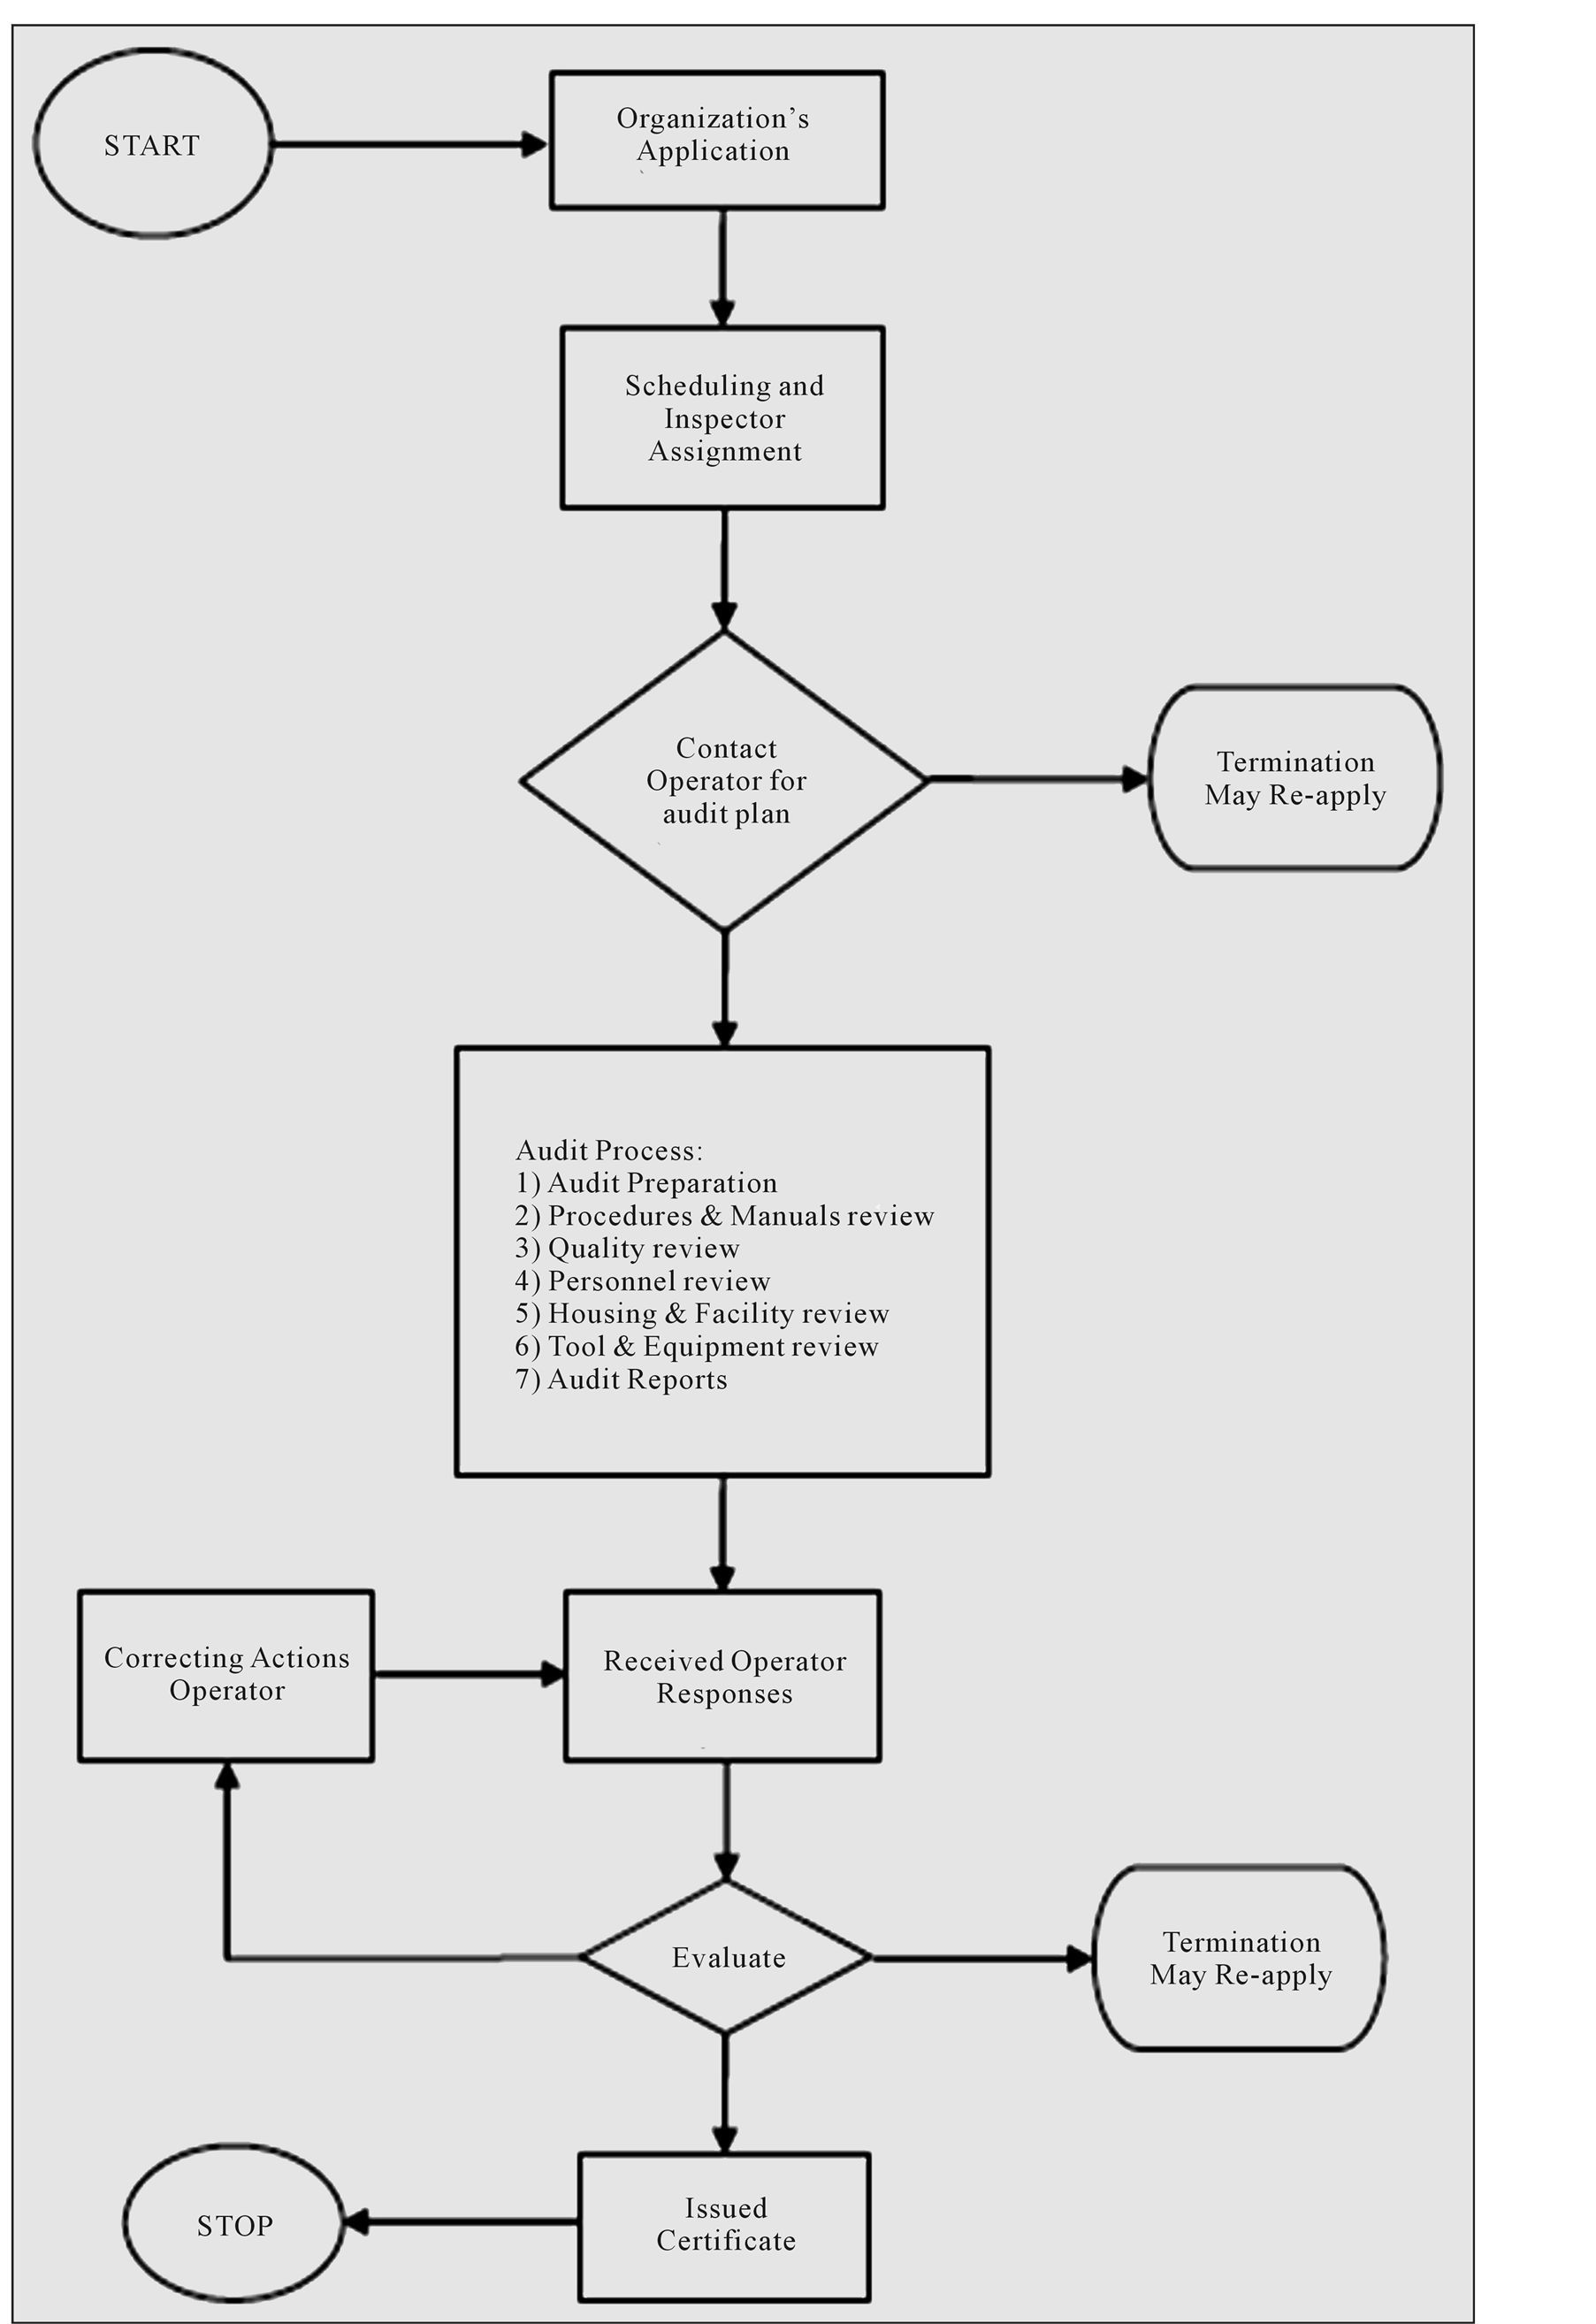
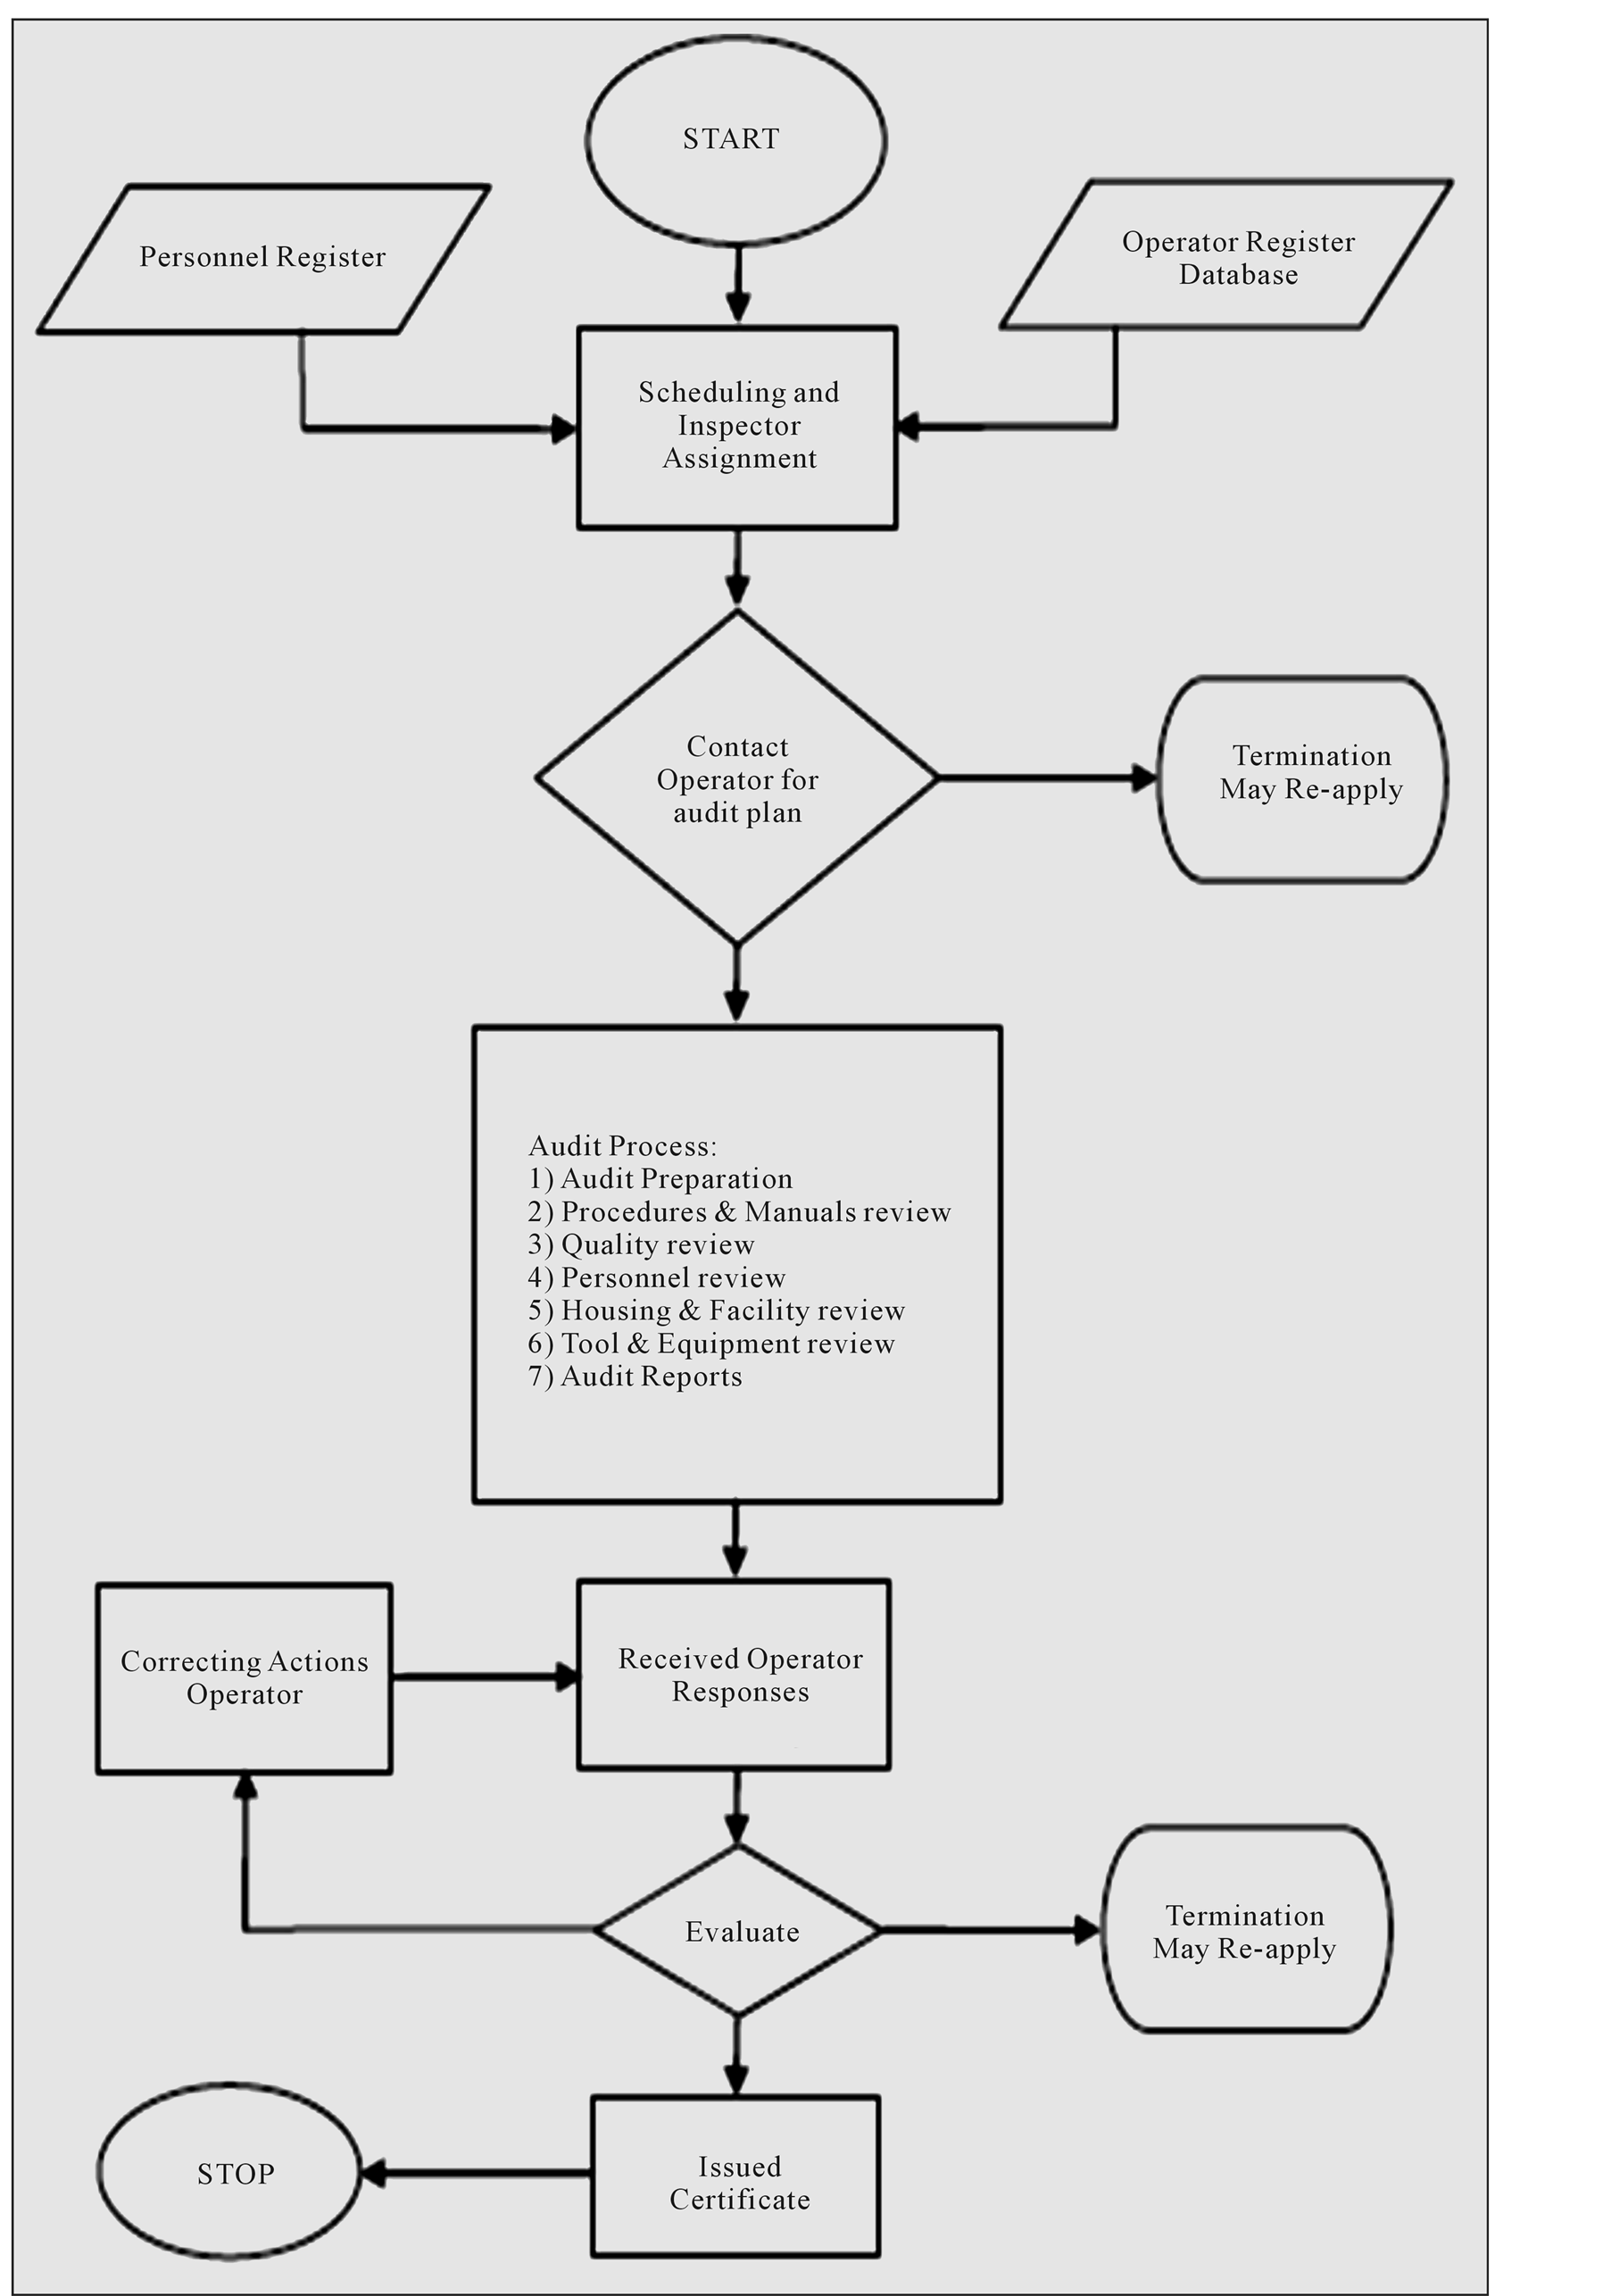
Figure 2. Workflow certificate renewal before and after lean organization.
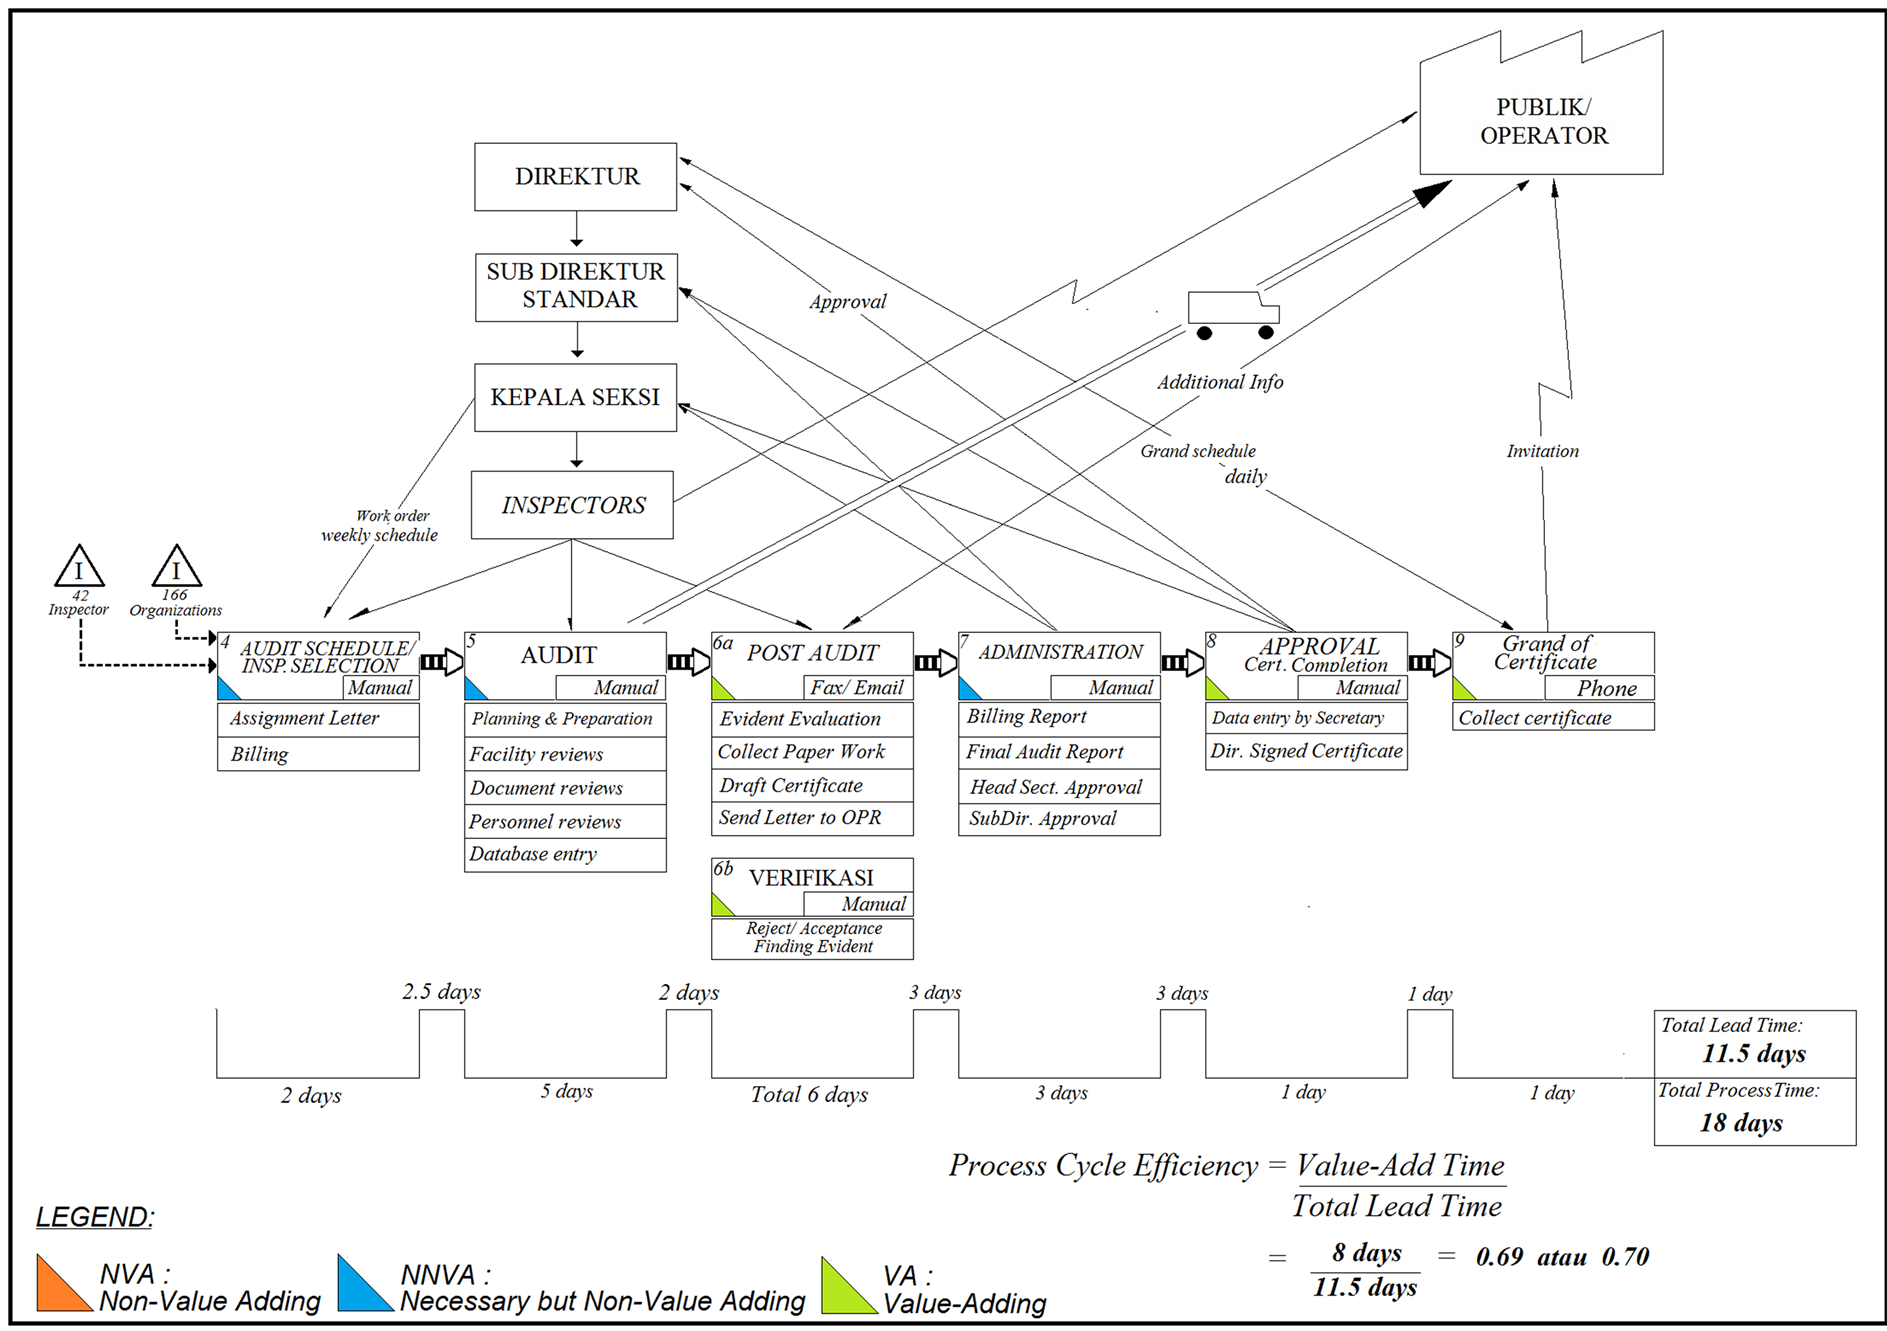
Figure 3. Future state mapping.
Table 3. Total cycles time after lean current state.
In lean application, a project management needs to be formed. The team must conduct strategic planning and carry out measurements on the process performance to ensure that the process that occurs can actually have a significant impact on performance in accordance with the expected goals or targets. Assessments need to be conducted on the readiness of personnel and other resources. This is important in order to avoid resistance to change. It is necessary to hold a workshop to provide theoretical knowledge and practical skills for value stream mapping. However, this training should not be limited to only one lean tool because it will only study the potential of VSM application alone.
References
- Ross & Associates Environmental Consulting (2008) Working Smart for EPA, Improving State Agency Processes with Lean in Government Series.
- Chen, J.C. and Cox, R.A. (2012) Value Stream Management for Lean Office—A Case Study. American Journal of Industrial and Business Management, 2, 17-29.
- http://dx.doi.org/10.4236/ajibm.2012.22004
- Womack, J.P. and Jones, D. (2003) Lean Thinking: Banish Waste and Create Wealth in Your Corporation. Free Press, New York.
- Ehrlich, B.H. (2002) Transactional Six Sigma Servicing, Leveraging Manufacturing Concepts to Achieve World-Class Service. St. Lucie Press, Boca Raton.
- Womack, J., Jones, D. and Roos, D. (1990) The Machine That Changed the World: The Story of Lean Production, Toyota’s Secret Weapon in the Global Car Wars That Is Now Revolutionizing World Industry. Free Press, New York.
- Carroll, B.J. (2008) Lean Performance ERP, Implementing the Virtual Lean Enterprise. 2nd Edition, Auerbach Publications, New York.
- Sanker, E.A. (2013) What Are Lean Services.
- http://www.wisegeek.com/what-are-lean-services.htm
- Schwiebert, E. and Schwiebert, P. (2008) Lean Office Overview, Eight Common Office Wastes.
- http://www.techhelp.org/
- King, A. (2012) How to Apply Lean in the Back Office Administrative.
- Froon, B. (2010) Implementing Lean Management Globally. Lean around the World. Bachelor Thesis Organization and Strategy.
- Turley, C. (2012) Lean in Service and Non-Manufacturing.
- http://c2plusconsulting.com/2012/02/lean-in-service-and-non-manufacturing/
- LeanMap (2013) Lean Application in Service.
- http://www.leanmap.com/lean-service/#sthash.ILMwHpQ8.dpuf
- Green, K. and Bowles, S. (2011) Lean: Excellence in Government, Improving Environmental Agency Processes with Lean and Six Sigma. United States Environmental Protection Strategic Agency.
- David, M.C. and Daniel (2011) Customer Value, Value Stream, Continuous Flow, Pull Process and Continuous Improvement.
- Gill, P.S. (2012) Application of Value Stream Mapping to Eliminate Waste in an Emergency Room. Journal Global Journal of Medical Research, 12, 51-56.
- Hines, P. and Rich, N. (1997) The Seven Value Stream Mapping Tools. International Journal of Operations & Production Management, 17, 46-64.
- http://dx.doi.org/10.1108/01443579710157989
- Rother, M. and Shook, J. (2009) Learning to See VSM to Create Value and Eliminate Muda. Lean Enterprise Institute, Cambridge.
- Nielsen, A. (2008) Getting Started with Value Stream Mapping. Gardiner Nielsen Associated Inc., Salt Spring Island.
- Paluska, K. (2007) Mapping to See: A Value Stream Improvement Process for the Office and Service. Lean Transformation Group.