Journal of Service Science and Management
Vol.6 No.2(2013), Article ID:32946,10 pages DOI:10.4236/jssm.2013.62016
A Behavior-Based Approach for Analyzing Knowledge-Process Dynamics
![]()
1Central Research Laboratory, Hitachi, Ltd., Tokyo, Japan; 2Department of Industrial Engineering and Management, Tokyo Institute of Technology, Tokyo, Japan; 3Power Systems Company, Hitachi, Ltd., Ibaraki, Japan.
Email: *norihiko.moriwaki.qw@hitachi.com
Copyright © 2013 Norihiko Moriwaki et al. This is an open access article distributed under the Creative Commons Attribution License, which permits unrestricted use, distribution, and reproduction in any medium, provided the original work is properly cited.
Received March 19th, 2013; revised April 20th, 2013; accepted April 29th, 2013
Keywords: Knowledge Management; Knowledge Process; Objective Behavioral Measurement; Wearable Sensor; Causal-Loop Diagram
ABSTRACT
Understanding and managing knowledge processes have been recognized as critical issues in regard to knowledge management. However, no practical methodology for understanding and managing the knowledge process has been devised because of the tacit nature of the process. This research work proposes a new methodology called “knowledge-process dynamics (KPD)” analysis featuring objective behavioral measurement. KPD analysis utilizes interaction data between workers (collected from wearable sensors) and update history of documents to clarify workers’ behavioral dynamics in the form of a causal-loop diagram. To demonstrate the effectiveness of KPD analysis, it was applied to product-design organizations. The resulting understanding of behavioral dynamics successfully helped a junior manager to idenfity problems and measures related to knowledge processes.
1. Introduction
Since the competitive advantage of cooperate organizations was shown to heavily rely on knowledge assets [1-3], understanding and managing knowledge processes have been recognized as critical issues in regard to knowledge management [4]. A methodology utilizing “objective” behavioral measurement helps managers to improve their understanding of a knowledge process.
To continuously enhance knowledge assets, managers in knowledge-intensive organizations (such as R&D divisions) need to manage how to create, share, and utilize organizational knowledge dynamically while pursuing information-processing efficiency [5,6]. Knowledge assets can be categorized as two types. One is explicit knowledge, which includes outputs such as intellectual property [7]. The other is tacit knowledge, which is the source from which explicit assets are produced. Much of a firm’s economic value is measured in explicit-knowledge assets, such as know-how patents, copyrights, and brand image, because they are easier to measure. The more valuable asset, however, is the underlying tacit knowledge that was needed to create them [8-10].
Apparently, tacit knowledge mainly relates to processes in organizations and therefore requires elaborate and complicated management. In most organizations, a knowledge process is managed, although sometimes unconsciously. The maturity of a knowledge process accelerates natural coordinated behaviors of people, though it may stabilize organizational processes as routines [11]. Established organizational processes as routines inhibit flexibility when an organization grows in size and pursues coordination of internal behavior. Particularly, this inflexibility of processes in an established corporation has been studied in terms of inhibition of disruptive innovation [12]. These studies revealed that complicated and intangible tacit processes affect organizational growth and stagnation.
Although some experienced managers can manage a knowledge process on the basis of personal experiences, no practical methodology for understanding and managing the knowledge process has been devised because of the tacit nature of the process. Knowledge-process management consists of a dynamic and continuous set of processes and practices embedded in individuals as well as in groups and physical structures. Nonaka and Takeuchi [9] focused on the creative aspect of knowledge and suggested a “knowledge-creation process”. According to Nonaka, a knowledge-creation process deals with repetition of a spiral process in which individual tacit knowledge and organizational explicit knowledge interact. In a knowledge-creation process, the subjective aspect of people (such as motivation and trust) is emphasized as the source of knowledge creation, though most ordinary organization theories neglect this aspect and view an organization as an information-processing machine. According to Nonaka’s theory, an intangible “tacit process” supports creation and utilization of organizational knowledge [9]. This intangible tacit process is driven by people in an organization.
Since knowledge is created by people, to understand the knowledge process, it is critical to understand the behaviors of people. The knowledge process functions as a behavioral aspect of people, such as instinct, emotion, social norm, and collaboration. To date, much research has been focused on behavioral management regarding the knowledge process [13-16]. Tacit knowledge is not easy to verbalize and document, but it manifests in certain behavior of the carriers of knowledge working in organizations through cognitive and knowledge-construction processes. It is therefore necessary to identify enhancing and impeding behavioral factors.
According to a study on the knowledge process, only 4% of the executives surveyed held high opinions of their performance in regard to measurement of the value of knowledge assets and the impact of knowledge management [17]. Methods for measuring or assessing a knowledge process are categorized as two types. One type of measurement method includes numerical outcome or activity costs, such as counts of issued patents, innovative ideas, operating-expense ratio, training expense, and project cost [18,19]. These measurements focus on the cost or results of behavior rather than the process itself. In this type of measurement, the dynamics of a knowledge process is assumed as a black box and controlled in an ad-hoc manner. The other type of method identifies typical SECI (“socialization”, “externalization”, “combination”, and “internalization”) behavioral modes of knowledge creation [8,9]. Activities corresponding to each knowledge-conversion mode of the SECI process are broken down and collected by survey elements. For example, a knowledge process is evaluated by the existence or balance of each SECI behavior [20] or circumstances affecting behaviors such as organizational characteristics and national culture [21]. These evaluation methods examine general traits of an organization by showing correlations between knowledge activities and outputs. They usually employ data gathered from a questionnaire survey and are suitable for identifying an idealized knowledge process.
However, little attention has been paid to measuring a knowledge process by objective behavioral measurement. To achieve organizational-process change, traditional process-measurement methods are insufficient. In many cases, their results are too abstract and lack specifics to identify problems and actionable measures for their own organizations. Understanding of the knowledge process should therefore be improved by taking a novel approach.
To address the above-mentioned issues, in this study, a radical methodology utilizing object behavioral measurement, called “knowledge-process dynamics (KPD)” analysis, is proposed. KPD analysis aims at improving understanding of the knowledge process so that even inexperienced managers will able to identify problems and measures concerning their knowledge process and to change that knowledge process with confidence. The key features of KPD analysis are listed as follows:
• A knowledge process in an organization is captured objectively as quantified data regarding face-to-face interaction and document-update history.
• Activity patterns are extracted from the quantified data and abstracted from the viewpoint of organizational hierarchy and externalized knowledge usage.
• A causal architecture underlying the behavioral patterns is clarified by a causal-loop diagram.
This paper is organized as follows. First, the concept of KPD analysis, including objective behavioral measurement, is described. Next, to demonstrate its effectiveness, the proposed methodology is applied to productdesign organizations. Then, the results of applying this new methodology are presented, and its usefulness is discussed.
2. Concept of Knowledge Process Dynamics (KPD) Analysis
To execute knowledge-process change, it is critical that managers understand tacit and complicated knowledge processes. Behaviors of primary entities concerning knowledge in an organization should therefore be clarified from the viewpoint of the dynamic aspect of a knowledge process.
2.1. KPD Analysis
Measuring and analyzing the dynamics of a knowledgeprocess, which affects both tacit and explicit knowledge in an organization, is the basis for understanding a knowledge process. For this purpose, a radical methodology utilizing objective behavioral measurement, called “knowledge process dynamics” (KPD) analysis, is proposed. KPD analysis aims to analyze interactions between people in an organizational hierarchy composed of top, middle management, and frontline workers. KPD analysis thus enables analyzing temporal dynamics of behavioral patterns.
Interaction analysis is based on “systems thinking” [22], namely, the process of understanding how things influence one another within a whole system. Systems thinking concerns an understanding of a system by examining the linkages and interactions between the entities that compose the entire system including behavioral patterns, architecture, and underlying values of conscious and unconscious behaviors of people. The systemthinking approach thus fits well with the aim of clarifying a knowledge process.
KPD analysis comprises of the following three steps (Figure 1):
1) Objective measurement of behavior of people involved in a knowledge-process.
2) Identifying patterns from behavioral data.
3) Understanding the knowledge process.
Unlike traditional approaches using a subjective survey method, KPD analysis clarifies a knowledge process in an objective and quantifiable manner by utilizing a wearable sensor device, document update history, and field observation. Behavioral patterns of people in an organization are then calculated, and the causality producing the behavioral patterns is understood by representing them as a causal-loop diagram. Understanding the system architecture of behavioral patterns helps to find a fundamental solution [22].
Since KPD analysis helps in grasping the current status of a complicated knowledge process, managers are able to understand their organizational process and to execute process change. Each of the three steps of KPD analysis is explained in detail in the next section.
2.2. Objective Measurement of Knowledge-Process Behavior
The most important step in analyzing a knowledge proc-

Figure 1. Flow diagram of KPD analysis.
ess is precise measurement of behaviors of people in an organization. As Drucker pointed out, it is essential that knowledge workers reflect on their time usage so that they can enhance their productivity [23]. Accordingly, a time-utilization study of a current process is an appropriate approach for objectively assessing organizations in different categories of industry, task, and context. For example, face-to-face interactions between people in an organization are considered to be a critical activity for transferring tacit knowledge between people [14]. Quantified data concerning time utilization of workers’ activities (including face-to-face interaction) therefore contain critical implications for analyzing a knowledge process.
Objective measurement of time usage requires objective measurement of people’s behavior, unlike a subjective self-reflection survey. It is apparent that there are limitations on the extent that people can rely on their memory to remember and reflect on their own activities. For example, people tend to lose track of time when they devote themselves to the task they are engaged in, called emotional “flow” state [24]. Especially in the flow state, people are not good at recalling their activity with high precision.
In KPD analysis, activity among people is measured continuously along a timeline. The duration and frequency of face-to-face interactions between people in an organization are accumulated as sequential data. Externalized knowledge activity is calculated from an update history of documents. Moreover, direct field observation is complementarily employed with the above-mentioned activity measurements for capturing the organizational culture, which cannot be captured as data. The combination of multiple data contributes to developing a rich, three-dimensional picture of current knowledge behaviors and actual work situations of the people. The proposed objective method for measuring behavior is explained as follows.
For face-to-face measurement, the latest “wearable” sensor technology is employed. Hitachi’s “Business Microscope” is one such technology [25] for measuring face-to-face interaction (Figure 2). Interactions between people are captured automatically and unobtrusively when the people wear a name-tag-type sensor node at work. Interactions between people are captured and stored as follows: Each sensor node sends and receives an ID, which is uniquely pre-assigned to each node, by infra-red signal from one sensor-node to another automatically when they are within a range of 2 - 3 m and an angle of 120 degrees and captures the ID of the other node with a timestamp. This ID exchange with time information enables analysis of face-to-face experience in terms of quantity and frequency. The sensor node is small and light enough to carry and works for 20 hours on one charge. Objective face-to-face measurement is
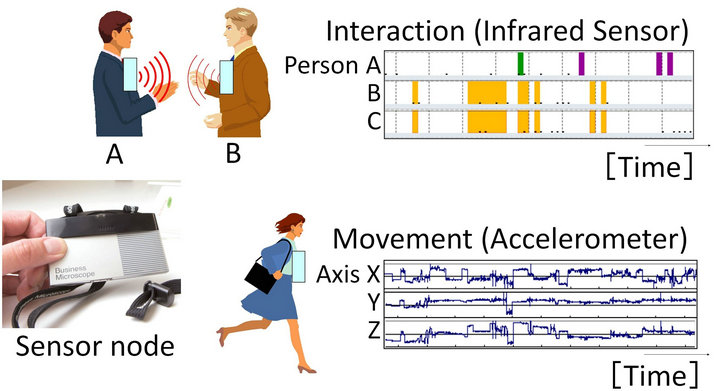
Figure 2. Business microscope sensor and its data acquisition.
thus attained and the dynamics of a knowledge process in an organization is traced as objective, quantifiable data. This measurement is superior to the ordinary surveybased method in terms of accuracy, objectivity, and unobtrusiveness to subjects.
As for the knowledge generated and externalized in an organization, the update history of documents is traced. The process of externalization and utilization is identified from the date of issue and revision of documents. It is important to understand usage and update of externalized knowledge objectively because creation and utilization of knowledge has an essentially recursive nature.
2.3. Identifying Patterns from the Behavioral Data
In the next step of KPD, meaningful behavioral patterns are extracted from objectively captured data. To extract patterns from complicated behavioral data effectively, an organizational chart is employed as a pattern-extraction framework. KPD analysis uses a member’s role in an organization (as noted on an organizational chart) as a reference (Figure 3). A behavioral pattern is extracted by comparing the measured interaction data (Figure 3(b)) and assigned hierarchical role on the organizational chart (Figure 3(a)), namely, top and middle managers, lower leaders, frontline workers, etc.
An organizational chart is a diagram that shows the structure and role of an organization. Traditionally, to control the amount and flow of information and knowledge adequately on the basis of the limited rationality of people’s decision making, an organizational task is broken down according to each member hierarchically [26]. Galbraith states that the critical limiting factor of an organization is the ability to handle non-routine events that cannot be anticipated or planned for [27]. Firms can therefore reduce uncertainty through better planning and coordination, often by imposing rules or goals.
Though roles and tasks in an organization are designed on an organizational chart, a non-described knowledge process such as face-to-face interaction, knowledge ex-
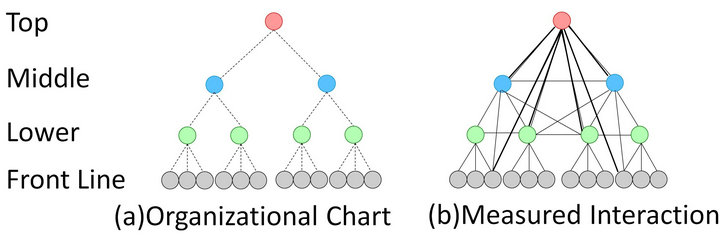
Figure 3. Comparison of organizational chart and interaction data on it.
ternalization and utilization is a key factor in decisionmaking agility and output. In other words, a knowledge process is thought of as a resource-allocation activity of tacit and explicit interactions within a certain temporal limitation. KPD analysis thus identifies knowledge resources, such as relationships, socio-cultural values, knowledge flows, routines, that have traditionally been difficult to assess [28].
2.4. Understanding a Knowledge Process
After the behavioral patterns are clarified, the underlying causal architecture is clarified as the final step of KPD analysis. Constructing a causal architecture requires combining mutual feedback between entities. A causalloop diagram, a systems-thinking tool, is suitable for representing combinations of causations between entities that compose a system [29,30]. When this tool is used, a knowledge process can be represented as a sequence of feedback loops. Understanding the dynamics underlying organizational behavioral patterns affects mental models. People tend to see what they believe, not to believe what they see. To avoid traps like this, a causal-loop diagram is known to be an effective tool to deal with structural issues that require a broader perspective [22]. Applying this tool to knowledge-process change, a manager can objectively reflect on organizational behavioral dynamics.
From the viewpoint of managers, each member’s decision making and interactions, knowledge flow, and feedback are clarified and redefined. Even inexperienced managers will thus be able to identify problems and measures concerning their organization’s knowledge process and to promote knowledge-process change with confidence.
3. Demonstration of KPD: Analyzing Knowledge Processes of Product-Design Organizations
3.1. Product-Design Organizations
To demonstrate the effectiveness of KPD analysis, it was applied to a product-design task. First, two product-design “organizations” (i.e., groups), having similar tasks and organizational structure, in the same company were analyzed by KPD analysis. Then, the results of the KPD analysis were evaluated from the viewpoint that an inexperienced manager in the target organization is able to utilize the results and successfully identify issues and measures concerning process change.
The target organizations, called “A” and “B” hereafter, deal with make-to-order infrastructure products and rely heavily on technological knowledge. The organizations have a total of 91 people (organization A: 47; organization B: 44) and turn out products in a roughly 1-to- 1.5-year cycle. The target organizations are summarized as follows.
• Task: Product design for infrastructure systems
• Number of people: 91 (organization A: 47; organization B: 44)
• Measurement period: 4 weeks The size of the target organization is appropriate for KPD analysis because the effective range of organization size is assumed to be more than 20 people, and the organization has multiple hierarchies, in which managers will have difficulty grasping the activity of each worker. KPD analysis requires behavioral measurement long enough to capture the normal state of the organization. In this demonstration, it was decided to conduct behavioral measurement for four weeks after it was confirmed that four weeks is long enough to capture the general state of the design-task activity in consideration of temporal absence of engineers for business trips, etc.
Organizations A and B design the parts of a large-scale infrastructure system and have similar organizational structure and number of people. They are therefore suitable for comparing each other’s knowledge process. Organization A has already improved the efficiency and speed of the design process by systematic knowledge management (KM) efforts. As a consequence of this effort, junior engineers in organization A are able to finish a design task in one to one-and-a-half months, which had taken skilled engineers two to three months. These KM efforts are described in detail in Subsection 3.2.2.
3.2. Results of Measurement
3.2.1. Objective Measurement of Face-to-Face Interaction
Face-to-face interactions at organizations A and B were measured with Business Microscope for four weeks as follows. First, the amount of face-to-face interaction between people was calculated and sorted into a matrix form, as shown in Figure 4. The measurements were then mapped onto the organizational charts (top manager, middle leaders, lower leaders, and frontline workers, shown from the top), as shown in Figure 5. The thickness of the line connecting people shows the total sum of interaction time over the measurement period. The resulting figure indicates that organization B has more in

Figure 4. Face-to-face interaction time (min./4-week) between people in a matrix form.
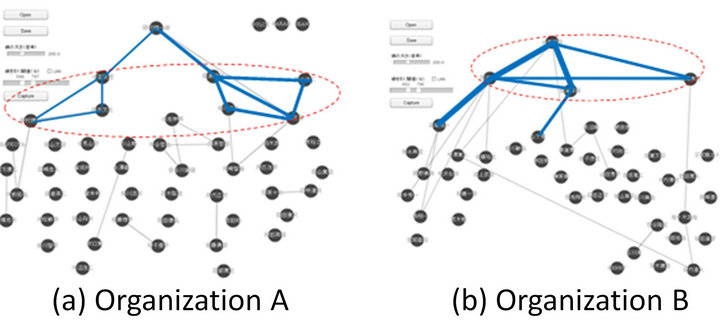
Figure 5. Face-to-face measurement results mapped on organizational charts of organizations A and B.
teractions in the top-middle leader layer than organization A.
Quantitative analysis of the interactions is provided by the business microscope. Comparing organizations A and B reveals that each hierarchical layer has typical characteristics as follows:
• The top of organization A spends about twice as much time interacting with lower leaders than with middle leaders, whereas the top of organization B spends most of the time interacting with middle leaders (i.e., immediate subordinates).
• The middle leaders in organization A, compared with those of organization B, interact less with other middle leaders and others (i.e., subordinates of the horizontal lower leaders).
• The lower leaders in organization B interact less with horizontal lower leaders and spend more time interacting with their boss (the top) instead.
• Comparing upstream groups with similar functions in each organization reveals that the frontline workers of organization A interact less with their boss and other groups than those equivalents of organization B. Interaction time between the frontline workers and their boss in the case of organization B is shorter than that in the case of organization A, though organization B interacts more frequently.
3.2.2. Objective Measurement of Externalized Knowledge Activities
As a part of a knowledge process, KM activity regarding externalized knowledge accumulated as documents was analyzed at both organizations A and B. The purpose of externalized-knowledge management in the target organization is to externalize the latest customer demand and its technology solution from the viewpoint of future reusability. Results of tasks are reflected and described in task-navigation sheets, which are expected to be reused and modified by adding shortcomings. Newly gained knowledge in each task is thus documented to make atypical tasks typical. The task-navigation sheets have linkage to other rules and regulations to exclude ambiguity so that they can be easily used by less-experienced workers. Moreover, unlike a fixed operation manual, they are intended to achieve incremental improvement by engineers. This means that the sheets are reviewed and modified after every usage by users and their boss. KM activity thus intends that the sheets receive as many feedbacks as possible to make them updated and reliable.
Trend concerning issue number and revision dynamics of the navigation sheets at organizations A and B were analyzed (Figure 6). It is apparent that organization A has more revision histories than organization B. Organization A has 743 revision counts, compared to 244 counts in the case of organization B. Moreover, the update cycle of organization A (23.32 days) is shorter than that of organization B (57.11 days). Organization A thus has approximately three-times-more revision counts and a 2.45-times-shorter update cycle. In summary, organization A is more active than organization B in externalizing tacit knowledge into explicit knowledge. In organization B, few groups, such as B4 in Figure 6(b), are active in regard to externalization, and revision is stalled in B6. As clearly seen from the externalized-knowledge-usage process, organization A uses a different process compared to organization B.
3.2.3. Field Observation
Field observation was applied to a portion of leaders and frontline workers significantly affected by the knowledge process. This observation intended to assist interpretation of the objective data measured by Business Microscope and document-update history.
The field observation revealed that in organization B, frontline workers with little experience frequently asked their leader questions. This finding coincides with the result of face-to-face measurement, that is, their interactions are short and frequent. This coincidence is interpreted as follows. Frontline workers in organization B have to look for ways to advance their tasks step by step, because organization B has less externalized knowledge for frontline workers to rely on. On the contrary, in organization A, frontline workers externalize gained knowledge regularly through a standardization process. Moreover, they positively revise the navigation sheets, because they fully understand the advantage of doing tasks on their own to save time. Their interactions with the leaders are less frequent, although they apparently have longer and deeper discussions each time they do interact.
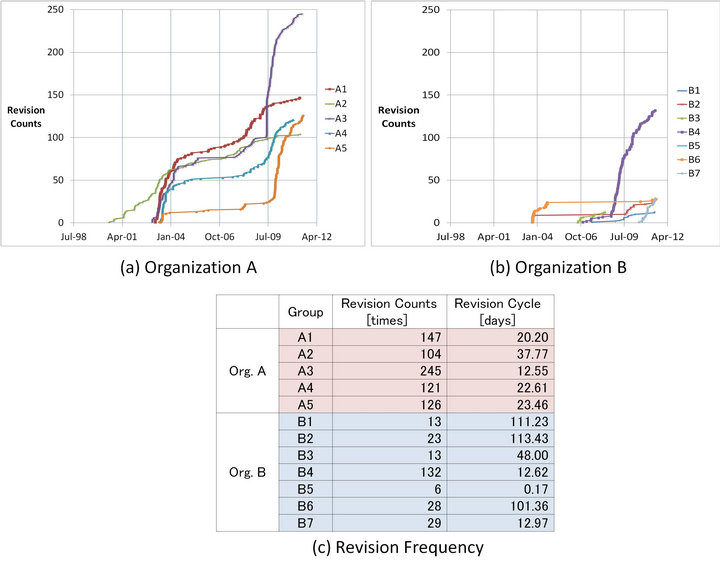
Figure 6. Trends concerning issue count and revision dynamics of task-navigation sheets.
The top leader of organization A delegates his decision making to the middle leader and spends time on developing the lower leader’s skills. The lower leaders of organization A control their own task and their subordinates’ tasks and take care of developing ability of their subordinates, not just focusing on executing current tasks. In contrast, the top leader of organization B is hardpushed to manage current tasks and is busy attending meetings, so he has less time for encouraging subordinates. In addition, in organization B, complicated directions from multiple leaders confuse the front-line workers.
In summary, organization A, which attains higher performance than organization B, is clearly superior in terms of interaction behaviors between people and utilization of externalized knowledge.
3.3. Pattern Analysis of Organizational Activities
To extract patterns from the behavioral data, objective behavioral data is mapped on the organization hierarchy. It is natural to assume that organizations having similar tasks but different performance have different interaction patterns between hierarchies. The following interaction patterns were extracted:
• Organization B has intense interactions between topmiddle and middle-middle layers, whereas organization A has more interactions in the middle-lower layer. This means organization B has “interaction centrality” (i.e., balance of interaction) in the upper portion of the hierarchy, and organization A has interaction centrality in the middle of the hierarchy, as shown in Figure 7.
• The lower leaders in organization B are too busy connecting frontline workers and middle leaders to tackle future strategic activities, such as talent development and next-generation products.
• In organization A, frontline workers make the most of externalized knowledge and try to codify the tacit experience gained during their tasks, leading to continual development of organizational knowledge. On the contrary, in organization B, activity regarding tasknavigation sheets is low (except in one group).
This difference in interaction centralities in the cases of organizations A and B can be interpreted as follows. Organization A is well prepared for uncertainty regarding the future compared to organization B. Generally speaking, a hierarchical organization aims at planning their task and coordinating irregularity. This means that decision making at the higher level of hierarchy of the organization is required when there is less preparedness for uncertainty in the organization. Having more readiness for uncertainty requires efficient decision making at the lower levels of hierarchy.
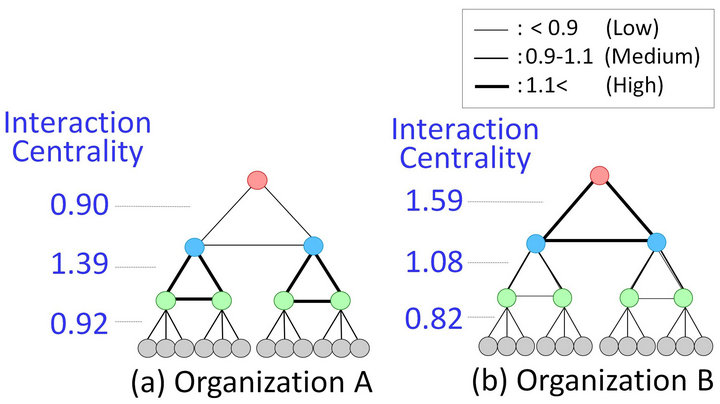
Figure 7. Comparison of interaction centrality.
Moreover, usage of externalized knowledge affects behavioral patterns when tasks are executed. The frontline workers in organization A autonomously execute their tasks by making the most of task-navigation sheets and have positive attitude toward updating the sheets. The frontline workers in organization B are busy searching for documents and acquiring the un-codified individual skills needed to advance their tasks. It is apparent from these results that patterns of worker activities directly affect time-resource utilization in an organization.
3.4. Underlying Architecture Causing Interaction Patterns
After the behavioral patterns of organizations A and B were objectively clarified, system architectures underlying each behavioral pattern were analyzed. A system architecture is intended to describe connections and interactions between entities. The top manager, middle, and lower leaders as well as the frontline workers are the primal entities that interact in the knowledge process. Externalized knowledge (EK) plays an important role in this process. The relations between these entities are described in a causal-loop diagram.
For analyzing the underlying architecture of behavioral patterns, knowledge accessibilities and time-resource utilization are considered as follows. Frontline workers (FLWs) have two choices when they need to acquire unknown knowledge: Ask people having the knowledge or utilize EK. A causal-loop diagram describing organization B’s process, in which FLWs rely on lower leaders and under-utilize EK, is shown in Figure 8. This diagram shows that lower leaders (LL) in organization B have to give directions to FLWs or deal with frequent questions from FLWs. These interactions between FLWs and LLs deprive LLs of time, and unexpected interruptions from FLWs cause loss of efficiency due to segmentation of work. As a result, the LLs are unable to find time for decision making, externalization, and creative dialog for future strategies.
A causal-loop diagram of organization A’s process is shown in Figure 9. The FLWs are encouraged to utilize
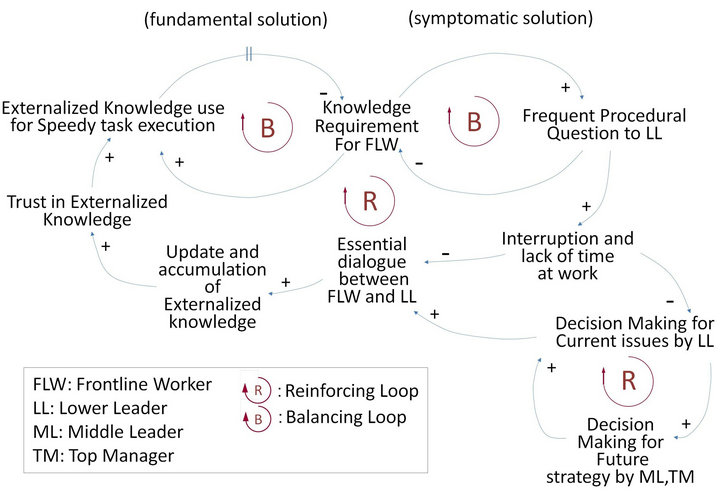
Figure 8. Causal-loop diagram describing knowledge process dynamics of organization B.
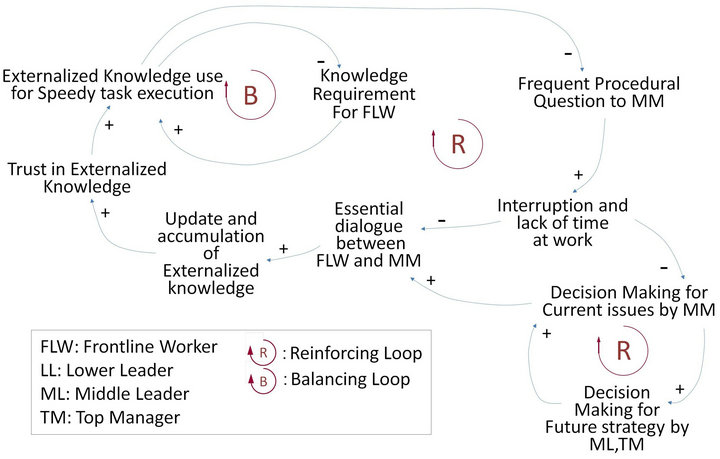
Figure 9. Causal-loop diagram describing knowledge process dynamics of organization A.
EK to execute their tasks independently, leading to more efficient task execution and releasing time for LLs. The gained time of FLWs and LLs is effectively used for reflecting on their tasks and externalizing knowledge. More externalization and updating of knowledge lead to more trust and utilization in the form of a reinforcing spiral loop. The gained time of LLs is used for decision making that has been done by the top manager to middlelower layer; thus, the top manager has more resources for future strategic activities.
To sum up, KPD analysis was successfully applied to product-design organizations and shown to be effective for analyzing knowledge-process dynamics on the basis of objective behavioral data.
3.5. Identifying Problems and Measures Concerning Knowledge-Process Change
Problems and measures concerning a knowledge process are identified on the basis of the results of KPD analysis with the help of the system archetypes (which are known to be common patterns of behaviors of a system) [31]. The causal-loop diagram of organization B is compared to that of organization A (namely, the ideal behavioral model). The causal-loop diagram of organization B is similar to that of a system archetype called “shifting the burden”, which is a structure that employs short-term remedies at the expense of long-term solutions (namely, knowledge externalization and usage, as a fundamental solution, is neglected. Instead, dependence on individual knowledge, as a symptomatic solution, is prioritized). As a result of the side effect of this archetype, organizational-knowledge accumulation is prohibited, leading to inefficiency of task execution.
When looking at causal-loop diagram of organizations A and B, it becomes clear that document-update activities (which are a fundamental solution to the causal-loop diagram of organization B) are the main difference. It can be considered that these activities are sustainable measures taken by organization B for knowledge-process change. Implementing knowledge externalization and updating documents will lead to less dependence on individual un-codified knowledge from the viewpoint of midto long-term efficiency.
Applying the understanding of a knowledge process provided by KPD analysis, the top manager of organization B became aware of the importance of a mid-term view of his own organization and decided to undertake the following knowledge-process changes.
• Reinforce process-improvement activities regarding task-navigation sheets.
• Delegate decision making to middle and lower leaders, simplifying top-down instructions.
• Focus on training lower leaders and frontline workers.
As explained above, KPD analysis enables inexperienced managers to understand a knowledge process and to identify problems and measures for process change, which have been difficult tasks without skilled managers’ experience and intuition.
4. Discussion
By applying KPD analysis to product-design organizations, it was possible to distinguish and explain successfully knowledge processes, which contains tacit and intangible behavioral dynamics of organizations A and B, by objective data and causal-loop diagrams. As an advantage of utilizing objective data, a new metric called “interaction centrality” for comparing the behavioral differences between organizations A and B was developed. KPD analysis thus enables comparison of different organizational processes under a common view of organizational hierarchy.
The usefulness of KPD analysis was demonstrated by the fact that a junior manager of organization B was able to identify problems and measures for knowledge-process change. Managers or KM practitioners will be able to understand knowledge-process-related behavior and carry out successful change management by comparing their knowledge process and best practices by using KPD analysis. From the viewpoint of behavioral-resource utilization, KPD analysis enables assessment of organizational processes, which have been considered to be local, contextual, and tightly coupled to culture.
The above-mentioned features of objective and quantitative data acquisition affect the accuracy of behavioral measurement. KPD analysis utilizes wearable sensors to obtain objective activity data automatically. To diminish the wearer’s privacy concerns, privacy issues should therefore be taken care of and the purpose of data usage should be clarified. Individual physical and habitual differences as well as environmental characteristics also affect the data acquisition—which will be unreliable when sensor wearers interact with people without a sensor. However, under certain conditions, a sensor tool that can detect interactions automatically and quantitatively has many advantages over ordinary survey methodology in the case of data collection.
Although building causal-loop diagrams from data and finding measures requires a certain level of expertise, well-known system archetypes and their remedies can be utilized as powerful references [31]. As another method for modeling knowledge process, an ontological shift SECI model, which traces knowledge-creation activities occurring in various ontological entities, was proposed by Wu et al. [15]. Though this model attempts to diagnose problems and shortcomings in a knowledge-creation-related project, it merely visualizes key activities and identifies symptomatic solutions at most. In contrast, KPD analysis aims at providing fundamental solutions by clarifying dynamics of a knowledge process through objective behavioral data.
In summary, KPD analysis enables inexperienced managers to gain insights into new spiral processes by understanding dynamics of their own knowledge process. This idea behind this possibility relates strongly to the theory of knowledge creation, which handles dynamic and spiral development of activities. Moreover, it brings the possibility of an entirely new knowledge management, in that people at different hierarchical levels understand the knowledge process and cooperate toward improving their organization in a self-organizing way, unlike ordinary top-down management.
5. Conclusions
A novel methodology called “knowledge process dynamics” (KPD) analysis is proposed. In KPD analysis, behavior of people is measured objectively by wearable sensors, and externalized knowledge utilization is measured according to document update history. Behavioral patterns are identified from the measurements. The extracted behavioral patterns are formed into a causal-loop diagram, which effectively explains behavioral dynamics in the context of the knowledge process. KPD analysis thus clarifies the dynamics of the knowledge process and makes the knowledge process understandable and manageable even for inexperienced managers.
KPD analysis was applied to product-design organizations to demonstrate its usefulness and effectiveness. The understanding of behavioral dynamics described by a causal-loop diagram successfully helped a junior manager to find problems and measures related to knowledge management. Although KPD analysis is proven to be practical and ready for usage for helping managers in identifying problems and measures for changing the knowledge process, the proposed methodology utilizes wearable sensors to obtain objective activity data automatically. Privacy issues should therefore be taken care of and the purpose of data usage should be clarified to diminish a wearer’s privacy concerns. This work will lead to a new paradigm for understanding a knowledge process by replacing ordinary survey methods, which have unavoidable cognitive limitations. This study on KPD analysis is limited from the aspect that it targeted a large-scale product-design organization, although other types of organizations should also be studied to gain generalization of KPD analysis.
6. Acknowledgements
We would like to thank all the members of the SocioInfo Project, led by Hitachi High-Technologies and Hitachi Central Research Laboratory, for their useful comments and technical support.
REFERENCES
- P. Drucker, “The Age of Discontinuity: Guidelines to Our Changing Society,” Harper & Row, New York, 1968.
- M. Alavi and D. E. Leidner, “Review: Knowledge Management and Knowledge Management Systems: Conceptual Foundations and Research Issues,” MIS Quarterly, Vol. 25, No. 1, 2001, pp. 107-136. doi:10.2307/3250961
- I. Nonaka, R. Toyama and T. Hirata, “Managing Flow: A Process Theory of the Knowledge-Based Firm,” Palgrave MacMillan, New York, 2008.
- A. H. Gold, A. Malhotra and A. H. Segars, “Knowledge Management: An Organizational Capabilities Perspective,” Journal of Management Information Systems, Vol. 18, No. 1, 2001, pp. 185-214.
- L. Edvinson and M. Malone, “Intellectual Capital,” Harper Business, New York, 1997.
- D. J. Teece, “Capturing Value from Knowledge Assets: The New Economy, Markets for Know-How, and Intangible Assets,” California Management Review, Vol. 40, No. 3, 1998, pp. 55-78. doi:10.2307/41165943
- M. H. Zack, “Managing Codified Knowledge,” Sloan Management Review, Vol. 40, No. 4, 1999, pp. 45-58.
- I. Nonaka, “A dynamic Theory of Organizational Knowledge Creation,” Organization Science, Vol. 5, No. 1, 1994, pp. 14-37. doi:10.1287/orsc.5.1.14
- I. Nonaka and H. Takeuchi, “The Knowledge Creating Company: How Japanese Companies Create the Dynamics of Innovation,” Oxford University Press, New York, 1995.
- J. A. Johannessen, J. Olaisen and B. Olsen, “Mismanagement of Tacit Knowledge: The Importance of Tacit Knowledge, the Danger of Information Technology, and What to Do about It,” International Journal of Information Management, Vol. 21, No. 1, 2001, pp. 3-20. doi:10.1016/S0268-4012(00)00047-5
- R. R. Nelson and S. G. Winter, “An Evolutionary Theory of Economic Change,” Harvard University Press, Cambridge, 1982.
- C. M. Christensen, “The Innovator’s Dilemma,” Harvard Business School Press, Boston, 1997.
- D. W. De Long and L. Fahey, “Diagnosing Cultural Barriers to Knowledge Management,” The Academy of Management Executive, Vol. 14, No. 4, 2000, pp. 113-127.
- R. Hinds and J. Aronson, “Developing the Requisite Organizational, Attitudinal, and Behavioral Conditions for Effective Knowledge Management: A Review of Current Research,” Proceedings of the 8th Americas Conference on Information Systems, Dallas, 9-11 August 2002, pp. 2059-2065.
- Y. Wu, D. Senoo and R. Magnier-Watanabe, “Diagnosis for Organizational Knowledge Creation: An Ontological Shift SECI Model,” Journal of Knowledge Management, Vol. 14, No. 6, 2010, pp. 791-810. doi:10.1108/13673271011084862
- E. C. Martins and H. W. J. Meyer, “Organizational and Behavioral Factors That Influence Knowledge Retention,” Journal of Knowledge Management, Vol. 16, No. 1, 2012, pp. 77-96. doi:10.1108/13673271211198954
- R. Ruggles, “The State of the Notion: Knowledge Management in Practice,” California Management Review, Vol. 40, No. 3, 1998, pp. 40-54. doi:10.2307/41165944
- W. Bukowitz and G. Petrash, “Visualizing, Measuring, and Managing Knowledge,” Research Technology Management, Vol. 40, 1997, pp. 24-31.
- D. Carlucci, B. Marr and G. Schiuma, “The Knowledge Value Chain: How Intellectual Capital Impacts on Business Performance,” International Journal of Technology Management, Vol. 27, No. 6-7, 2004, pp. 575-590. doi:10.1504/IJTM.2004.004903
- C. G. Riera, D. Senoo and J. Iijima, “A Study of the Effect of Knowledge Creating Capabilities on Corporate Performance,” International Journal of Knowledge Management Studies, Vol. 3, No. 1-2, 2009, pp. 116-133. doi:10.1504/IJKMS.2009.023485
- R. Magnier-Watanabe and D. Senoo, “Shaping Knowledge Management: Organization and National Culture,” Journal of Knowledge Management, Vol. 14, No. 2, 2010, pp. 214-227. doi:10.1108/13673271011032364
- P. M. Senge, “The Fifth Discipline: The Art and Practice of the Learning Organization,” Currency Doubleday, New York, 1990.
- P. Drucker, “The Effective Executive,” Harper & Row, New York, 1966.
- M. Csikszentmihalyi, “Flow: The Psychology of Optimal Experience,” Harper & Row, New York, 1990.
- Y. Wakisaka, K. Ara, M. Hayakawa, Y. Horry, N. Moriwaki, N. Ohkubo, N. Sato, S. Tsuji and K. Yano, “BeamScan Sensor Node: Reliable Sensing of Human Interactions in Organization,” Proceedings of the 6th International Conference on Networked Sensing Systems, Pittsburgh, 17-19 June 2009, pp. 58-61. doi:10.1109/INSS.2009.5409953
- H. A. Simon, “Administrative Behavior,” The Free Press, New York, 1976.
- J. R. Galbraith, “Organization Design: An Information Processing View,” Interfaces, Vol. 4, No. 3, 1974, pp. 28- 36. doi:10.1287/inte.4.3.28
- A. Lerro, F. A. Iacobone and G. Schiuma, “Knowledge Assets Assessment Strategies: Organizational Value, Processes, Approaches and Evaluation Architectures,” Journal of Knowledge Management, Vol. 16, No. 4, 2012, pp. 563-575. doi:10.1108/13673271211246149
- J. W. Forrester, “Principles of Systems,” 2nd Edition, Productivity Press, Portland, 1968.
- J. D. Sterman, “Business Dynamics: Systems Thinking and Modeling for a Complex World,” Irwin/McGraw-Hill, New York, 2000.
- E. F. Wolstenholme, “Towards the Definition and Use of a Core Set of Archetypal Structures in System Dynamics,” System Dynamics Review, Vol. 19, No. 1, 2003, pp. 7-26. doi:10.1002/sdr.259
NOTES
*Corresponding author.