Journal of Biomedical Science and Engineering
Vol.6 No.3A(2013), Article ID:29484,8 pages DOI:10.4236/jbise.2013.63A041
Lesion contrast differences in MRI sequences in multiple sclerosis: Correlation to clinical disability
![]()
1Medical Imaging Centre, Department of Radiology, Tampere University Hospital, Tampere, Finland
2Department of Neurology and Rehabilitation, Tampere University Hospital, Tampere, Finland
3Department of Neurology, Kanta-Häme Central Hospital, Hämeenlinna, Finland
4Tampere Medical School, Tampere, Finland
Email: *maija.rossi@pshp.fi
Received 11 December 2012; revised 13 January 2013; accepted 21 January 2013
Keywords: Magnetic Resonance Imaging; Multiple Sclerosis; Imaging Sequences
ABSTRACT
The purpose of this study was to analyze the lesion brightness (image contrast) in multiple MRI sequences in patients with relapsing-remitting MS (RRMS), secondary progressive MS (SPMS), primary progressive MS (PPMS), and clinically isolated syndrome (CIS); and to correlate the lesion contrast with lesion volumes and neurological disability. MRI examination at 1.5 T was performed on 80 patients with RRMS, SPMS, PPMS, or CIS. The protocol included T1- and T2-weighted spin echo (SE), fluid attenuated inversion recovery (FLAIR), T1-weighted SE with magnetization transfer preparation, and diffusion weighted imaging (DWI). Contrast was measured between MS lesions and normal appearing white matter. Lesion volume was calculated in T1-weightedand FLAIR-images. All patients were examined neurologically including evaluation of expanded disability status scale (EDSS) score. Lesion contrast correlated with total brain lesion volume (p = 0.000 - 0.040). In patients with low EDSS, three sequences were able to differentiate between CIS and RRMS. SPMS and PPMS were separated by DWI. Lesion contrast correlated with EDSS score on T1-weighted imaging, with or without magnetization transfer preparation. Patient age correlated with lesion contrasts. Contrast measurements seem limited in radiological and clinical diagnosis of MS in reference to disease course, its activity and progression. The differentiation between MS subgroups might improve at 3 T and could help in leading to earlier treatment of the disease.
1. INTRODUCTION
Multiple sclerosis (MS) is an autoimmune disease of the central nervous system and it is characterized by complex pathophysiological processes including inflammation, demyelination, axonal loss, and remyelination [1]. MS lesions are commonly seen in the cerebral hemispheres, brain stem, and cervical part of spinal cords myelin. The initial onset of symptoms usually occurs between 20 - 40 years of age.
The disease develops gradually, and symptoms often present with seemingly unrelated timing and distribution. MS can be divided into different stages. In clinically isolated syndrome (CIS), the patient does not fulfill the international criteria for MS, i.e., the revised McDonald criteria [1-3], but 30% - 70% of these patients develop MS later on [4]. In relapsing-remitting MS (RRMS), there are phases of rapid disease progression, but the inflammation is reversible and is followed by periods of neurological improvement without development of new symptoms. RRMS usually progresses into secondary progressive MS (SPMS), characterized by gradual increase of neurological disability without clinical relapses. In some patients, the disease course continually progresses from the beginning, and is referred to as primary progressive MS (PPMS). These patients have a worse prognosis than in RRMS. The neurological disability of MS is evaluated by expanded disability status scale (EDSS).
Radiologically, MS is imaged using a variety of magnetic resonance imaging (MRI) sequences. More lesions can be detected at 3 Tesla (T) than at 1.5 T [5,6]. However, 1.5 T is more commonly available than 3 T. Consequently, imaging is usually performed on 1.5-T scanners. The MRI protocol for MS patients usually includes T1- and T2-weighted spin echo (SE), the former of which can be performed three-dimensionally [7], fluid attenuated inversion recovery (FLAIR), and occasionally, T1- weighted imaging with magnetization transfer (MT) preparation. Since the last decade the protocol is increasingly accompanied by diffusion weighted imaging (DWI) [8,9].
Several studies have investigated various MRI characteristics of MS patients. These studies have revealed tissue alterations, such as changes in both normal appearing brain tissue and lesions, in magnetization transfer ratio (MTR) [10,11]. In addition, abnormal brain iron deposits in the putamen and thalamus have been measured as T2 decrease [12-16] or phase development [17,18]. Studies of the most conventional imaging sequences, i.e., T1- and T2-weighted SE, have mainly focused on number of lesions and lesion volume, along with brain atrophy [19- 23]. Also the use of a composite score of MRI measures has been proposed [24]. Although semi-automatic software has been developed to assess volume information [25-27], volumetric measurements are time-consuming and, therefore, a poor fit for clinical environment.
Easily accessible parameters, such as a rapid measurement of signal intensity, S, and calculation of lesion contrast,  , where Sa and Sb are the signal intensities of structures a and b, respectively, are better suited for clinical purposes, as long as they provide pertinent information about the disease. Interest in this type of measurement was first seen in the late 1990s [28-30]. Contrast was measured on film and the results were supported with biopsy or post-mortem studies. MTR and the degree of hypointensity in T1-weighted images were shown to correlate with axonal density. However, no recent reports with digital MR images are available.
The purpose of this study is to compare multiple standardized MR imaging sequences and investigate the relationship between lesion contrast attributes, volumes, and clinical characteristics of the patients.
2. PATIENTS AND METHODS
This study included 98 patients with three different subtypes of MS and CIS. All patients underwent thorough neurological examination, including evaluation of EDSS score. The neurological evaluation was performed by the same experienced neurologist (M. Ra.), and the diagnosis was based on the revised McDonald criteria [3]. The patients did not have active lesions at the time of imaging. Each of the four subgroups (CIS, RRMS, SPMS, PPMS) had a minimum of 20 patients and thus, for this paper we included 20 patients of each subgroup. Within subgroups where more patients were available, the most recent patients were selected. These 80 patients (male: female = 23:57, age range 18 - 73 years, mean age 45 years) underwent MRI examination. Main patient characteristics are presented in Table 1. Age is listed at the time of imaging. The study was approved by the Hospital Ethics Committee, and all patients gave written informed consent.
2.1. MRI Protocol
Imaging was performed with a 1.5 T MRI unit (Siemens Avanto, Erlangen, Germany). Imaging parameters are presented in Table 2. Due to limitations in specific absorption rate (SAR), slight modifications had to be made in a few patients concerning repetition time (TR) and echo time (TE). T1-weighted MP-RAGE was acquired once without, and once with the intravenous contrast agent gadoterate meglumine (Gd-DODA; Dotarem® 10 ml). In T2-weighted SE, time savings were accomplished using fast recovery mode which uses spoiler gradients at the end of the relatively short TR period. For scientific studies on MS patients, the MTR is often calculated; this measurement, however, requires acquisition of two image sets, one with and one without the off-frequency preparatory pulse. Due to time limitations in clinical environments, in this study we wanted to see if T1-weighted imaging with MT preparation alone, omitting the sequence without off-frequency pulse, correlates with clinical data.
2.2. ROI Localization
In each patient, two MS lesions were selected for signal
Table 1. Patient characteristics. Median (and range) values given.
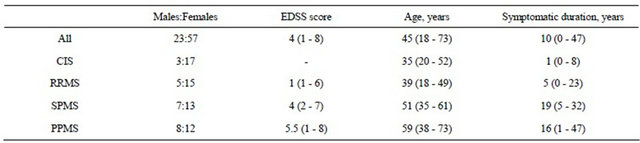
CIS = clinically isolated syndrome; RRMS = relapsing-remitting multiple sclerosis; SPMS = secondary progressive MS; PPMS = primary progressive MS; EDSS = expanded disability status scale.
Table 2. Typical imaging parameters.
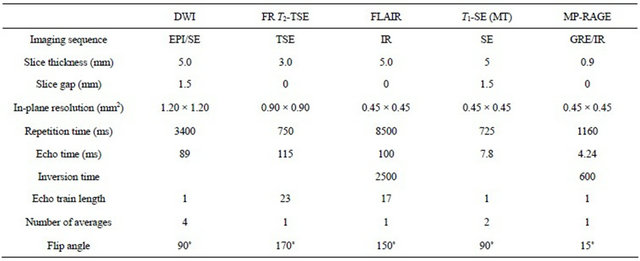
DWI = diffusion-weighted imaging; FR = fast recovery; EPI = echo planar imaging; (T) SE = (turbo) spin echo; FLAIR = fluid attenuated inversion recovery; IR = inversion recovery; MT = magnetization transfer; MP-RAGE = magnetization prepared rapid acquisition gradient echo; GRE = gradient echo.
analysis: one in the cerebral hemisphere and one in the infratentorial compartment of the brain. The largest lesions, shown most clearly in each imaging sequence, were selected. All images were analyzed by the same person (M.Ro.) under the supervision of an experienced neuroradiologist (P.D.).
For each lesion, the signal intensity was measured in three regions of interest (ROI) within the same slice: 1) within the lesion, 2) in adjacent normal appearing white matter (NAWM) next to the lesion, and 3) in the lesioncorresponding contralateral NAWM region (Figure 1). Whenever possible, lesions with a corresponding lesionfree region in the contralateral hemisphere were selected; if this was not possible, slight divergence from the corresponding contralateral region was permitted to identify an area of normal-appearing tissue. In all contralateral NAWM ROIs (3), there were no MS lesions within 15 mm of the ROI. Although patients with CIS did not fulfill the revised McDonald criteria for MS disease of nine detectable lesions, all CIS patients included in this study did have at least one or two detectable lesions in the cerebral hemispheres and infratentorial compartment of brain.
2.3. Analysis Methods
Due to the non-quantitative nature of the MRI sequences, direct comparisons of the signal intensities among individuals were not conducted. This type of comparison likely would have led to an error due to variations in not only from examination to examination and patient to patient, but also in the same examination from slice to slice. Instead, we analyzed contrast,
 ,
,
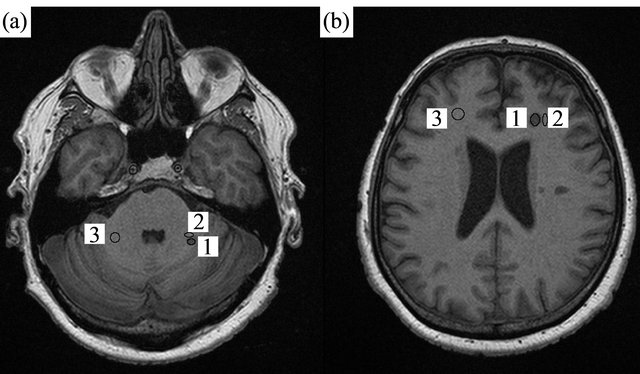
Figure 1. Region of interest (ROI) setting is presented for lesions (1), adjacent normal-appearing white matter (2), and contralateral white matter (3) in two slices of a T1-weighted image of a 54-year-old male with secondary progressive multiple sclerosis.
where Sa and Sb are the signal intensities of regions a and b, respectively, within the same slice. Although contrast is conventionally measured between two adjacent tissues, we also made comparisons to the contralateral hemisphere.
Total lesion volume was measured in T2-weighted FLAIR and T1-weighted SE images, and brain atrophy in T2-weighted SE images, using an enhanced version of the calibrated semi-automatic segmentation software AnatomaticTM 2.23 [18,24,31,32].
Normality of distributions was analyzed according to Kolmogorov-Smirnov test. Comparisons between MS subgroups were analyzed with ANOVA tests. Correlations between contrast and each brain atrophy, age, and disease duration were calculated using Pearson’s correlation. Due to skewed distributions, shown by the Kolmogorov-Smirnov test, correlations between contrast and both lesion volume and EDSS scores were calculated using Spearman’s rho correlation. Comparisons between MRI sequences were performed with student’s paired t-test or, in case of non-Gaussian contrast distribution within the patient group, with Wilcoxon signed ranks test. All statistical calculations were computed with SPSS 17 (SPSS Inc., Chicago, Illinois, USA). P-values of less than 0.05 were considered statistically significant for n = 80 and p-values less than 0.01 for n = 20.
3. RESULTS
3.1. MRI Contrast and Lesion Volume
Lesion contrast was slightly correlated with both T1- weighted and FLAIR lesion volume (Table 3). Brain atrophy was not correlated with MRI-given lesion contrast.
3.2. MRI Contrast and Clinical Characteristics
MS lesion contrast to NAWM is presented in Figure 2. SPMS patients had larger lesion contrast than RRMS patients in T1-weighted MP-RAGE in the cerebral hemisphere (p = 0.040). In the infratentorial compartment of the brain the difference was significant in FLAIR (p = 0.017) between CIS and SPMS. We also grouped patients by their EDSS scores with 0 - 1.5, 2 - 4, and 5 - 8. Differentiation between RRMS and SPMS was found in patients with EDSS score between 2 and 4 (DWI: p = 0.029, T1-weighted MP-RAGE: p = 0.042).
In the cerebral hemisphere, MRI contrast correlated with EDSS scores (p < 0.01) in the total patient population in all three sequences using T1-weighted imaging: in MT-prepared T1-weighted imaging (r = −0.288), and T1- weighted MP-RAGE without (r = −0.315) and with (r =
Table 3. Correlation between lesion contrast and total lesion volume. Spearman’s rho and (p-value).

DWI = diffusion-weighted imaging; MT = magnetization transfer; T1(2)W = T1(2)-weighted image; FLAIR = fluid-attenuated inversion recovery; C = contrast agent.

Figure 2. Plaque contrast to adjacent normal appearing white matter is presented in the cerebral hemisphere and infratentorial compartment of the brain. The stars indicate statistical difference between RRMS and SPMS (*) or between CIS and SPMS (**). CIS = clinically isolated syndrome; RRMS = relapsing-remitting multiple sclerosis; SPMS = secondary progressive MS; PPMS = primary progressive MS; DWI = diffusionweighted imaging; MT = magnetization transfer; T1(2)W = T1(2)-weighted imaging; FLAIR = fluid-attenuated inversion recovery; C = contrast agent.
−0.342) contrast agent. In the subgroups of MS, there were no correlations. In the infratentorial compartment of the brain, the EDSS score correlation with lesion contrast was modest with tendencies to correlate (p < 0.05) in T2-weighted SE (r = 0.472) and T1-weighted MPRAGE (r = −0.450) in the RRMS subgroup. Generally, the tendency was towards larger lesion contrast with higher EDSS score.
3.3. MRI Contrast and Patient Age
Patient age correlated with the MRI contrast between MS lesion and both adjacent and contralateral NAWM. Older patients had higher lesion contrast in the cerebral hemispheres in CIS (p < 0.05, in DWI: r = 0.495, T2-weighted SE: r = 0.560, T1-weighted MP-RAGE: r = −0.453) and SPMS patients (p < 0.05, in DWI r = 0.462); and in the infratentorial compartment in CIS patients (p < 0.05, in T1-weighted MP-RAGE r = −0.527). However, in the infratentorial compartment of brain reverse correlation was seen in PPMS patients (T1-weighted MT, MP-RAGE and T2-weighted SE p < 0.01). Similar correlation was measured in the lesion contrast contralateral NAWM.
4. DISCUSSION
The immune-mediated MS disease is primarily characterized by inflammation and demyelination, followed by neurodegeneration, including axonal degeneration and neuronal loss [33]. Besides visible lesions, also NAWM represents abnormal findings in MS. This may have an effect on the ratio between lesion and NAWM. These changes can be imaged with multiple MRI sequences. In this study, we imaged 80 patients diagnosed with CIS and three different subtypes of the neuroinflammatory disease MS. Lesion contrast were associated with various clinical data. This is an on-going study that will have four years of follow-up.
Different MRI sequences, such as T1- and T2-weighted SE, MT-prepared imaging, and DWI, can be used for the diagnosis of MS. T1 is prolonged due to demyelination, inflammation, gliosis, edema, and axonal and neuronal loss and is, therefore, sensitive but not specific [34]. Its capacity to detect MS lesions is good [35] although even more lesions can be detected using T2-weighted images. There is large variation within the appearance of remyelinating lesions in T1-weighted images where hypointensity is stronger in demyelinated than in remyelinated lesions [28]. T1 contrast does not correlate with demyelination [27]; however, both T1 contrast [28-30] and MTR [30] of lesions have been shown to correlate with axonal density in post-mortem tissues. Magnetization transfer depends on interactions of water with myelin and, as a result, the image reflects myelin content. T2- weighted images, though sensitive to detecting MS lesions, are also non-specific in lesion characterization, except in the early stages [28,36]. With its short component (<30 ms), T2 reflects the myelin density of MS lesions [37,38]. DWI is sensitive in detecting lesions where myelin destruction has led to increased apparent diffusion coefficient (ADC) and decreased fractional anisotropy (FA). However, this method lacks specificity because it reflects each demyelination, gliosis, inflammation, axonal contraction, and axonal loss [39]. Therefore, MS lesions on MRI are non-specific, and furthermore, not biopsy-proven. This is a known but acceptable drawback of the McDonald criteria [1-3].
Three earlier studies [28-30] have thoroughly investigated the lesion contrast of several lesions in each patient. Therefore it might be argued whether selecting only two lesions, though the best distinguishable, in each patient is sufficient for a reliable analysis. However, due to the fact that no active lesions were present, we hypothesized that these were sufficient for describing the state of the disease. These lesions were large representative lesions, selected by the same reader over a short time period to be consistent. Furthermore, in several patients it would have been difficult to find more suitable lesions because they either had so few lesions that were seen in all sequences, or, they had so many lesions that finding a healthy comparison in the contralateral hemisphere was difficult. Therefore, for consistency exactly two representative lesions were selected in all patients. Furthermore, the lesion contrast was correlated with the total lesion volume. Therefore the hypothesis that the lesion contrast may represent the disease burden of the whole brain is justified and this hypothesis was tested in this work. Evaluation of active plaques could have increased the value of this study. However, the recruited patients did not have active phases at the time of the study.
In an earlier study with DWI, MS lesions have been suggested to be more intense in SPMS than RRMS [40]. However, another study on ADC has not been able to differentiate between RRMS, SPMS, and PPMS [41]. The patients in both earlier studies had somewhat [40] or considerably [41] higher EDSS scores than our patient cohort. This may well explain the inability of ADC to differentiate between subgroups in another study with high EDSS scores [41].
No correlation has previously been found between EDSS score and MTR in SPMS [11] or RRMS [42]; although in RRMS this is controversial [10]. Our results confirm previously described data, as we only found significant correlations in the total patient population consisting of four disease subgroups but not within any single subgroup in the case of MT-prepared T1-weighted images. Mean lesion T1 has been shown to correlate with EDSS score in T1 hypointense lesions, but not in T2 lesions, in a cohort of RRMS and SPMS patients [43]. In our study, we found a similar correlation between EDSS score and decreased T1 signal intensity, i.e., prolonged T1. Similar results of T1 contrast (independent of contrast agent use) confirm the exclusion of contrast-enhancing lesions in our study. In contrast to both MT-prepared and non-prepared T1-weighted images, we found a negative correlation between EDSS score and FLAIR lesion contrast in RRMS patients. This suggests that in RRMS, myelin destruction may not increase with worsening EDSS score, perhaps due to myelin recovery between attacks. However, FLAIR is not specific to myelin content, as are DWI and T1-weighted SE with MT preparation, and this preliminary result should not lead to major conclusions.
Few studies have correlated MRI parameters with patient age in MS. Recently, though, negative correlation between lesion MTR and disease duration has been found in RRMS [42]. Also, T2 lesion volume has been associated with age at onset and disease duration [44]. In our study of CIS patients, increased lesion contrast tended to correlate with patient age in several sequences, especially in the cerebral hemispheres. Plaques showed more intensity in older patients at onset. This is probably because the demyelination process occurs faster compared to younger patients [45]. In PPMS, the negative correlation between the signal intensity changes and age may be explained by the very different disease process compared to RRMS. This could mean either less inflammatory activity or more NAWM lesions in older patients.
In conclusion, contrast measurements seem to be limited in a daily radiological and clinical diagnosis in MS disease in reference to gaining information about disease course and activity, disease severity, and therapeutic responses. However, at higher fields MRI analyses used in this study might prove helpful when differentiating MS subgroups thus enabling earlier treatment of MS disease.
5. ACKNOWLEDGEMENTS
This study was supported by the Alfred Kordelin foundation, Competitive Research Funding of the Pirkanmaa Hospital District and the Academy of Finland.
![]()
![]()
REFERENCES
- McDonald, W.I., Compston, A., Edan, G., et al. (2001) Recommended diagnostic criteria for multiple sclerosis: Guidelines from the international panel on the diagnosis of multiple sclerosis. Annals of Neurology, 50, 121-127. doi:10.1002/ana.1032
- Polman, C.H., Reingold, S.C., Edan, G., et al. (2005) Diagnostic criteria for multiple sclerosis: 2005 revisions to the “McDonald criteria”. Annals of Neurology, 58, 840-846. doi:10.1002/ana.20703
- Polman, C.H., Reingold, S.C., Banwell, B., et al. (2011) Diagnostic criteria for multiple sclerosis: 2010 revisions to the McDonald criteria. Annals of Neurology, 69, 292- 302. doi:10.1002/ana.22366
- Miller, D., Barkhof, F., Montalban, X., et al. (2005) Clinically isolated syndromes suggestive of multiple sclerosis, part I: Natural history, pathogenesis, diagnosis, and prognosis. The Lancet Neurology, 4, 281-288. doi:10.1016/S1474-4422(05)70071-5
- Sicotte, N.L., Voskuhl, R.R., Bouvier, S., et al. (2003) Comparison of multiple sclerosis lesions at 1.5 and 3.0 Tesla. Investigative Radiology, 38, 423-427. doi:10.1097/01.RLI.0000065426.07178.f1
- Stankiewicz, J.M., Glanz, B.I., Healy, B.C., et al. (2011) Brain MRI lesion load at 1.5 T and 3 T versus clinical status in multiple sclerosis. Journal of Neuroimaging, 21, e50-e56. doi:10.1111/j.1552-6569.2009.00449.x
- Mugler, J.P. III and Brookeman, J.R. (1990) Three-dimensional magnetization-prepared rapid gradient-echo imaging (3D MP RAGE). Magnetic Resonanace in Medicine, 15, 152-157.
- Miller, D.H., Grossman, R.I., Reingold, S.C., et al. (1998) The role of magnetic resonance techniques in understanding and managing multiple sclerosis. Brain, 121, 3-24. doi:10.1093/brain/121.1.3
- Schaefer, P.W., Grant, P.E. and Gonzalez, R.G. (2000) Diffusion-weighted MR imaging of the brain. Radiology, 217, 331-345.
- Bellmann-Strobl, J., Stiepani, H., Wuerfel, J., et al. (2009) MR spectroscopy (MRS) and magnetisation transfer imaging (MTI), lesion load and clinical scores in early relapsing remitting multiple sclerosis: A combined crosssectional and longitudinal study. European Radiology, 19, 2066-2074. doi:10.1007/s00330-009-1364-z
- Hayton, T., Furby, J., Smith, K.J., et al. (2009) Grey matter magnetization transfer ratio independently correlates with neurological deficit in secondary progressive multiple sclerosis. Journal of Neurology, 256, 427-435. doi:10.1007/s00415-009-0110-4
- Drayer, B., Burger, P., Hurwitz, B., et al. (1987) Reduced signal intensity on MR images of thalamus and putamen in multiple sclerosis: Increased iron content? American Journal of Roentgenology, 149, 357-363. doi:10.2214/ajr.149.2.357
- Brass, S.D., Chen, N.K., Mulkern, R.V., et al. (2006) Magnetic resonance imaging of iron deposition in neurological disorders. Topics in Magnetic Resonanace Imaging, 17, 31-40.
- Khalil, M., Enzinger, C., Langkammer, C., et al. (2009) Quantitative assessment of brain iron by R(2)* relaxometry in patients with clinically isolated syndrome and relapsing-remitting multiple sclerosis. Multiple Sclerosis, 15, 1048-1054. doi:10.1177/1352458509106609
- Neema, M., Arora, A., Healy, B.C., et al. (2009) Deep gray matter involvement on brain MRI scans is associated with clinical progression in multiple sclerosis. Journal of Neuroimaging, 19, 3-8. doi:10.1111/j.1552-6569.2008.00296.x
- Ceccarelli, A., Rocca, M.A., Neema, M., et al. (2010) Deep gray matter T2 hypointensity is present in patients with clinically isolated syndromes suggestive of multiple sclerosis. Multiple Sclerosis, 16, 39-44. doi:10.1177/1352458509350310
- Haacke, E.M., Makki, M., Ge, Y., et al. (2009) Characterizing iron deposition in multiple sclerosis lesions using susceptibility weighted imaging. Journal of Magnetic Resonance Imaging, 29, 537-544. doi:10.1002/jmri.21676
- Mittal, S., Wu, Z., Neelavalli, J., et al. (2009) Susceptibility-weighted imaging: Technical aspects and clinical applications, part 2. American Journal of Neuroradiology, 30, 232-252. doi:10.3174/ajnr.A1461
- Dastidar, P., Heinonen, T., Lehtimäki, T., et al. (1999) Volumes of brain atrophy and plaques correlated with neurological disability in secondary progressive multiple sclerosis. Journal of the Neurological Sciences, 165, 36- 42. doi:10.1016/S0022-510X(99)00071-4
- Ukkonen, M., Dastidar, P., Heinonen, T., et al. (2003) Volumetric quantitation by MRI in primary progressive multiple sclerosis: Volumes of plaques and atrophy correlated with neurological disability. European Journal of Neurology, 10, 663-669. doi:10.1046/j.1468-1331.2003.00617.x
- Ukkonen, M., Elovaara, I., Dastidar, P., et al. (2004) Urodynamic findings in primary progressive multiple sclerosis are associated with increased volumes of plaques and atrophy in the central nervous system. Acta Neurologica Scandinavica, 109, 100-105. doi:10.1034/j.1600-0404.2003.00184.x
- Taylor, I., Butzkueven, H., Litewka, L., et al. (2004) Serial MRI in multiple sclerosis: A prospective pilot study of lesion load, whole brain volume and thalamic atrophy. Journal of Clinical Neuroscience, 11, 153-158. doi:10.1016/S0967-5868(03)00145-0
- Mowry, E.M., Beheshtian, A., Waubant, E., et al. (2009) Quality of life in multiple sclerosis is associated with lesion burden and brain volume measures. Neurology, 72, 1760-1765. doi:10.1212/WNL.0b013e3181a609f8
- Bakshi, R., Neema, M., Healy, B.C., et al. (2008) Predicting clinical progression in multiple sclerosis with the magnetic resonance disease severity scale. Archives of Neurology, 65, 1449-1453. doi:10.1001/archneur.65.11.1449
- Heinonen, T., Dastidar, P., Kauppinen, P., et al. (1998) Semi-automatic tool for segmentation and volumetric analysis of medical images. Medical & Biological Engineering & Computing, 36, 291-296. doi:10.1007/BF02522473
- Bermel, R.A., Sharma, J., Tjoa, C.W., et al. (2003) A semiautomated measure of whole-brain atrophy in multiple sclerosis. Journal of Neurological Sciences, 208, 57- 65. doi:10.1016/S0022-510X(02)00425-2
- Zhang, Y., Brady, M. and Smith, S. (2001) Segmentation of brain MR images through a hidden Markov random field model and the expectation-maximization algorithm. IEEE Transactions of Medical Imaging, 20, 45-57. doi:10.1109/42.906424
- Brück, W., Bitsch, A., Kolenda, H., et al. (1997) Inflammatory central nervous system demyelination: Correlation of magnetic resonance imaging findings with lesion pathology. Annals of Neurology, 42, 783-793. doi:10.1002/ana.410420515
- van Walderveen, M.A., Kamphorst, W., Scheltens, P., et al. (1998) Histopathologic correlate of hypointense lesions on T1-weighted spin-echo MRI in multiple sclerosis. Neurology, 50, 1282-1288. doi:10.1212/WNL.50.5.1282
- van Waesberghe, J.H., Kamphorst, W., De Groot, C.J., et al. (1999) Axonal loss in multiple sclerosis lesions: Magnetic resonance imaging insights into substrates of disability. Annals of Neurology, 46, 747-754. doi:10.1002/1531-8249(199911)46:5<747::AID-ANA10>3.0.CO;2-4
- Heinonen, T., Dastidar, P., Eskola, H., et al. (1998) Applicability of semi-automatic segmentation for volumetric analysis of brain lesions. Journal of Medical Engineering & Technology, 22, 173-178. doi:10.3109/03091909809032536
- Dastidar, P., Heinonen, T., Vahvelainen, T., et al. (1999) Computerised volumetric analysis of lesions in multiple sclerosis using new semi-automatic segmentation software. Medical & Biological Engineering & Computing, 37, 104-107. doi:10.1007/BF02513274
- Lassmann. H. (1999) The pathology of multiple sclerosis and its evolution. Philosophical Transactions of the Royal Society of London, Series B, Biological Sciences, 354, 1635-1640. doi:10.1098/rstb.1999.0508
- Filippi, M., Yousry, T., Horsfield, M.A., et al. (1996) A high-resolution three-dimensional T1-weighted gradient echo sequence improves the detection of disease activity in multiple sclerosis. Annals of Neurology, 40, 901-907. doi:10.1002/ana.410400612
- Neema, M., Stankiewicz, J., Arora, A., et al. (2007) T1- and T2-based MRI measures of diffuse gray matter and white matter damage in patients with multiple sclerosis. Journal of Neuroimaging, 17, 16-21. doi:10.1111/j.1552-6569.2007.00131.x
- Tas, M.W., Barkhol, F., van Walderveen, M.A., et al. (1995) The effect of gadolinium on the sensitivity and specificity of MR in the initial diagnosis of multiple sclerosis. American Journal of Neuroradiology, 16, 259-264.
- Moore, G.R., Leung, E., MacKay, A.L., et al. (2000) A pathology-MRI study of the short-T2 component in formalin-fixed multiple sclerosis brain. Neurology, 55, 1506- 1510. doi:10.1212/WNL.55.10.1506
- Laule, C., Leung, E., Lis, D.K., et al. (2006) Myelin water imaging in multiple sclerosis: Quantitative correlations with histopathology. Multiple Sclerosis, 12, 747-753. doi:10.1177/1352458506070928
- Rovira, A. and León, A. (2008) MR in the diagnosis and monitoring of multiple sclerosis: An overview. European Journal of Radiology, 67, 409-414. doi:10.1016/j.ejrad.2008.02.044
- Phuttharak, W., Galassi, W., Laopaiboon, V., et al. (2006) ADC measurements in various patterns of multiple sclerosis lesions. Journal of the Medical Association of Thailand, 89, 196-204.
- Droogan, A.G., Clark, C.A., Werring, D.J., et al. (1999) Comparison of multiple sclerosis clinical subgroups using navigated spin echo diffusion-weighted imaging. Magnetic Resonanace Imaging, 17, 653-661.
- Mesaros, S., Rocca, M., Sormani, M., et al. (2010) Bimonthly assessment of magnetization transfer magnetic resonance imaging parameters in multiple sclerosis: A 14-month, multicentre, follow-up study. Multiple Sclerosis, 16, 325-331. doi:10.1177/1352458509358713
- Parry, A., Clare, S., Jenkinson, M., et al. (2002) White matter and lesion T1 relaxation times increase in parallel and correlate with disability in multiple sclerosis. Journal of Neurology, 249, 1279-1286. doi:10.1007/s00415-002-0837-7
- Sormani, M.P., Rovaris, M., Comi, G., et al. (2009) A reassessment of the plateauing relationship between T2 lesion load and disability in MS. Neurology, 73, 1538- 1542. doi:10.1212/WNL.0b013e3181c06679
- Trojano, M., Liguori, M., Bosco Zimatore, G., et al. (2002) Age-related disability in multiple sclerosis. Annals of Neurology, 51, 475-480. doi:10.1002/ana.10147
NOTES
*Corresponding author.