Journal of Biomedical Science and Engineering
Vol. 5 No. 6 (2012) , Article ID: 19715 , 8 pages DOI:10.4236/jbise.2012.56040
The analysis of microscopy imaging on liquid crystalline components of the cell nucleus
![]()
Key Laboratory of Waste Solid Treatment and Resource Recycle of Ministry of Education, Southwest University of Science and Technology, Mianyang, China
Email:*shysun@swust.edu.cn
Received February 14th, 2012; revised March 23rd, 2012; accepted April 11th, 2012
Keywords: Liquid Crystal; Cellular Nucleus; Microscopy; 3D Reconstruction; Genomic Condensation
ABSTRACT
Dinoflagellates nuclei allow for liquid crystalline characterization without core histones. In this study, nuclei were isolated from the athecate Karenia dinoflagellate species with minimum destruction to their native structure during preparation procedures. The liquid crystalline nuclei were studied by microscopy techniques of Metripol birefringence microscopy, Confocal Laser Scanning Microscopy (CLSM) and synchrotron radiation-based hard X-ray Microscopy with computed tomography, respectively. The 3D reconstruction techniques of hard X-ray tomography and CLSM were also discussed. The important biophysical parameters of the interspaces between chromosomes, nuclear surface areas and chromosome-occupied volumes were calculated from a 3D rendering of a reconstructed nucleus. The results of calculated average chromosomal DNA concentration of dinoflagellate was consistent with the concentration which can spontaneously assemble into the cholesteric liquid crystal phase in vitro.
1. INTRODUCTION
The cell nucleus is the natural habitat of eukaryotic genomes with multiple subnuclear compartments that structurally and functionally organized, where each chromosome is confined to a discrete region that known as chromosome territory surrounded by interspaces within spatially limited volume [1,2]. In the crowded intranuclear environment, the formations of at least some of microscopic visible intranuclear compartments are likely driven by excluded volume effects [2-5]. Condensation plays a predominantly role in folding long DNA (~2 meters) into several microns sized cellular nucleus to store, transport and preserve the genetic material [6,7]. The linear folded ratio (defined as the ratio of the length of extended DNA to the length of compacted structure that contains it) is widely used to measure degree of DNA condensation in vivo and vitro, but DNA condensation is biophysically constrained by the higher-order structure of chromosome [8,9]. Therefore, local chromosomal DNA concentration would be valuable information for estimating intranuclear genome condensation [8]. High-resolution bioimaging of the highly condensed intranuclear organization is a challenge with current microscopy techniques because conventional light microscopy has a resolution limit of approximately half the wavelength of light, which is approximately one-fourth the diameter of a typical chromosome, and TEM micrographs of ultrathin sections of chromosomes lose information on the nuclear spatial architecture [10]. Therefore, quantitative determination of the local chromosomal DNA concentration is not easy because it is difficult to obtain the precise volume fraction of chromosome-occupied based on neither optical microscopy nor electronic microscopy [7,8,11]. Consequently, relatively little is known about the biophysical biological aspects of intranuclear genome condensation in macromolecular crowded environment [5].
CLSM is one of the most powerful 3D microscopy technique for studying biological objects [12]. The spatial architecture of fluorescently labeled biological targets can be directly reconstructed by stacking a series of CLSM optical section micrographs from a given depth [12,13]. The resolution of conventional CLSM is limited by optical diffraction with the best possible 3D rendering at a resolution of 250 nm [12,14]. However, a large number of subcellular organelles are comparable to or smaller than the CLSM spatial resolution limits. Stimulated emission depletion (STED) microscopy provides 3D images of biological structures with high spatial resolution [15]. However, all of the UV confocal microscopy techniques are limited in that only fluorescently labeled targets can be imaged, and unlabeled targets cannot be visualized [12,14,16].
The rapidly developing synchrotron radiation-based X-ray microscopy has been applied for isotropic 3D visualization relatively thick intact cells in the size range from 0.5 μm to 10 - 20 μm with spatial resolution at tens of nanometers, which lies between that of the electron microscopy and optical microscopy [12,17,18]. Synchrotron radiation-based X-ray tomography can traverse the sample thickness limits of electron microscopy and resolution restrictions of CLSM [12,17,18]. Several groups demonstrated high resolution 3D imaging of biological objects of yeast [16,17,19], lymphocyte [18], virus membranes [20], bacteria [21,22], eukaryotic chromosomes [23] and algae [24] in the soft X-ray in the “water window” spectral region (wavelength region: 2.34 nm - 4.44 nm, photon energy region: 0.28 - 0.53 KeV) [16,17,20] and hard X-ray spectral region (wavelength region: 0.01 nm - 0.62 nm, photon energy region: 2 - 100 KeV) [21,23]. Compared with soft X-ray microscopy, hard X-ray microscopy has relatively large penetration depths, focal lengths and depths of focus, which has advantages for 3D reconstruction of much thicker cells and tissues [25,26]. Among these X-ray microscopic techniques, X-ray diffraction microscopy (XDM) has achieved great success, which is a typical lensless phase contrast X-ray imaging technique using coherent X-ray light source commonly based on the third generation synchrotron radiation facility [17,23,27]. The zone plate based X-ray microscopy is another kind of frequently used X-ray imaging technique, which uses a zone plate as objective and a zone plate or axisymmetric hollow elliptically glass capillary as condenser [20,28-30]. The zone plate based X-ray microscopy can directly get information in real space, but challenged by the difficulties of fabricating high efficiency and stable objective lenses(zone plates) [28,31].
In dinoflagellates, cholesteric liquid crystalline chromosomes are attached to the nuclear envelope and permanently condensed throughout the cell cycle [32]. The dinoflagellate Karenia species is particularly interesting because its nucleus without thick cell wall which allows for easy isolation of intact nuclei with minimum destruction to their native structure [33]. The size of a single chromosome of Karenia is comparable to a single yeast or bacteria cell [33,34]. It is a desirable model for microscopy scientists studying intranuclear genome organization and condensation. In the present study, we compared microscopy techniques for bioimaging isolated nuclei from Karenia papilionacea using Metripol birefringence microscopy, CLSM and synchrotron radiation-based hard X-ray tomography, respectively.
2. MATERIALS AND METHODS
2.1. Culture Conditions
The dinoflagellate, Karenia papilionacea, used in the experiments was isolated from the South China Sea [35]. K. papilionacea was cultured in L1 medium at 23˚C under 12L:12D (light:dark) photo cycles. The cell density was determined by counting cells under a light microscope using a hemocytometer. The cells were harvested during the stationary phase at a density of 103 cells·ml–1.
2.2. Isolation of Nuclei
All the experimental steps were carried out on ice surface. The stationary phase cells were harvested by centrifugation at 1000 ×g for 10 minutes at 4˚C. The cell pellets were resuspended in a total volume of 50 ml culture per 100 μl in freshly prepared, ice-cold nuclei extraction buffer (NEB), which consisted of 1 mM Tris, 1.5 mM CaCl2, 10 mM KCl, 0.1 mM DTT, 0.5% NP-40 and 1× protease inhibitors (0.5 μg·ml–1 PMSF). After 10 min incubation, the suspension was transferred to a 1.5 ml tube and centrifuged at 14,000 ×g for 10 s; the pellet was then resuspended in 500 μl NEB. Finally, the freshly purified nuclei were used at the desired concentration for experiment at 4˚C.
2.3. Confocal Laser Scanning Microscopy
The nuclei isolated from 100 ml of cultured cells were suspended in 100 μl NEB and stained with 50 μg·ml–1 Sytox Green. The isolated nuclei were observed using an inverted Leica SP2 microscope. The CLSM experiments were performed as follows: an argon laser with a 488 nm excitation wavelength was used to excite the Sytox Green-stained chromosomes. High-magnification images were obtained using a Pl Apo Cs 63× (N.A. 1.32, oil immersion) objective. The scan mode was XYZ, the frame format was 512 × 512 (width × height), and the scan speed was 400 Hz. For the 3D reconstruction, a series of optical section images were acquired from the different focal plates of the selected fields. A 3D reconstruction of the captured images was processed using Leica CLSM SP2 integrated offline software.
2.4. Metripol Birefringence Microscopy
The anisotropic optical properties of intranuclear chromosomes were measured using a Metripol birefringence imaging system (Oxford Cryosystems) [36]. The system employs a motorized rotating polarizer and a fixed circular analyzer to generate a series of images. The sample preparation procedure for the Metripol microscopy was similar to polarizing microscopy. For quantification, a series of data were generated over several minutes for each sample; the data generation involved 50 steps every 7.2˚ of polarizer rotation. The imaging system employed a 550 nm monochromatic polarizing light. Integrated software was used to control the measurement process and analyze the data.
2.5. Synchrotron Based Hard X-Ray Tomography
For X-ray tomography, the isolated nuclei were prefixed with 2% paraformaldehyde. Next, the fixed nuclei were dehydrated through a series of graded ethanol. Finally, the dehydrated nuclei were double-stained with 1.5% Reynolds lead citrate and 2% uranyl acetate.
The X-ray tomography experiments were carried out on the X-ray microscope beamline U7A at the National Synchrotron Radiation Laboratory (NSRL) in Hefei, China [29]. The experimental setup includes a 6T superconducting wiggler as the X-ray source, a Si (111) double-crystal monochromator (with a photon energy range of 7 - 12 keV) to provide a monochromatic X-ray flux; a condenser with a focusing efficiency near 90%; and objective FZPs produced by electroplating gold onto a silicon nitride membrane with a 45 nm width in the outermost zone, which delivers a 52 μm field depth (at 8 keV). This X-ray computed tomography (XCT) system generates spatial resolution as low as 50 nm, with a 880 total magnification factor onto the 13 nm × 13 nm (1 k × 1 k) CCD. With a computer-controlled rotating stage and a stable mechanical design, the computer can automatically collect the tomographic data.
To reconstruct the images, the 75 sequential tomographic projections were automatically collected at 2˚ intervals from –74˚ to +74˚ at 8 keV with a 15 × 15 nm field view. These projections were subsequently aligned, and a standard filtered-back-projection algorithm (A. C. Kak and M. Slaney, 1988) was used to reconstruct the aligned data. The thickness of the aligned slices was 0.058 μm.
3. RESULTS
3.1. Metripol Birefringence Microscopy
The isolated nuclei show typical birefringent chromosomes under a conventional polarizing microscope (Figure 1(a)). The image contrast in conventional polarizing microscopy is derived from changing the angle of polarizing light after the light is transmitted to a birefringent (anisotropic) liquid crystalline nucleus that is between a perpendicularly orientated polarizer and the analyzer. If the vibration direction of the polarizing light is perpendicular to the analyzer, then all the polarizing light is blocked by the analyzer, and the view field is the darkest field. Conversely, if the vibration direction of the polarizing light is parallel to the analyzer direction, then all polarizing light can pass through the analyzer, and the view field is the brightest field. Consequently, the dark and bright regions of the micrograph are generated by the anisotropic optical properties of the nucleus (Figure 1(a)).
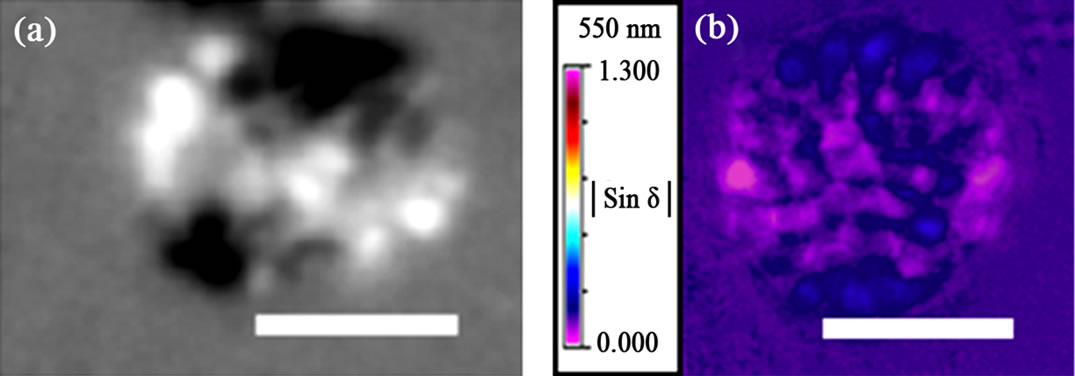

Figure 1. Polarizing microscopy of nucleus isolated from Karenia papilionacea. (a) Isolated nuclei under a conventional polarizing microscope; (b)-(d) Quantitative maps for the spatial distribution of the optical properties of isolated nuclei using the Metripol system. The pseudocolors in (b) and (c) represent the retardance and orientation values, respectively, and the color keys are given in the top left corner of the images. Scale bar: 5 μm.
The semi-automatic quantitative Metripol birefringence microscopy system has been used to map the spatial distribution of the anisotropic optical properties of intranuclear chromosomes. Three separate false-colored micrographs illustrating the intensity value distribution for birefringence, orientation and transmittance were simultaneously obtained in one imaging experiment (Figures 1(b)-(d)). The color variation in the micrographs represents the spatial distribution of the anisotropic intensity values for the corresponding intranuclear chromosome anisotropic optical properties. The birefringent, condensed chromosomes distribute inside the nucleus with optical symmetry. The radially distributed intranuclear chromosomes are accompanied by certain regions that exhibit much lower magnitudes of birefringence (Figure 1(b)). The colors within the orientation angle micrograph indicate the chromosomal alignment from purple (horizontal, 0˚) to red (horizontal, 180˚), and the orientation is related to the angle between the long axis of the chromosome and the direction of the chromatin filament fiber alignment (Figure 1(c)) [11].
3.2. CLSM Imaging
CLSM has been used for 3D reconstruction of isolated nuclei. The diameter of the isolated K. papilionacea nucleus in the condensed state is 8.2 µm. The subnuclear organization can be discerned using the CLSM polarizing channel (Figure 2(a)); however, the subnuclear organization is blurred in the fluorescence channel (Figure 2(b)).
3.3. Synchrotron Based Hard X-Ray Tomography
A typical 2D tomographic projection of a condensed nucleus in a gray scale generated from hard X-ray tomography is shown in Figure 3. The image intensities are directly proportional to the absorption coefficients of the electron density along the direction of the incident X-ray. The interspatial contrast between chromosomes is much lower than in the chromosome-occupied regions (Figure 3(a)).
Representative slices of a 3D reconstructed nucleus using tomographic projections revealed intranuclear chromosome spatial arrangements (Figures 3(b)-(d)). The chromosomes were isotropically distributed inside the entire nucleus. A 3D volume rendering from the reconstructed nucleus generated 3D external surface information (Figure 4). The virtual sections from a 3D volume rendering showed interior interspaces in the chromosome-occupied volume (Figures 4(b)-6(d)). The interspaces were irregularly filled in all of the virtual section plates. The 3D rendering results suggest that the condensed chromosomes were distributed throughout the entire nucleus without a specific orientation.
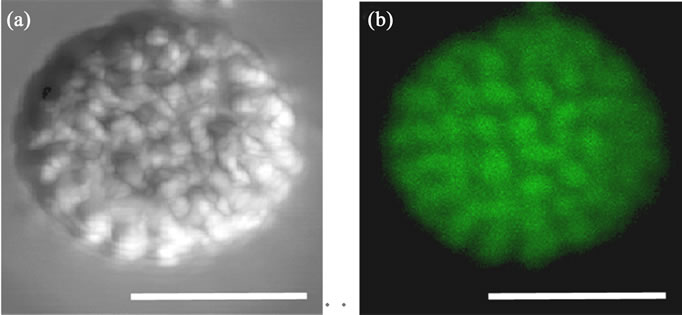
Figure 2. Three-dimensional reconstructed CLSM micrographs of isolated Karenia papilionacea nucleus. For CLSM observations, the nuclei were stained with Sytox Green. A pair of orthogonal polarizers in the transmission channel were used to observe the behavior of the liquid crystalline chromosomes. (a) A 3D reconstructed micrograph from CLSM polarizing microscopy; (b) A 3D reconstructed micrograph from CLSM fluorescence microscopy. Scale bar: 5 μm.
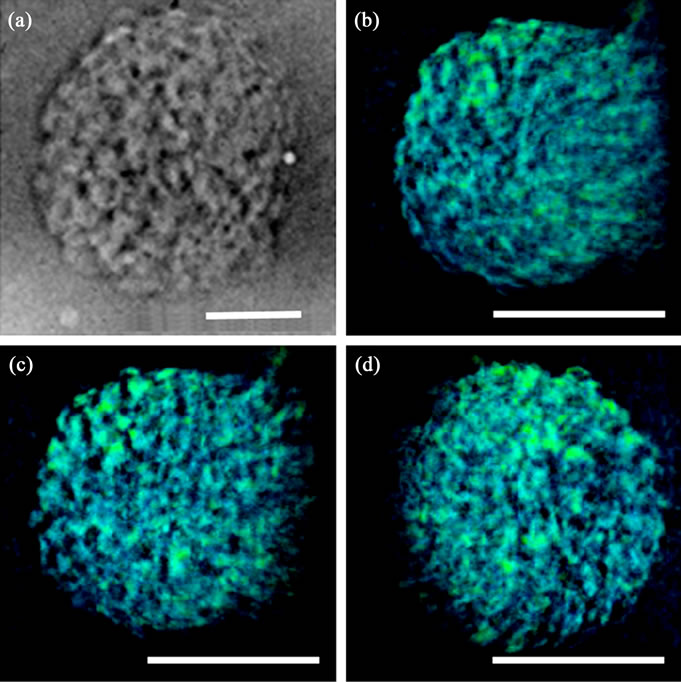
Figure 3. Micrographs of a liquid crystalline nucleus in a condensed state from synchrotron radiation-based hard X-ray tomography. (a) A representative 2D tomography projection; (b)-(d) Representative slices of views from different directions of a nucleus reconstructed in 3D from 2D projections. Scale bar: 5 μm.
The quantitative parameters for the representative condensed nucleus were calculated from the 3D rendering data. The separation processing for a 3D volume rendering of the nucleus from the 2D tomography projections was based on a standard filtered-back-projection algorithm [37,38]. The micrographs were recalibrated using a standard 10 µm-length line on a standard Xradia pattern [29,38]. The exactly pixel size for the reconstructed data was 58.3 nm, and the voxel was 58.3 nm × 58.3 nm × 58.3 nm (1.98 × 10⁻⁴ µm3). Given the precise pixel size, the characteristic parameters for the condensed nucleus were estimated based on the pixel number. The diameter of the reconstructed nucleus is approximately 8.0 µm, which is comparable to the size measured using CLSM. 3D volume rendering in combination with computed tomography, important intranuclear biophysical parameters were determined for the first time, including the nuclear external surface area (NESA), nuclear internal surface area (NISA) and volume of the chromosome-occupied area. The intact condensed nucleus had a total volume of 272.5 μm3, which consisted of 21.3% interspatial and 78.7% chromosomeoccupied volumes. Therefore, the total volume of the chromosome-occupied was 214.4 μm3. Each K. papilionacea nucleus has a similar DNA content, 47 pg [33]. Therefore, the average DNA concentration in a condensed nucleus is approximately 219.2 mg·ml–1, a concentration in the range of cholesteric liquid crystalline DNA formation (160 mg·ml–1 to 320 mg·ml–1 in vitro) [39].
4. DISCUSSION
Complementary information on the spatial distribution of intranuclear chromosomes and average chromosomal DNA concentration was obtained by combining optical microscopy and synchrotron radiation-based hard X-ray tomography, and it may aid in quantifying genome compaction of chromosomes in vivo. By combining a pair of crossed polarizers and quarter-wave plates, conventional polarizing microscopy can provide orientation information as extinction angle. However, it has a li
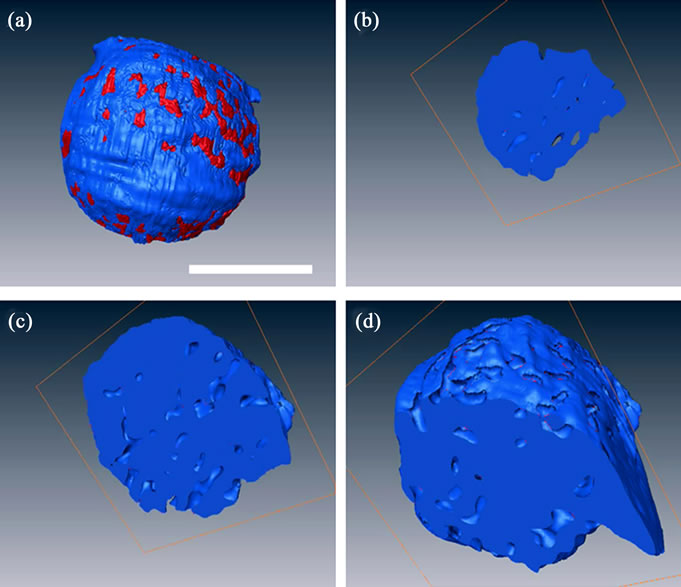
Figure 4. A 3D rendering of an isolated nucleus using reconstructed volume data. (a) The external surface of 3D reconstructed nucleus; (b)-(d) The interior sections computed from a 3D reconstructed nucleus. The red color in (a) represents the interstitial distribution at the external surface. The interstices in (b)-(d) represent the distribution at internal surfaces. The blue color represents chromosome-occupied volume. Scale bar: 5 μm.
mited ability to resolve the phase shift of light retarda tion and thus cannot separate the optical patterns of birefringence and orientation (Figure 1(a)) [36]. After Fourier analysis, the data obtained by Metripol microscopy includes phase shift information for the extinction angle and the amplitude of retardation with the application of continuously rotating polarizer [36]. If all intranuclear chromosomes have similar local chromosomal DNA concentration, then all chromosomes may have similar birefringence properties [11]. However, although all intranuclear chromosomes exhibit equal birefringence magnitudes, some regions exhibit much lower birefringent intensities. One likely contribution to this anisotropy is from the variations of nuclear thickness along the direction of the incident polarizing light (Figure 1(b)). The overlapping effects from different directions of chromatin orientation may also contribute to such anisotropic distributions. As the light passes through the liquid crystalline nuclei, the change in the angle of vibration direction of the polarized light will generate difference for highly compacted chromatins (Figure 1(c)) [11].
Synchrotron radiation-based hard X-ray tomography is a powerful method for imaging the 3D internal structure of a relatively thick biological specimen. TEM observations showed that the condensed chromosomes in nuclei that for X-ray tomography preserved their characteristic cholesteric organization during the sample preparation process (data not shown herein). Compared with TEM, the distinct advantages of Synchrotron radiation-based hard X-ray tomography include allowing quantitative 3D reconstruction of an intact nucleus and avoiding mechanical damage from embedding, sectioning and mounting procedures. Osmium tetraoxide-fixed nuclei may resist radiation damage during XCT data collectionas no significant shrinkage was observed and the condensed nucleus size calculated by synchrotron-based hard X-ray tomography was close to the size measured using CLSM. The image contrast of three-dimensional bioimaging of nuclei using XCT is very low because chromatins have relatively homogenous absorption efficiencies unlike entire eukaryotic cell, such as yeast, it’s based on the different absorption efficiencies of the natural organic compositions of different subcellular organelles [16,40]. Consequently, heavy metal staining was used to enhance the contrast, which is frequently used for TEM. The heavy metal was primarily absorbed by the DNA and protein-rich regions of the chromosomes, and a small amount was absorbed by RNA and other biological matrices in the chromosome interspaces. The enhanced contrast of double-stained chromosomes was sufficient to distinguish the interspaces in the chromosome-occupied. The reconstructed nuclei cross-sections show that XCT generated 3D isotropic resolution (Figure 5).
Bioimaging intranuclear spatial organization in the condensed state was a challenge for CLSM, in which the nucleic acids of chromosomes were labeled using the nucleic-acid specific fluorochrome Sytox Green (Figure 2(b)). Details of intranuclear spatial organization could not be identified by cross-sectional analysis of the condensed nucleus due to low axial resolution (Figure 6). The specificity of Sytox Green chromosomal staining could be low as a result of the nucleus containing a considerable amount of nucleic acids that can be labeled by Sytox Green. Another challenge is that the available contrast mechanisms for chromosomes are insufficient to distinguish tightly compacted chromosomes.
The image contrast mechanism for polarizing microscopy using CLSM is entirely different from that of conventional polarizing microscopy. The point-to-point CLSM polarizing microscopy scans provide integrated anisotropic information on liquid crystalline nuclei. CLSM polarizing fluorescent microscopy may improve image contrast for Sytox Green-stained chromosomes in which fluorescent signals without birefringence will be blocked.
The average chromosomal DNA concentration is a more appropriate descriptor of genome condensation than the well-known linear DNA packing ratio because it accounts for the physical constraints of the higher-order chromosome structure [8,41]. Dinoflagellates contain the largest genomes, the liquid crystalline dinoflagellate chromosomes must accommodate an extremely high local DNA concentration [9]. Combined with Metripol
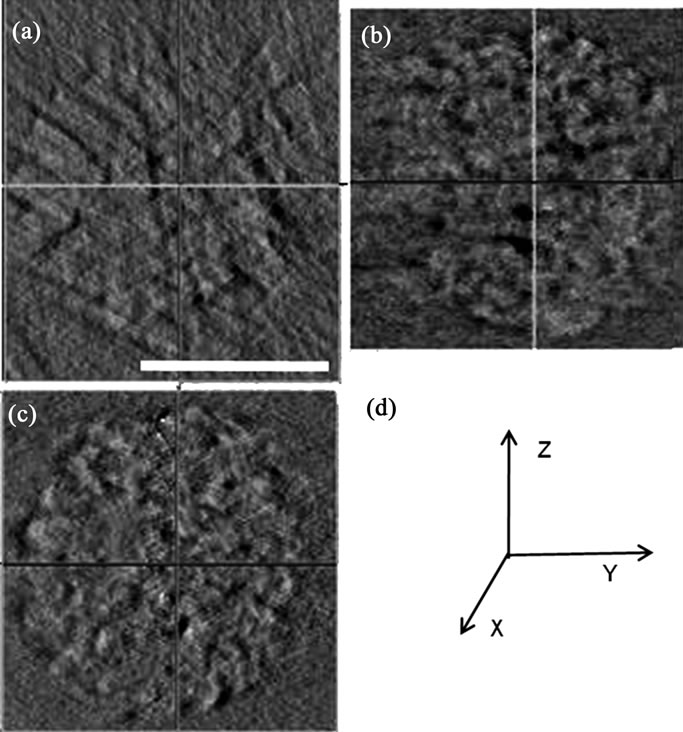
Figure 5. The cross-section of nuclei reconstructed using synchrotron radiation-based hard X-ray tomography. (a) XY plane; (b) YZ plane; (c) XZ plane; (d) XYZ planes of a 3D reconstruction. Scale bar: 5 μm.
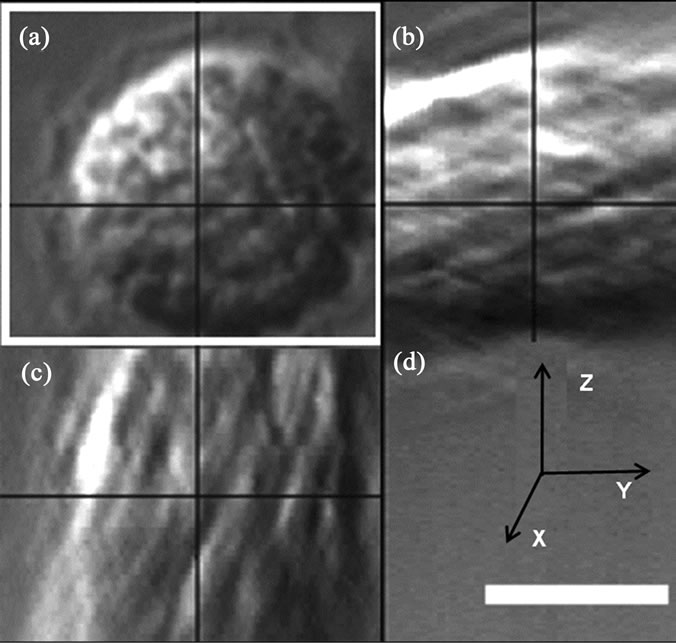
Figure 6. The cross-section of a nucleus reconstructed from polarizing microscopy of CLSM. (a) XY plane; (b) YZ plane; (c) XZ plane; (d) XYZ planes of a 3D reconstruction. Scale bar: 5 μm.
birefringence microscopy, precise, quantitative calculations of the average DNA concentration of the dinoflagellate chromosome using synchrotron radiation-based hard X-ray tomography creates new opportunities for the study of the relationships of anisotropic optical properties, genome condensation and chromosome organization in the highly crowded nuclear environment.
5. CONCLUSIONS
Metripol polarizing microscopy is a quantitative bioimaging technique that can provide information of quantitative anisotropic optics for isolated nuclei, but the technique is limited by the resolution as optical microscopy. Sytox Green-labeled intranuclear liquid crystalline chromosomes can be directly reconstructed in 3D by stacking a series of optical section micrographs, but the reconstruction is limited by the specificity of the fluorescent dye and the resolution of Z axis from the spatial architecture. Synchrotron radiation-based hard X-ray tomography can generate a 3D isotropic reconstruction of a condensed nucleus.
The characteristic parameters of a condensed nucleus were calculated by synchrotron radiation-based hard Xray tomography including volumes for the nucleus and chromosome-occupied, external and internal nuclear surface areas and average chromosomal DNA concentration. The condensed nucleus has an 8.0 μm diameter, a 272.5 μm3 volume that consists of 21.3% interspatial and 78.7% chromosome-occupied volumes, a 138.9 μm2 external surface area and a 413.6 μm2 internal surface area. The entire intranuclear chromosomes occupied volume is 214.4 μm3, and the average DNA concentration is 220 mg·ml–1.
Many challenges remain in identifying the details of higher-order organization of condensed cellular nucleus using synchrotron radiation-based X-ray tomography. A brighter and more stable light source and new strategies for improving imaging contrast [42] may aid in imaging higher-order structure of nucleus in their native condition. In future, synchrotron radiation-based X-ray tomography may offer great opportunities for the bioimaging of isolated cellular nuclei, single cell and other thick biological specimens at high 3D isotropic resolution.
6. ACKNOWLEDGEMENTS
This work was supported partly by SWUST Scientific Research Foundation for Doctoral Scholars (10zx7128), Opening Project of Key Laboratory of Solid Waste Treatment and Resource Recycle, Ministry of Education (11zxgk05) and National Natural Science Foundation of China (41102213, 11176028 and 41130746).
![]()
![]()
REFERENCES
- Raska, I., Shaw, P.J. and Cmarko, D. (2006) Structure and function of the nucleolus in the spotlight. Current Opinion in Cell Biology, 18, 325-334. doi:10.1016/j.ceb.2006.04.008
- Hancock, R. (2004) A role for macromolecular crowding effects in the assembly and function of compartments in the nucleus. Journal of Structural Biology, 146, 281-290. doi:10.1016/j.jsb.2003.12.008
- Marenduzzo, D., Finan, K. and Cook, P.R. (2006) The depletion attraction: an underappreciated force driving cellular organization. Journal of Cell Biology, 175, 681- 686. doi:10.1083/jcb.200609066
- Hancock, R. (2008) Self-association of polynucleosome chains by macromolecular crowding. European Biophysics Journal with Biophysics Letters, 37, 1059-1064. doi:10.1007/s00249-008-0276-1
- Richter, K., Nessling, M. and Lichter, P. (2007) Experimental evidence for the influence of molecular crowding on nuclear architecture. Journal of Cell Science, 120, 1673-1680. doi:10.1242/jcs.03440
- Pinto, M.F.V., Moran, M.C., Miguel, M.G., et al. (2009) Controlling the morphology in DNA condensation and precipitation. Biomacromolecules, 10, 1319-1323. doi:10.1021/bm900211j
- Hancock, R. (2007) Packing of the polynucleosome chain in interphase chromosomes: Evidence for a contribution of crowding and entropic forces. Seminars in Cell & Developmental Biology, 18, 668-675. doi:10.1016/j.semcdb.2007.08.006
- Daban, J.R. (2000) Physical constraints in the condensation of eukaryotic chromosomes. Local concentration of DNA versus linear packing ratio in higher order chromatin structures. Biochemistry, 39, 3861-3866. doi:10.1021/bi992628w
- Minsky, A., Ghirlando, R. and Reich, Z. (1997) Nucleosomes: a solution to a crowded intracellular environment? Journal of Theoretical Biology, 188, 379-385. doi:10.1006/jtbi.1997.0525
- Reyes-Larnothe, R., Wang, X.D. and Sherratt, D. (2008) Escherichia coli and its chromosome. Trends in Microbiology, 16, 238-245. doi:10.1016/j.tim.2008.02.003
- Chow, M.H., Yan, K.T., Bennett, M.J., et al. (2010) Birefringence and DNA condensation of liquid crystalline chromosomes. Eukaryot Cell, 9, 1577-1587. doi:10.1128/EC.00026-10
- Huang, B., Bates, M. and Zhuang, X.W. (2009) Superresolution fluorescence microscopy. Annual Review of Biochemistry, 78, 993-1016. doi:10.1146/annurev.biochem.77.061906.092014
- Pawley, J.B. (2006) Handbook of biological confocal microscopy. 3rd edition, Springer, New York. doi:10.1007/978-0-387-45524-2
- Petibois, C. (2010) Imaging methods for elemental, chemical, molecular, and morphological analyses of single cells. Analytical and Bioanalytical Chemistry, 397, 2051- 2065. doi:10.1007/s00216-010-3618-7
- Wildanger, D., Medda, R., Kastrup, L., et al. (2009) A compact STED microscope providing 3D nanoscale resolution. Journal of Microscopy-Oxford, 236, 35-43. doi:10.1111/j.1365-2818.2009.03188.x
- Parkinson, D.Y., Mcdermott, G., Etkin, L.D., et al. (2008) Quantitative 3-D imaging of eukaryotic cells using soft X-ray tomography. Journal of Structural Biology, 162, 380-386. doi:10.1016/j.jsb.2008.02.003
- Huang, X., Nelson, J., Kirz, J., et al. (2009) Soft X-ray diffraction microscopy of a frozen hydrated yeast cell. Physical Review Letters, 103, Article ID: 198101. doi:10.1103/PhysRevLett.103.198101
- Mcdermott, G., Le Gros, M.A., Knoechel, C.G., et al. (2009) Soft X-ray tomography and cryogenic light microscopy: the cool combination in cellular imaging. Trends in Cell Biology, 19, 587-595. doi:10.1016/j.tcb.2009.08.005
- Larabell, C.A. and Le Gros, M.A. (2004) X-ray tomography generates 3-D reconstructions of the yeast, saccharomyces cerevisiae, at 60-nm resolution. Molecular Biology of the Cell, 15, 957-962. doi:10.1091/mbc.E03-07-0522
- Carrascosa, J.L., Chichon, F.J., Pereiro, E., et al. (2009) Cryo-X-ray tomography of vaccinia virus membranes and inner compartments. Journal of Structural Biology, 168, 234-239. doi:10.1016/j.jsb.2009.07.009
- Lima, E., Wiegart, L., Pernot, P., et al. (2009) Cryogenic X-ray diffraction microscopy for biological samples. Physical Review Letters, 103, Article ID: 198102. doi:10.1103/PhysRevLett.103.198102
- Miao, J.W., Hodgson, K.O., Ishikawa, T., et al. (2003) Imaging whole Escherichia coli bacteria by using single-particle x-ray diffraction. Proceedings of the National Academy of Sciences of the United States of America, 100, 110-112. doi:10.1073/pnas.232691299
- Nishino, Y., Takahashi, Y., Imamoto, N., et al. (2009) Three-dimensional visualization of a human chromosome using coherent X-ray diffraction. Physical Review Letters, 102, Article ID: 018101. doi:10.1103/PhysRevLett.102.018101
- Weiss, D., Schneider, G., Niemann, B., et al. (2000) Computed tomography of cryogenic biological specimens based on X-ray microscopic images. Ultramicroscopy, 84, 185-197. doi:10.1016/S0304-3991(00)00034-6
- Susini, J. (2005) Synchrotron based X-ray microscopy and micro-spectroscopy: multidisciplinary tools. Microscopy and Microanalysis, 11, 678-679. doi:10.1017/S143192760550271X
- Baruchel, J., Bleuet, P., Bravin, A., et al. (2008) Advances in synchrotron hard X-ray based imaging. Comptes Rendus Physique, 9, 624-641. doi:10.1016/j.crhy.2007.08.003
- Howells, M.R., Beetz, T., Chapman, H.N., et al. (2009) An assessment of the resolution limitation due to radiation-damage in X-ray diffraction microscopy. Journal of Electron Spectroscopy and Related Phenomena, 170, 4-12. doi:10.1016/j.elspec.2008.10.008
- Chao, W.L., Harteneck, B.D., Liddle, J.A., et al. (2005) Soft X-ray microscopy at a spatial resolution better than 15 nm. Nature, 435, 1210-1213. doi:10.1038/nature03719
- Tian, Y.C., Li, W.J., Chen, J., et al. (2008) High resolution hard x-ray microscope on a second generation synchrotron source. Review of Scientific Instruments, 79, Article ID: 103708. doi:10.1063/1.3002484
- Zeng, X.H., Duewer, F., Feser, M., et al. (2008) Ellipsoidal and parabolic glass capillaries as condensers for x-ray microscopes. Applied Optics, 47, 2376-2381. doi:10.1364/AO.47.002376
- Rehbein, S., Heim, S., Guttmann, P., et al. (2009) Ultrahigh-resolution soft-X-ray microscopy with zone plates in high orders of diffraction. Physical Review Letters, 103, Article ID: 110801. doi:10.1103/PhysRevLett.103.110801
- Rizzo, P.J. (2003) Those amazing dinoflagellate chromosomes. Cell Research, 13, 215-217. doi:10.1038/sj.cr.7290166
- Wargo, M.J. and Rizzo, P.J. (2000) Characterization of Gymnodinium mikimotoi (dinophyceae) nuclei and identification of the major histone-like protein, HGm. Journal of Phycology, 36, 584-589. doi:10.1046/j.1529-8817.2000.99122.x
- Levi-Setti, R., Gavrilov, K.L. and Rizzo, P.J. (2008) Divalent cation distribution in dinoflagellate chromosomes imaged by high-resolution ion probe mass spectrometry. European Journal of Cell Biology, 87, 963-976. doi:10.1016/j.ejcb.2008.06.002
- Yeung, P.K.K., Hung, V.K.L., Chan, F.K.C., et al. (2005) Characterization of a Karenia papilionacea-like dinoflagellate from the South China Sea. Journal of the Marine Biological Association of the United Kingdom, 85, 779-781. doi:10.1017/S0025315405011690
- Geday, M.A., Kaminsky, W., Lewis, J.G., et al. (2000) Images of absolute retardance L center dot Delta n, using the rotating polariser method. Journal of MicroscopyOxford, 198, 1-9. doi:10.1046/j.1365-2818.2000.00687.x
- Chen, J., Wu, C.Y., Tian, J.P., et al. (2008) Three-dimensional imaging of a complex concaved cuboctahedron copper sulfide crystal by x-ray nanotomography. Applied Physics Letters, 92, Article ID: 233104. doi:10.1063/1.2943337
- Li, W.J., Wang, N., Chen, J., et al. (2009) Quantitative study of interior nanostructure in hollow zinc oxide particles on the basis of nondestructive x-ray nanotomography. Applied Physics Letters, 95, Article ID: 053108. doi:10.1063/1.3196250
- Livolant, F. and Leforestier, A. (1996) Condensed phases of DNA: Structures and phase transitions. Progress in Polymer Science, 21, 1115-1164. doi:10.1016/S0079-6700(96)00016-0
- Gu, W.W., Etkin, L.D., Le Gro, M.A., et al. (2007) X-ray tomography of Schizosaccharomyces pombe. Differentiation, 75, 529-535. doi:10.1111/j.1432-0436.2007.00180.x
- Daban, J.R. (2003) High concentration of DNA in condensed chromatin. Biochemistry and Cell Biology-Biochimie Et Biologie Cellulaire, 81, 91-99.
- Yashiro, W., Takeda, Y., Takeuchi, A., et al. (2009) Hard-X-ray phase-difference microscopy using a fresnel zone plate and a transmission grating. Physical Review Letters, 103, Article ID: 180801. doi:10.1103/PhysRevLett.103.180801
NOTES
*Corresponding author.