Journal of Biomedical Science and Engineering
Vol. 5 No. 7 (2012) , Article ID: 20519 , 9 pages DOI:10.4236/jbise.2012.57047
An investigation of volumetric and corpus callosum dimension to detect brain disorders
![]()
1Department of Biomedical Engineering, Karunya University, Coimbatore, India
2Dr.N.G.P. Institute of Technology, Coimbatore, India
Email: srisornaprabu@gmail.com, porkumaran@gmail.com
Received 21 July 2011; revised 27 September 2011; accepted 11 June 2012
Keywords: Alzheimer’s Disease; Cerebral Palsy; Corpus Callosum; Dementia; Gradient Mask; Voxel
ABSTRACT
Alzheimer’s Disease (AD), Mental retardation, Cerebral Palsy, and other Dementias are the neurogenerative brain disorders which are statistically proven that 2% - 3% of people affected in the world today. The proposed method considered the symptoms which stands distinct for Alzheimer’s disease. Many structural neuroimaging studies have found the atrophy of the Corpus Callosum (CC) and the decrease in brain volume in AD. The measurement, area has been extracted from the gradient mask of the image to characterize the local atrophy of the CC. The result showed decreased area of the CC in AD when compared to the control groups. The volume has also been calculated by volume rendering and voxel size measurement for the same set of control groups and was found to be reduced in the AD patients. These findings confirmed the pathology characteristics in AD of brain disorders. The system’s validity with respect to results obtained with conventional diagnosis has been examined and proved to offer better results.
1. INTRODUCTION
In 2010, there are 3.7 million Indians with dementia and the total societal costs is about 14,700 crore and the numbers are expected to be double in 2030. Dementia is a syndrome usually chronic, characterized by a progresssive, overall deterioration in intellect including memory, learning, orientation, language, comprehension and judgments due to disease of the brain. It mainly affects older people, around 2% of cases start before the age of 65 years. After this, the prevalence doubles every five years. Dementia is one of the major causes of disability in late-life. The dementia syndrome is linked to a very large number of underlying causes and diseases in the brain.
The common causes accounting for 90% of all cases are Alzheimer’s disease, vascular dementia, Dementia with Lewy bodies and Frontotemporal dementia [1-3].
The Alzheimer’s Disease (AD) is a brain disorder which gradually destroys the ability to reason, remember, imagine, and learn. It is also mild forgetfulness normally observed in older people. Over the course of the disease, people with Alzheimer’s no longer recognize themselves or much about the world around them. Reference [2] has been observed Depression, anxiety, and paranoia are the symptoms accompanied with AD. Although there is no cure and new treatments helpless in Alzheimer’s symptoms and the nature of progression is slow [3].
There are three stages of Alzheimer’s. The first stage shows a loss of short term memory though past memories may remain unaffected. The middle stage is characterized by extreme confusion and long term memory is erased from the mind. In the last stage, perhaps lasting only one or two years, the deterioration is virtually complete. The victim cannot remember faces even his/her own. The overall nervous system regulating bodily functions is damaged so the patient becomes vegetative state [4-7].
While AD usually affects those over age 65, a rare and aggressive form of AD can happen in some people in their 40s and 50s. AD progresses slowly, taking between three to 18 years to advance from the earliest symptoms to death; the average duration of the disease is eight years. Right now, treatment of AD focuses on slowing its progression and coping with its symptoms [6,8,9]. The difficulty in the accurate diagnosis of the Alzheimer’s disease is that most of its symptoms resemble that of the other brain disorders such as vascular dementia, Parkinson’s disease, and senile dementia.
The main objective of the proposed work is to detect AD in early hours. We have considered the parameters of the size of corpus callosum (CC) and Total brain volume to detect the AD, based on the previous work [9-12]. Many structural neuroimaging studies have found the atrophy of the corpus callosum and the decrease in brain volume in AD.
The corpus callosum (Latin: tough body) is a structure of the mammalian brain in the longitudinal fissure that facilitates communication between the left and right cerebral hemispheres. It is the largest white matter structure in the brain, consisting of 200 - 250 million contra lateral axonal projections representing approximately 2% - 3% of all cortical fibers. The appearance of a sectioned corpus callosum is a broad-arched band and forms the most distinguishing portions on the surface of the cerebrum as shown in Figure 1 [10,12]. It is a wide, flat bundle of axons beneath the cortex. Much of the inter-hemispheric communication in the brain is conducted across the corpus callosum.
Patients with AD suffer from memory loss, emotional changes, and impairment of language and judgment; these symptoms are a result of brain cell deterioration and especially due to the loss of brain mass. As the disease progresses, patients have a noticeable decrease in brain size when compared to an average adult brain; these changes can be observed with Magnetic Resonance Imaging (MRI) or through postmortem examination. However, the difference between an Alzheimer’s brain and average brain takes years to be significant.
The decrease in brain size is localized to certain areas of the brain. The Alzheimer’s Association states that the disease affects the cerebral cortex, which is the neural tissue surrounding the cerebrum the largest part of the brain. Alzheimer’s disease destroys the brain cells, causing significant shrinkage of the cortex. One area of the cortex, the hippocampus, is targeted in particular [13,14]. The American Health Assistance Foundation states that the first neurological change is a decline in short-term memory; the reason that memory loss is significant in AD is the severe damage to the hippocampus. The hippocampus is located in the medial temporal lobe, and receives its name from its shape (a seahorse).
The Alzheimer’s Association adds that the ventricles, which are fluid-filled areas of the brain that resemble small gaps, are enlarged. These physiological changes result in the Alzheimer’s brain appearing shrunken with deep holes. As the volume of the cerebral cortex decreases, cognitive function further declines, resulting in judgment problems, impaired language and emotional changes. Besides the changes to the cerebral cortex and the ventricles, patients with AD have abnormal protein formations in the brain; these also result in deterioration of neurological functions [15]. The changes in brain size occur over a long period of time [15-17]. Changes become noticeable during moderate Alzheimer’s disease, which can last two to ten years. During severe Alzheimer’s, which can last between one and five years, the
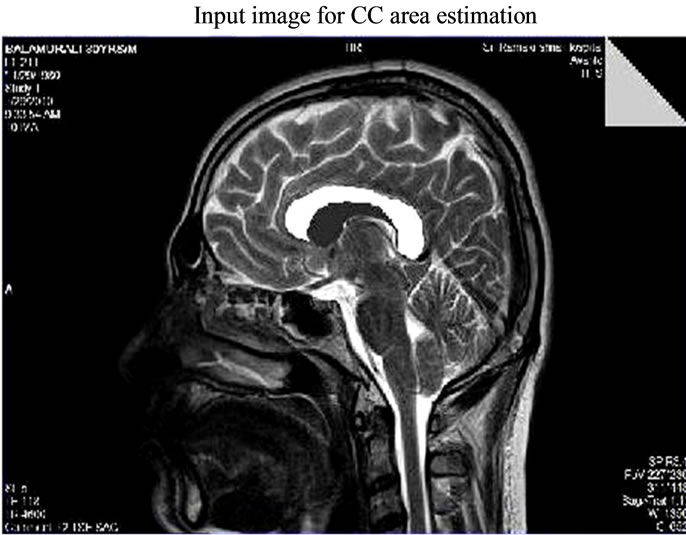
Figure 1. Input MR Image for CC area estimation-sagittal view.
physiological changes are apparent with imaging and symptoms.
2. METHODOLOGY
2.1. Corpus Callosum Dimension Analysis
The image acquisition process is the one in which the Magnetic Resonance (MR) images from various patients are acquired after the image reconstruction is done in the control console. The main objective is to extract the corpus callosum (CC) portion of the image, since the images acquired are all raw images in DICOM format the preprocessing is performed to increase the quality of an image for further processing. In the proposed methodology the DICOM image has been converted jpeg format as shown in Figures 1 and 2. The next level of processing has been carried out in CC area estimation system.
Various preprocessing techniques applied in medical images are filtering techniques, cropping, resizing, and conversion, edge detecting and filling, dilating an image as shown in Figure 3. It is often useful to remove the noise, smooth, detrend, or otherwise treat the image to make it good for analysis and estimation purposes. Image filtering is a process by which we can enhance images by “weighted” filtering. A linear filter applies a linear operator to a time-varying input signal. They are often used to eradicate unwanted frequencies from an input signal or to select a desired frequency among many others.
The filtered image has been resized for the CC area estimation. The input image resizing is the process of scaling a digital image. Resizing is a non-trivial process that involves a trade-off between efficiency, smoothness and sharpness. To enhance the smoothness and apparent sharpness the image has been resized. Cropping refers to the removal of the outer parts of an image to improve framing, emphasize subject matter or change the aspect
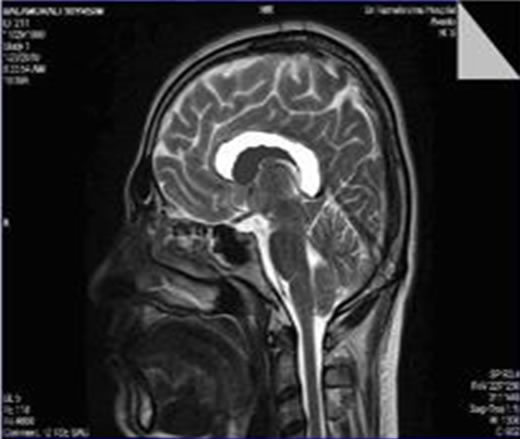
Figure 2. Resized input MR image for CC area estimation.
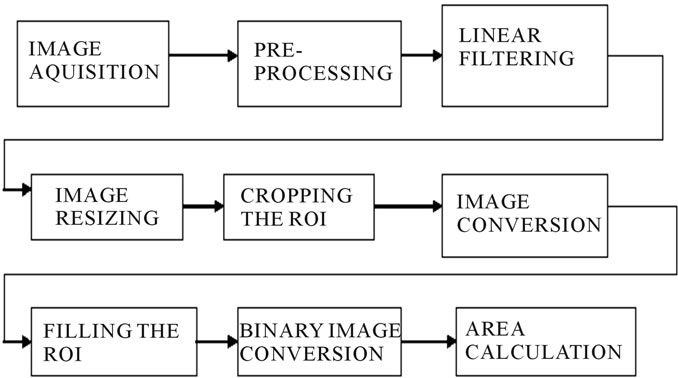
Figure 3. Architecture of the CC area estimation system.
ratio and improve the overall composition. The input is cropped to magnify the primary subject i.e. CC. It is necessary to crop the DICOM images, because of the images have been burned in graphics and text may occur within the normal pixel value range, bitmap overlay graphics and text may be present in unused high bits of the pixel data and coordinates in a named 3D Cartesian space pixels may be classified into segments encoded in a segmentation object as either binary or probabilistic values in a raster.
In order to fill the holes, the image has been converted into the gray format by eliminating the hue and saturation information for retaining the luminance. Filling is a process that fills a region of interest (ROI) by interpolating the pixel values from the borders of the region Figures 4 and 5. This process has been used to make objects in an image seem to disappear as they are replaced with values that blend in with the background area [18,19]. To fill in a specified ROI polygon in a grayscale image has been used. It smoothly interpolates inward from the pixel values on the boundary of the polygon by solving Laplace’s equation.
The filled image has been converted to binary for CC area estimation. The black and white could be either numeric or logical. In case of the numeric input, any nonzero pixels have been considered to be “on”. The area is
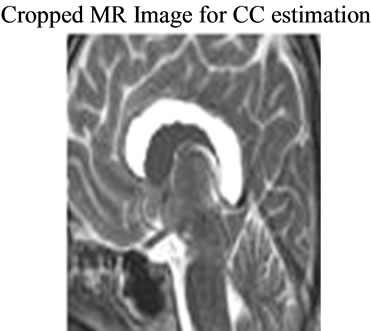
Figure 4. Cropped CC image for CC area estimation.

Figure 5. Segmented binary image CC to estimate CC area.
estimated roughly by counting the total number of “on” pixels in the image, but may not be exactly the same because different patterns of pixels are weighted differently. We have obtained the result 90% of the accurate size of CC which has been evaluated by physicians.
2.2. Brain Volume Estimation
The normal grown adult human brain weighs on average about 3 lb (1.5 kg) with a size of around 1200 cubic centimeters (cm3) in women and 1400 cm3 in men, although there is substantial individual variation. In Alzheimer’s, the ventricles, which are fluid-filled areas of the brain that resemble small gaps have enlarged. These physiological changes result in the Alzheimer’s brain to be shrunken with deep holes and considerably the volume of the brain seems to be reduced. The proposed method, describe a rapid semi-automated technique for the determination of whole-brain volumes from single 3D T1- weighted MR images. The minimal subjective operator decision-making method has been utilized and the volumes obtained have been closed to the brain volumes calculated from other known techniques followed by the physicians.
The data from the raw image has been accessed first which would include information about the pixel spacing, voxel size etc. The colour intensity of the image is obtained in order to divide the white matter and the gray matter. Finally the air and cerebrospinal fluid matter has been removed, thus processing the image for volume calculation. The brain MR image data set has considered as the input for the brain volume estimation system. The region of interest in the image has segmented and the volume has been measured on a regular grid in three dimensional spaces. The overall approaches involved in brain volume estimation system have been shown in Figure 6.
Various steps involved in the computation of the brain volume estimation:
Step 1: Read the MR images from the specified path;
Step 2: All the information of the DICOM images are displayed, with the use of the information voxel size is calculated;
Step 3: Explore the image data from the image viewer which is visualizing MRI data;
Step 4: Explore 3d volumetric data using Slice-OMatic GUI tool;
Step 5: Plotting the color map for the 3d image for which ignore low level threshold values such as background air, CSF, spatially low positions below brain mass and other soft tissues and also neglect high level threshold values such as skull and other hard tissues;
Step 6: Isolate brain mass and partition brain mass, if the value = 0 considered as outside the brain, if the value = 2 considered as gray matter, if the value = 3 considered as white matter;
Step 7: Total brain volume is calculated by multiplying the brain voxels with the voxel size;
Step 8: Volume of gray matter is calculated by multiplying the gray voxels and voxel size;
Step 9: Volume of white matter is calculated by multiplying the white voxels and voxel size;
Step 10: Gray fraction and white fractions are calculated using the formula by dividing the respective volume with the total volume.
Data access typically refers to software and activities related to storing, retrieving, or acting on data housed in a database or other storage area. Data access helps to get the image information like the pixel spacing, length, height of the image, pixel values, voxel size, image type, image format etc. as shown in Figure 7.
Visualization or volume rendering is a technique utilized to display a 2D projection of 3D on discretely sampled data set. A typical 3D data set is constructed with a group of 2D slice images acquired from the CT, MRI, or Micro CT scanner. Usually these are acquired in a regular pattern (e.g., one slice every millimeter) and usually have a regular number of image pixels in this regular pattern. This is an example of a regular volumetric grid, with each volume element or voxel represented by a single value that is obtained by sampling the immediate area surrounding the voxel. To render a 2D projection of the 3D data set, one first needs to define a camera in space relative to the volume. Also, one needs to define the
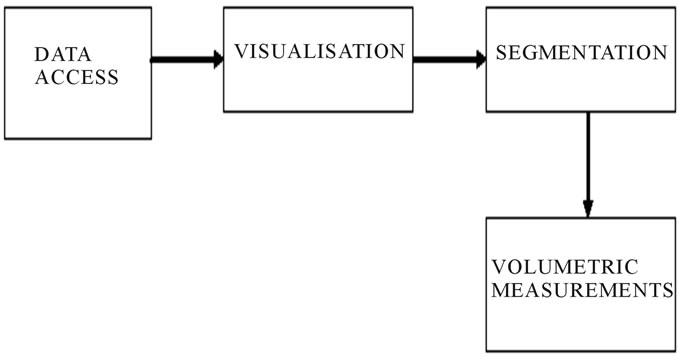
Figure 6. Architecture of the brain volume estimation system.
opacity and color of every voxel. This is usually defined using an RGBA (for red, green, blue, alpha) transfer function that defines the RGBA value for every possible voxel value.
A volume may be viewed by extracting surfaces of equal values from the volume and rendering them as polygonal meshes or by rendering the volume directly as a block of data. The Marching Cubes algorithm is a common technique for extracting a surface from volume data. Direct volume rendering is a computationally intensive task that may be performed in several ways.
Image segmentation is the course of action of partitioning an image into groups of pixels which are homogeneous with respect to some criterion. The goal of segmentation is to simplify and/or change the representation of an image into something that is more meaningful and easier to analyze. Image segmentation is typically used to locate objects and boundaries. Thus segmentation is concerned with dividing an image into significant regions for further computations. More precisely, image segmentation is the process of assigning a label to every pixel in an image such that pixels with the same label share certain visual characteristics. The result of image segmentation is a set of segments that collectively cover the entire image, or a set of contours extracted from the image. Each of the pixels in a region is similar with respect to some characteristic or computed property, such as color, intensity, or texture. Adjacent regions are significantly different with respect to the same characteristic which is represented in Figure 8.
In segmentation process, the cerebro-spinal fluid, air, skull, hard tissues, and dissolving thin surrounding tissues are separated. Partitioning the brain mass, separateing white matter and gray matter are also done in this process. A voxel (volumetric pixel) is a volume element, representing a value on a regular grid in three dimensional spaces. This is analogous to a pixel, which represents 2D image data in a bitmap as with pixels in a bitmap, voxels themselves do not typically have their position explicitly encoded along with their values. Instead, the position of a voxel is inferred based upon its position relative to other voxels. In contrast to pixels and voxels,

Figure 7. 3D volumetric data visualization of input MR image data set.

Figure 8. Color map distribution of 3D image.
points and polygons are often explicitly represented by the coordinates of their vertices.
A direct consequence of this difference is that polygons are able to efficiently represent simple 3D structures with lots of empty or homogeneously-filled space, while voxels are good at representing regularly-sampled spaces that are non-homogeneously filled. Voxels are frequently used in the visualization and analysis of medical and scientific data. Some volumetric displays use voxels to describe their resolution. Voxels size is calculated using following equations,


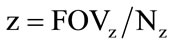 (for 3D imaging)
where,
FOV: Field-of-view;
x, y: MR Image coordinates;
z: The slice thickness; and
N: The acquisition matrix size in a particular direction.
In this case, fewer lines of k-space are acquired in the phase encoding direction. Lines furthest away from the centre of k-space are not acquired and are “zero-filled” instead. The acquired pixel size (sometimes called the Fourier pixel size) is more informative because it communicates the true limitations of the pulse sequence.
3. RESULTS
In this work, we examined the regional area of CC and the volume of the brain between the AD and control groups. Compared with the healthy persons, the CC showed significantly smaller area in patients with AD. In addition, the volume of the brain also reduced, in AD patients compared to healthy controls.
Only the sagittal MR images of the brain have been considered for the whole computations of CC area. Since, this is the only view which would provide the best information about the CC. We have considered 10 persons MR images of sagittal view and estimate the CC area. The same set of controlled group’s MR image data utilized for volume computation.
The MR Images of 10 subjects has been taken and the corpus callosum area has been extracted by the feature extraction techniques such as gradient mask method, ROI extraction and filling the ROI polygons. Then the CC area has been estimated by counting the total number of “on” pixels in the image. The 10 subjects who have been involved in the CC area calculation have in the groups of 30 to 80 years. The result findings proved that few cases suffered with AD which has been classified based on the normal range for the CC area. The normal CC area has been tabulated and observed that they are between 550 and 700 on pixels. The normal range set as 500 and 700 as shown in Figure 9. Then the system has been fed with sagittal view of MR image inputs of the AD patients and the area of the CC has been calculated. It was observed that the area of the diseased was found to be lesser than the range set. Thus it confirmed the pathology characteristic in AD. But the findings may not be exactly the same because different patterns of pixels are weighted differently.
As the disease progresses, patients have a noticeable decrease in brain size when compared to an average adult brain; these changes can be observed with MR images or through post mortem examination. The average adult human brain weighs 1200 to 1400 grams. Researchers at the Oregon Health and Science University studied the brain volume of Alzheimer’s disease patients and found that their brain size was 10 percent less compared to non-Alzheimer diseased brains which may have the reason of the patients with AD have abnormal protein formations in the brain. These also result in deterioration of neurological function and which would make the volume of brain 1080 to 1260 grams approximately. Although the nature of Alzheimer’s symptoms and progression is very slow to reach noticeable reduction in the brain size.
Based on the above study as reference, 160 slices of MR images in the coronal view has been taken for the same 10 set of patients to estimate the brain size. All the MR images have considered for the computation of brain size by displaying a 2D projection of 3D on discretely sampled data set. The Marching Cubes algorithm has been utilized for extracting a surface from volume data which may be the common technique provided the voxel size of the MR image data set. The position of a voxel has been inferred based upon its position relative to other voxels. The brain volume has been calculated by volume rendering i.e., exploring the data by intensity variation and separating the white and gray matter and hence multiplying the voxel count and voxel size. Observed results showed on Figure 10 and found that a 10 - 15 percent decrease in the brain volume of the diseased.
4. DISCUSSION
The size of corpus callosum (CC) and the total brain volume have been calculated to detect the AD. The area of the CC and volume of the brain of 10 various patients have estimated as shown in Figures 9 and 10. The results obtained have been tabulated as shown in Table 1. This Table shows the various patients brain volumes and CC sizes. Based on the physiological studies the normal

Figure 9. Estimated CC area based on non zero pixel.

Figure 10. Various volumetric measurement of brain.

Table 1. CC area and brain volume for different patients including Alzheimer’s diseased table type styles.
size of CC is from 500 to 700. The outcomes indicated on the table states that around 60% of the sample subjects affected with AD and the severity or stages of AD may be varied. This replicated on the results i.e. CC area and volume. The progress of the disease will also be very long duration. The estimated brain volume indicated that the same subjects have 10% to 15% reduction in their brain size compared with other normal cases. The results have been evaluated with the help of conventional diagnosis techniques utilized by physicians for AD detection.
The graphical analysis for CC size calculation and brain volume estimation has been shown in Figures 11 and 12. The measured area of CC and brain volume compared with the threshold values given by clinicians and stated that the reduced level of CC size and brain volume. Thus our system provides a better solution for the diagnosis as in earlier systems only a single parameter has been worked upon. Some other dementia cases has also been considered and identified by this work. But the proper clinical examinations and validations have been required for such brain disorders. The area of the corpus callosum and the brain volume was calculated for 10 sets of MR images in order to detect the abnormalities in them. The results obtained based on the methodologies applied has provided 90% better outcome which has been validated with physicians conventional diagnosis.
5. CONCLUSIONS
The neurological disorders have been an enigma for the neurologists since the inception of the disorders and their diagnosis. The proposed work for the detection of AD and other brain disorders have been made accurate to certain extent as both the important parameters i.e., the area of the corpus callosum and the volume of the brain has been measured automatically from a range of MRI images here. Thus our system provides a better solution for the early diagnosis. In this work we could observe other neurogenerative disorders like Parkinson’s disease and other dementias such as vascular and senile.
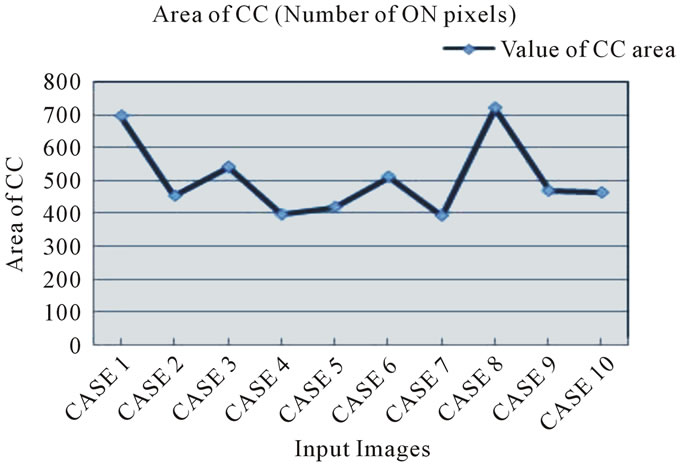
Figure 11. Statistics of the CC area for various patients including AD.

Figure 12. Statistics of the brain volume for various patients including AD.
The observed parameters have their own significance in pediatric brain disorders such as mental retardation, cerebral palsy, and other intellectual impairments. All these are mainly caused by any genetic disorders occurred in the infants. So, the same parameters have been considered for the diagnosis of brain disorders has taken place in infants and children. The proposed work would be implemented for the pediatric brain image data and identify the disorders well in advance to provide better care to the needy children. The manual intervention in CC segmentation could be eliminated by seed growing approach and further clinical data could also be considered and included for diagnosis refinement. The specific prediction and classification of the brain disorder could also be developed for pediatric applications.
6. ACKNOWLEDGEMENTS
The authors would like to thank Karunya University, Dr. N.G.P. Institute of Technology and Kovai Medical Center Hospital, Coimbatore for providing necessary facilities to carry out this work. They acknowledge the diligent efforts of Dr. L. Karthik Maharajan, Dr. R. Chellamuthu and Dr. J. Thirumalairajan in reviewing and supporting towards data collection. Also, the suggestions and comments of anonymous reviewers, which have greatly helped to improve the quality of this paper, are acknowledged.
![]()
![]()
REFERENCES
- Chandra, V., Ganguli, M., Pandav, R., Johnston, J., Belle, S. and DeKosky, S.T. (1998) Prevalence of Alzheimer’s disease and other dementias in rural India: The Indo-US study. Neurology, 51, 1000-1008. doi:10.1212/WNL.51.4.1000
- Dias, A. and Patel, V. (2009) Closing the treatment gap for dementia in India. Indian Journal of Psychiatry, 51, 93-97.
- Fitzpatrick, A.L., Kuller, L.H., Lopez, O.L., Kawas, C.H. and Jagust, W. (2005) Survival following dementia onset: Alzheimer’s disease and vascular dementia. Journal of the Neurological Sciences, 15, 229-230.
- Lyoo, I.K., Satlin, A. and Lee, C.K. (1997) Regional atrophy of the corpus callosum in subjects with Alzheimer’s disease and multi-infarct dementia. Psychiatry Research, 74, 63-72. doi:10.1016/S0925-4927(97)00009-7
- Sundaram, S.K., Sivaswamy, L., Makki, M.I., Behen, M.E. and Chugani, H.T. (2008) Absence of arcuate fasciculus in children with global developmental delay of unknown etiology: A diffusion tensor imaging study. Journal of Pediatrics, 152, 250-255. doi:10.1016/j.jpeds.2007.06.037
- Cooney, G., Jahoda, A., Gumley, A. and Knott, F. (2006) Young people with intellectual disabilities attending mainstream and segregated schooling: Perceived stigma, social comparison and future aspirations. Journal of Intellectual Disability Research, 50, 432-444. doi:10.1111/j.1365-2788.2006.00789.x
- Gharabaghi, A., Kunath, F., Erb, M., Saur, R., Heckl, S., Tatagiba, M., Grodd W. and Karnath, H.-O. (2009) Perisylvian white matter connectivity in the human right Hemisphere. BMC Neuroscience, 10, 15. doi:10.1186/1471-2202-10-15
- Good, C.D, Scahill, R.I. and Fox, N.C., (2002) Automatic differentiation of anatomical patterns in the human brain: Validation with studies of degenerative dementias. Journal of NeuroImage, 17, 29-46.
- Hampel, H., Teipel, S.J. and Alexander, G.E. (1998) Corpus callosum atrophy is a possible indicator of region and cell type-specific neuronal degeneration in Alzheimer disease: A magnetic resonance imaging analysis. Journal of Neurology, 55, 193-198.
- Tomimoto, H., Lin, J.X. and Matsuo. A (2004) Different mechanism of corpus callosum atrophy in Alzheimer’s disease and vascular dementia. Journal of Neurology, 251, 398-406. doi:10.1007/s00415-004-0330-6
- Thomann, P.A., Wustenberg, T. and Pantel, J. (2006) Structural changes of the corpus callosum in mild cognitive impairment and Alzheimer’s disease. Dementia and Geriatric Cognitive Disorders, 21, 215-220. doi:10.1159/000090971
- Teipel, S.J., Bayer, W. and Alexander, G.E. (2003) Regional pattern of hippocampus and corpus callosum atrophy in Alzheimer’s disease in relation to dementia severity: Evidence for early neocortical degeneration. Neurobiology of Aging, 24, 85-94. doi:10.1016/S0197-4580(02)00044-1
- Ashburner, J. and Friston, K.J. (2000) Voxel-based morphometry—The methods. Journal of NeuroIimage, 11, 805-821. doi:10.1006/nimg.2000.0582
- Bozzali, M., Falini, A. and Franceschi, M. (2002) White matter damage in Alzheimer’s disease assessed in vivo using diffusion tensor magnetic resonance imaging. Journal of Neurology, Neurosurgery and Psychiatry, 72, 742- 746. doi:10.1136/jnnp.72.6.742
- Baron, V., Chetelat, G. and Desgranges, B (2001) In vivo mapping of gray matter loss with voxel-based morphometry in mild Alzheimer’s disease. Journal of NeuroImage, 14, 298-309.
- Busatto, G.F, Garrido, G.E.J. and Almeida, O.P. (2003) A voxel-based morphometry study of temporal lobe gray matter reductions in Alzheimer’s disease. Neurobiology of Aging, 24, 221-231. doi:10.1016/S0197-4580(02)00084-2
- Silbert, L.C., Quinn, J.F., et al. (2003) Changes in premorbid brain volume predict Alzheimer’s disease pathology. American Academy of Neurology, 61, 487-492.
- Sateesh Kumar, H.C., Raja, K.B., Venugopal, K.R. and Patnaik, L.M. (2009) Automatic image segmentation using wavelets. International Journal of Computer Science and Network Security, 9, 305-313.
- Zhang, X.-P. and Desai, M.D. (1997) Wavelet based automatic thresholding for image segmentation. Proceedings of International Conference on Image Processing, Santa Barbara, 26-29 October 1997, 224-227.