Intelligent Information Management
Vol.6 No.2(2014), Article ID:43957,7 pages DOI:10.4236/iim.2014.62006
MissRF: A Visual Basic Application in MS Excel to Find out Missing Rainfall Data and Related Analysis
Pradeep Kumar Mohanty1, Dwitikrishna Panigrahi2, Milu Acharya3
1Department of Water Resources, Government of Odisha, Bhubaneswar, India
2Central Agricultural University, Gangtok, India
3Siksha ‘O’ Anusandhan University, Bhubaneswar, India
Email: pradeep5552002@yahoo.com, dwiti_2000@yahoo.com, milu_acharya@yahoo.com
Copyright © 2014 by authors and Scientific Research Publishing Inc.
This work is licensed under the Creative Commons Attribution International License (CC BY).
http://creativecommons.org/licenses/by/4.0/


Received 20 December 2013; revised 19 January 2014; accepted 18 February 2014
ABSTRACT
Hydrological analyses are often encountered with many missing periods of rainfall while designing developmental action plans for inaccessible and disadvantageous area. Visual basic based application software (to run in MS Excel) was developed to calculate and autofilled the missing rainfall data using widely followed Normal Ratio Method. The operational details of the software are described in the paper.
Keywords:MissRF; Normal Ratio Method; Visual Basic; MS Excel

1. Introduction
Continuous meteorological data of contiguous stations are extremely important for forecasting and planning developmental activities in agriculture. Meteorological parameters change erratically at short intervals both spatially and temporally. It’s a huge task to accumulate data at decentralised locations, particularly for the developing and under developed countries because of inaccessibility and difficult field situations. Rainfalls being one of the most important meteorological parameters, numbers of statistical methods are in use for filling of the missing rainfall data with varied logical and technical considerations. Dynamics of short term rainfall has a significant role in hydrological planning [1] and the missing periods need therefore be filled up for better analysis, prediction and efficient rainfall-runoff modeling [2] . Simple (simple arithmetic average, normal ratio or NR, and NR weighted with correlations) as well as complex type neural network, and multiple imputation strategy adopted by Monte Carlo Markov Chain based on expectation-maximization or EM-MCMC) methods are used for calculation of missing rainfall values [3] . [2] , [4] and [5] have also mentioned about different logical concepts and mathematical applications, which requires intensive calculations and computations.
Temporal as well as spatial correlation is required for near accurate calculation of missing values of rainfall in a particular station. The more decentralised stations we go, the less difference of rainfall value we may get. Normal ratio method (Equation (1)) is one of the existing conventional methods, suitable for gap filling of the rainfall records particularly when the normal annual precipitation at any index station differs from that of the interpolation station by more than 10% [6] [7] . [8] have used this method at various places of the world. The method is one of the simpler ways of predicting missing values [3] , but repeating calculations makes it hectic if the number of records is very large.
 (1)
(1)
Where,  = Missed rainfall of Station-
 to be filled;
  = Annual Average rainfall of Station-
 ;
;  ,
,  ,
,  and
and  and
and  ,
,  ,
,  and
and  corresponding rainfall values of Stations-
 and annual average rainfall values of Stations-
 , respectively; n = number of stations for which rainfall data are available.
2. Methods and Materials
An attempt was therefore made to develop a software code using Microsoft-Excel Visual Basic Application for gap filling of the missing rainfall data based on the “Normal Ratio” method. The rainfall of the 12 community development blocks (CDBs) of Kandhamal district in Odisha state of India were used as an example for this. The district is one of the most undeveloped regions of the country and the world as well and therefore has a large number of missing values in terms of rainfall and other metereological parameters even on daily, weekly and monthly basis.
3. The Software Code
The software comprises 389 lines of code in Visual Basic Application, which is to be copied in the code window of the Excel object (Microsoft Excel 3.1 or later version) in a separate module so that it can run in all open workbooks. It can also be used with creation of a macro button in the Menu bar to run the program. It will not affect the original data file; rather the output file after gap filling was stored in the root C:\ directory with a new file name. The message box at appropriate stages of the program kept the user alert for any apprehension.
The advantage of this code is that, unlike earlier coding procedures like FORTRAN etc. It does not require any particular data format. The rainfall data are to be kept in Excel sheets (separate sheet for individual stations) and the message box at appropriate stages, while running the program, kept the user alert for any apprehension.
The flow chart of the running of the programme is shown in Figure 1. With installation of the software, a new icon will be added to the “Quick Access Toolbar” of the MS Excel sheet at the top of the screen as in Figure 2. The first row and the first column of the excel sheet are for the name of the months and the name of the years, respectively. The actual rainfall data may therefore entered from the “B2” cell (Figure 3). Figures 4, 5 shows the initial message box that appeared just after clicking the “MissRF” icon on toolbar. It displays a set of instructions with the default option of “No”. Once “Yes” button was clicked, the program starts executing. Then the program fills the gaps existing in the respective stations in different sheets as per the equation of Normal Ratio Method. The filled in data are then reformatted in a different colour and saved in a different file name not affecting the original file. Soon after the program execution is complete, another message box (Figure 5) appears to indicate the end of program execution. After gap filling by the program, the new Excel file was stored in the root directory C:\ with a new file name having “-Norm” extension to the original file name as shown in Figure 6. The program, not only fills the gaps, but also calculates; year wise total value, monsoon total and yearly average values to be used for further analysis.
4. Conclusion
The 389 lines code Visual Basic Application software to be used as a Microsoft Excel object is observed to be a
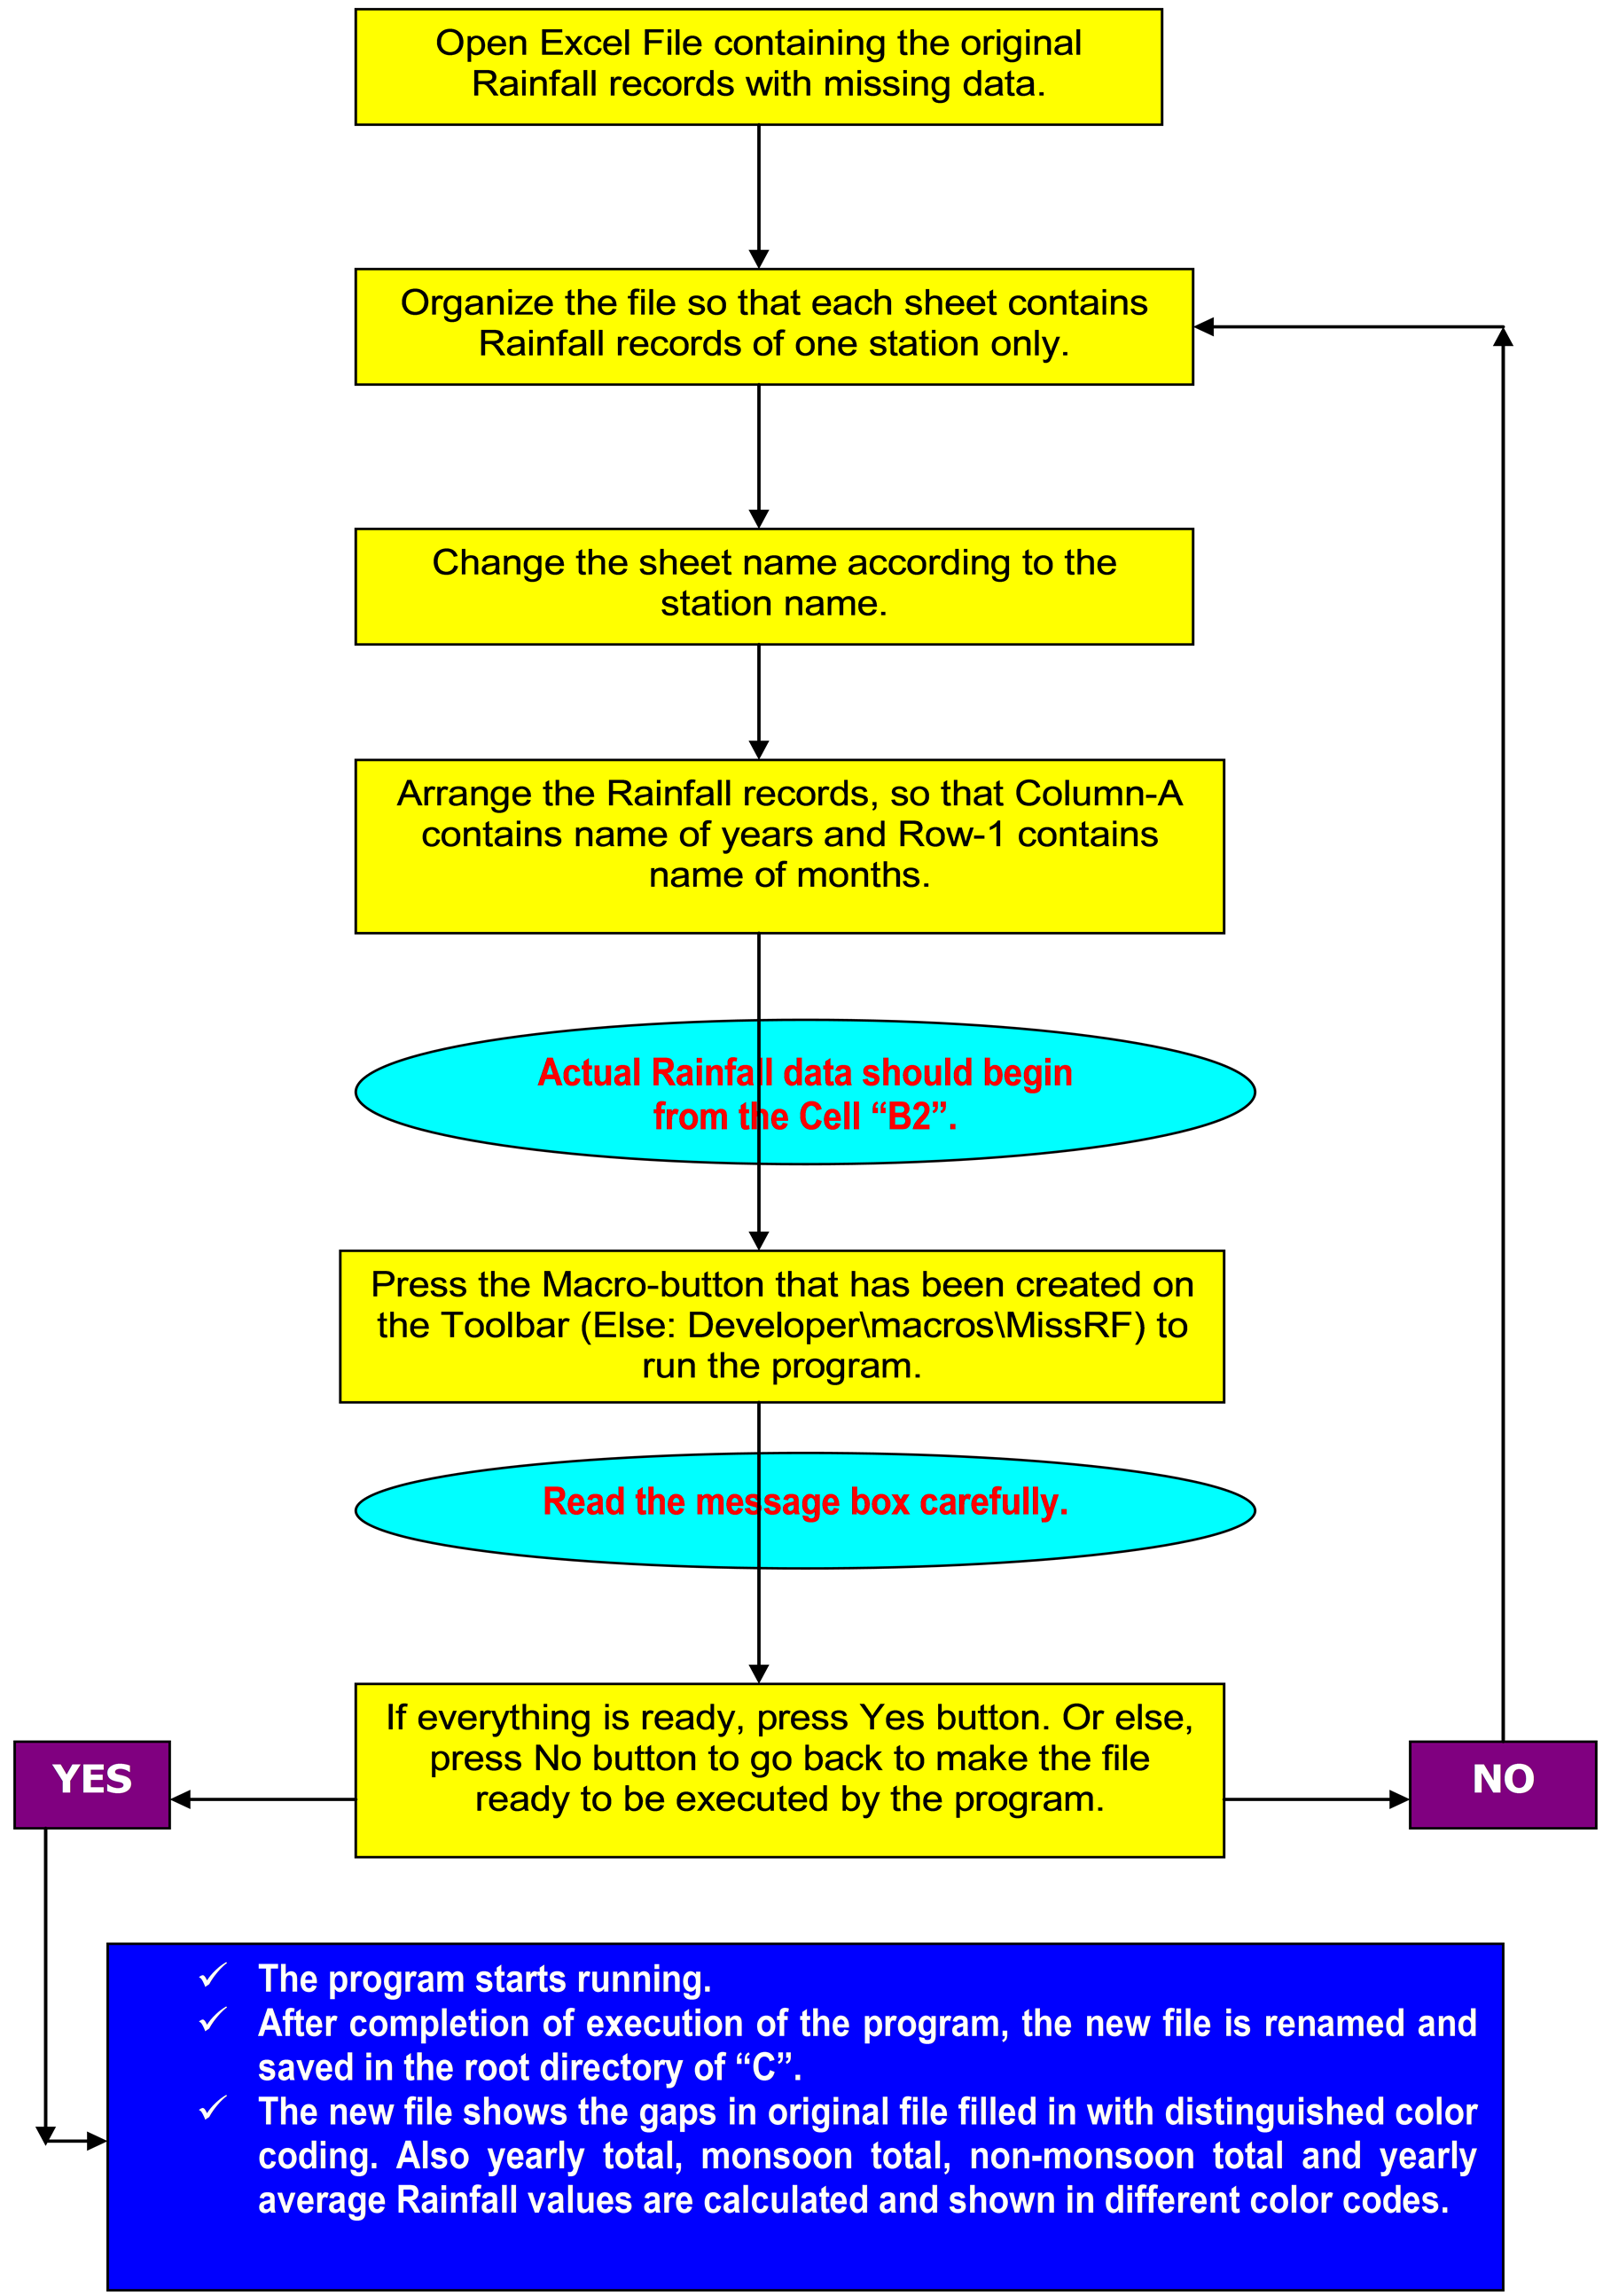
Figure 1. Flow chart of running of the programme (MissRF) to calculate missing rainfall.
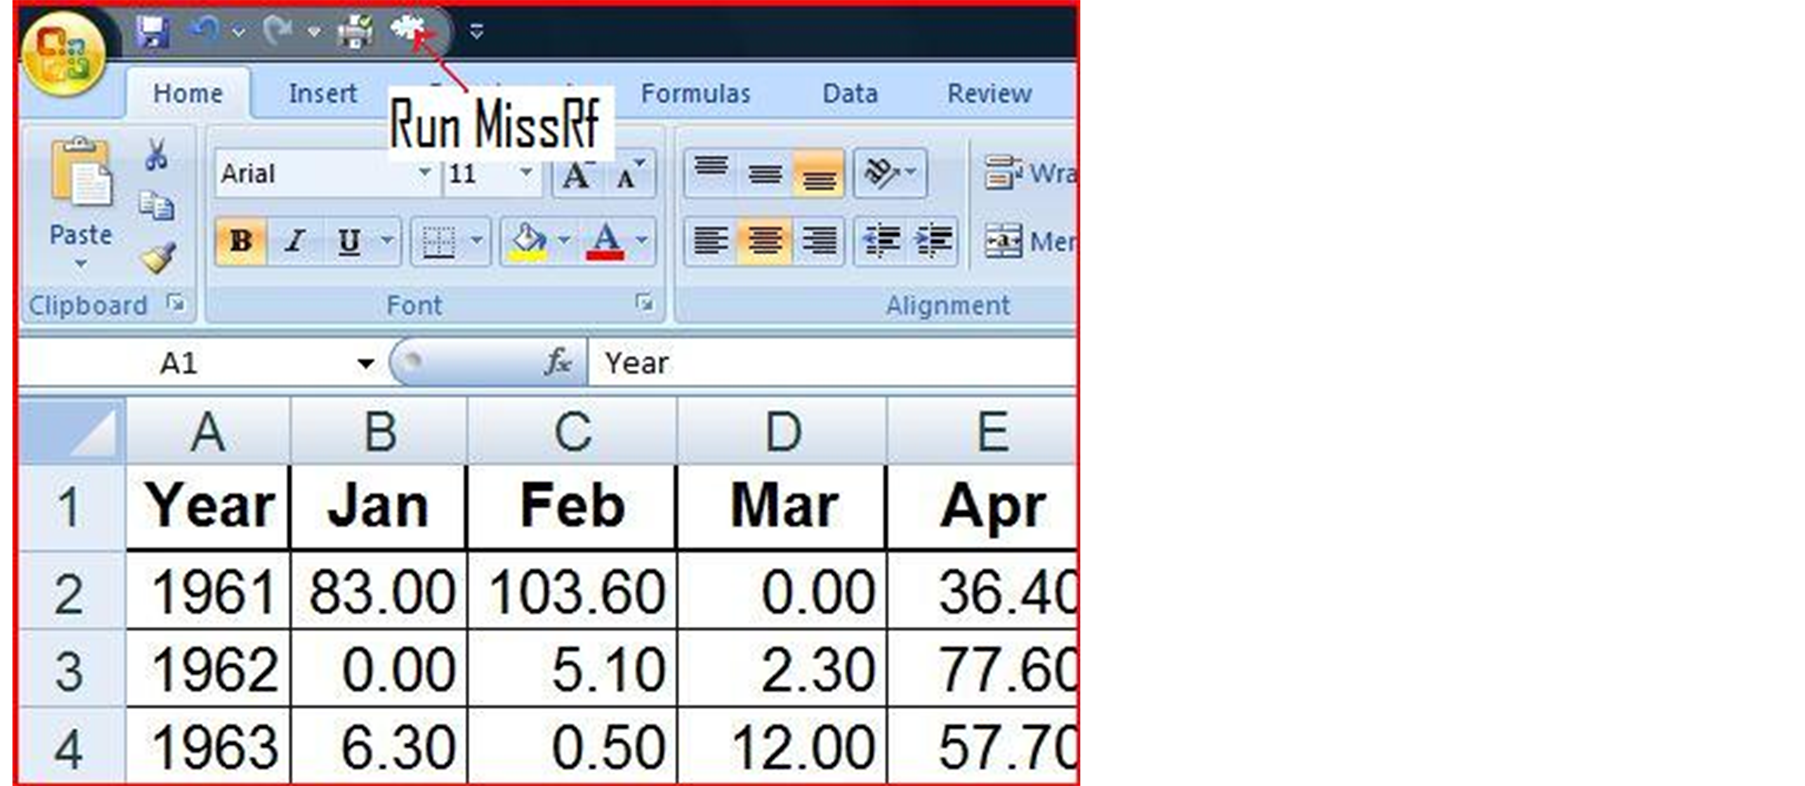
Figure 2. MissRF icon on toolbar.
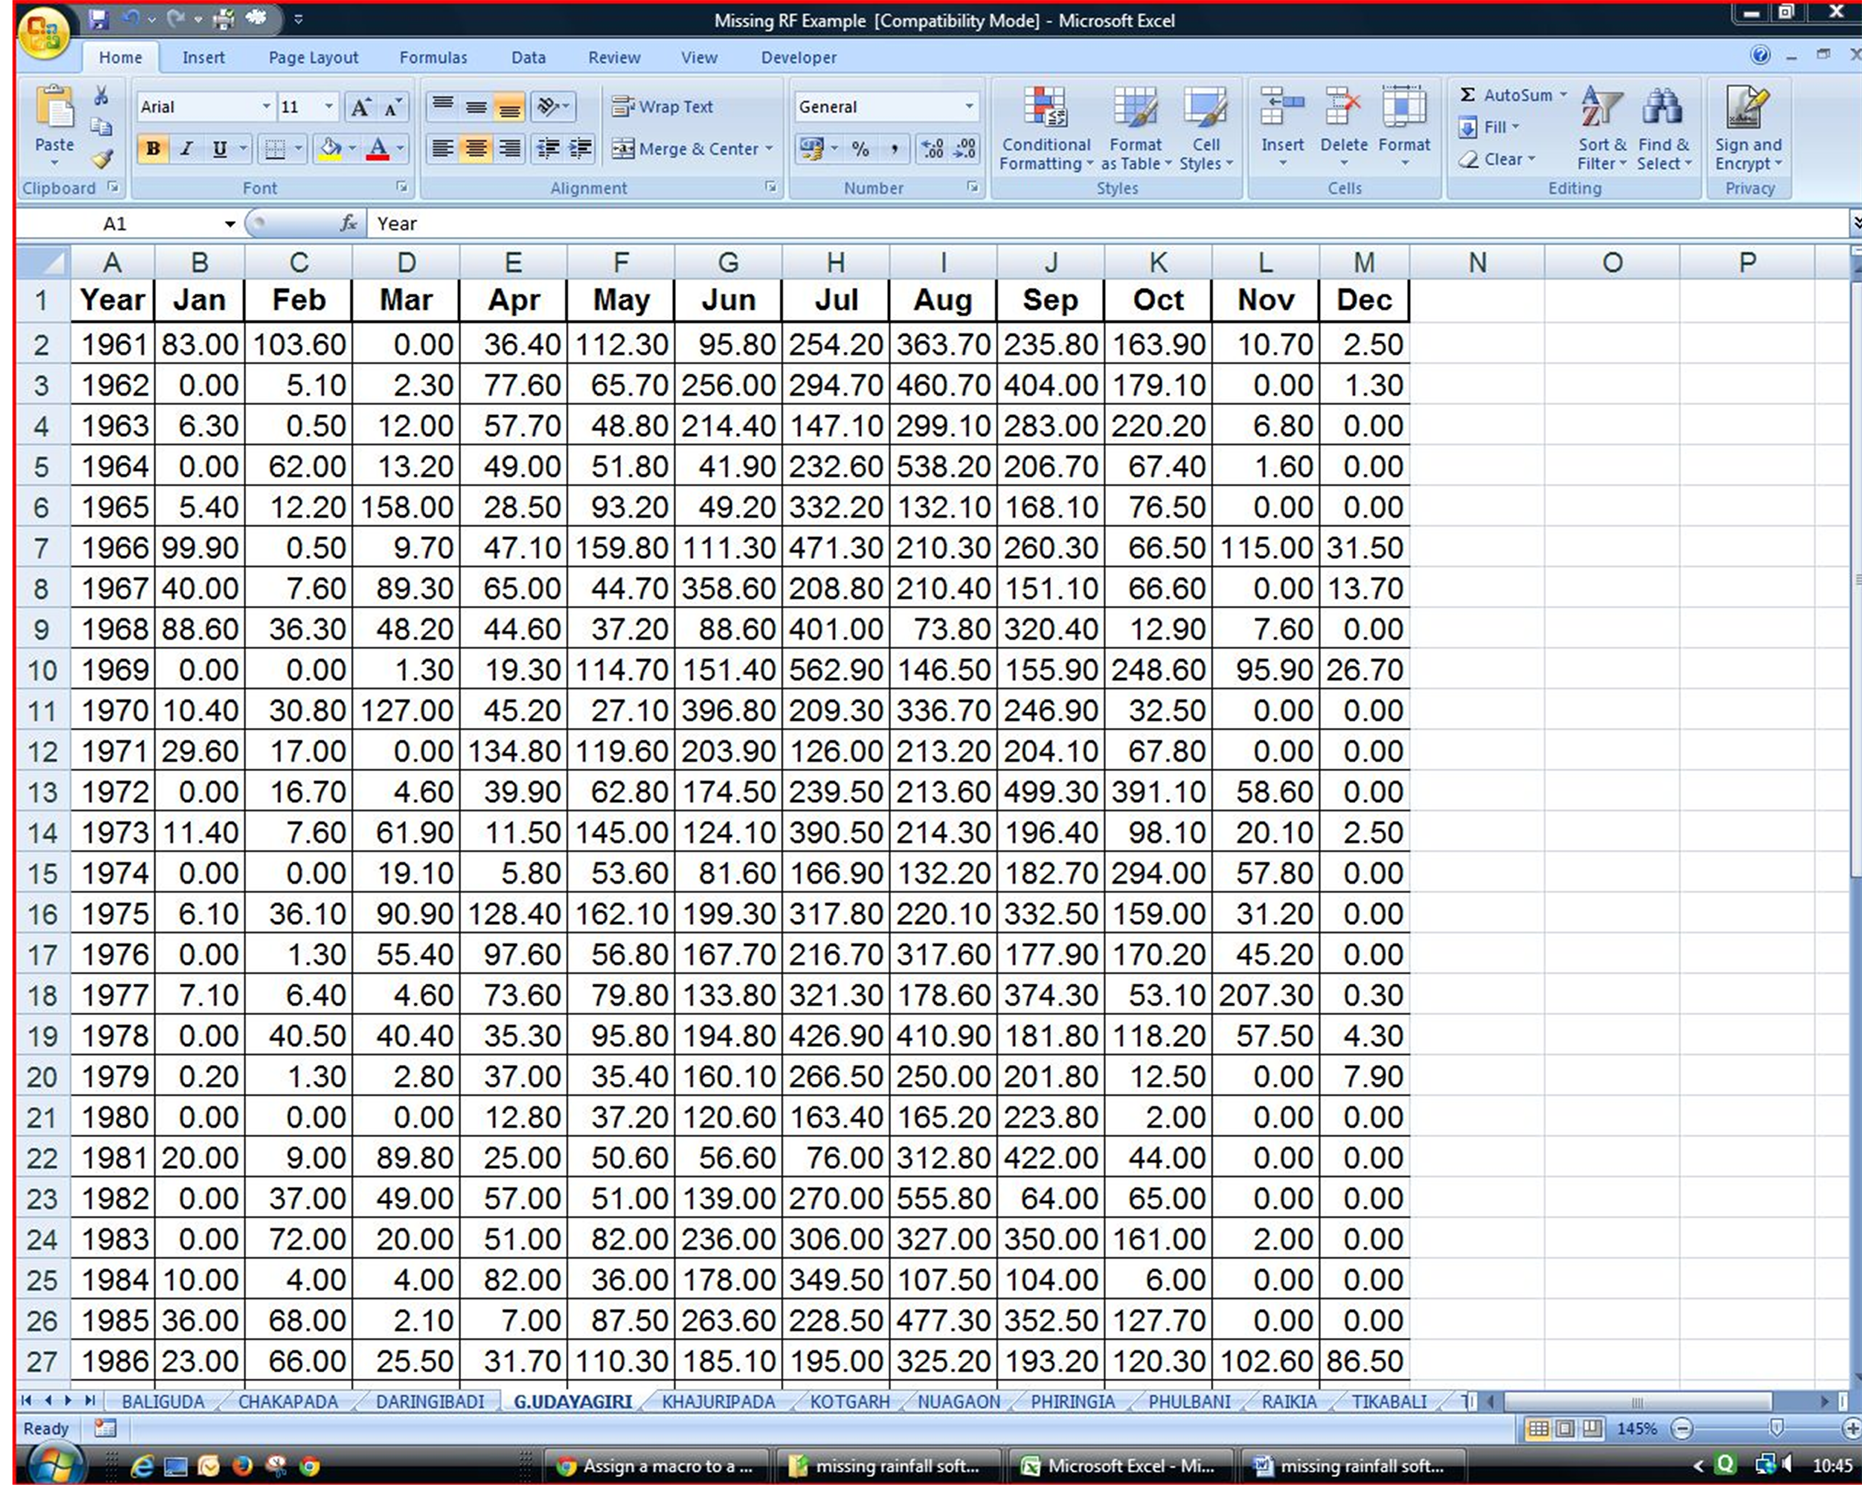
Figure 3. Input data format.
user-friendly application tool for gap-filling of missing rainfall data considering Normal Ratio method. The code is simply to be copied to the code window of the Excel object in a separate module so that it can be run in all open workbooks. It will be easier if one Macro Button is created in the Menu bar to run the program. The ad-
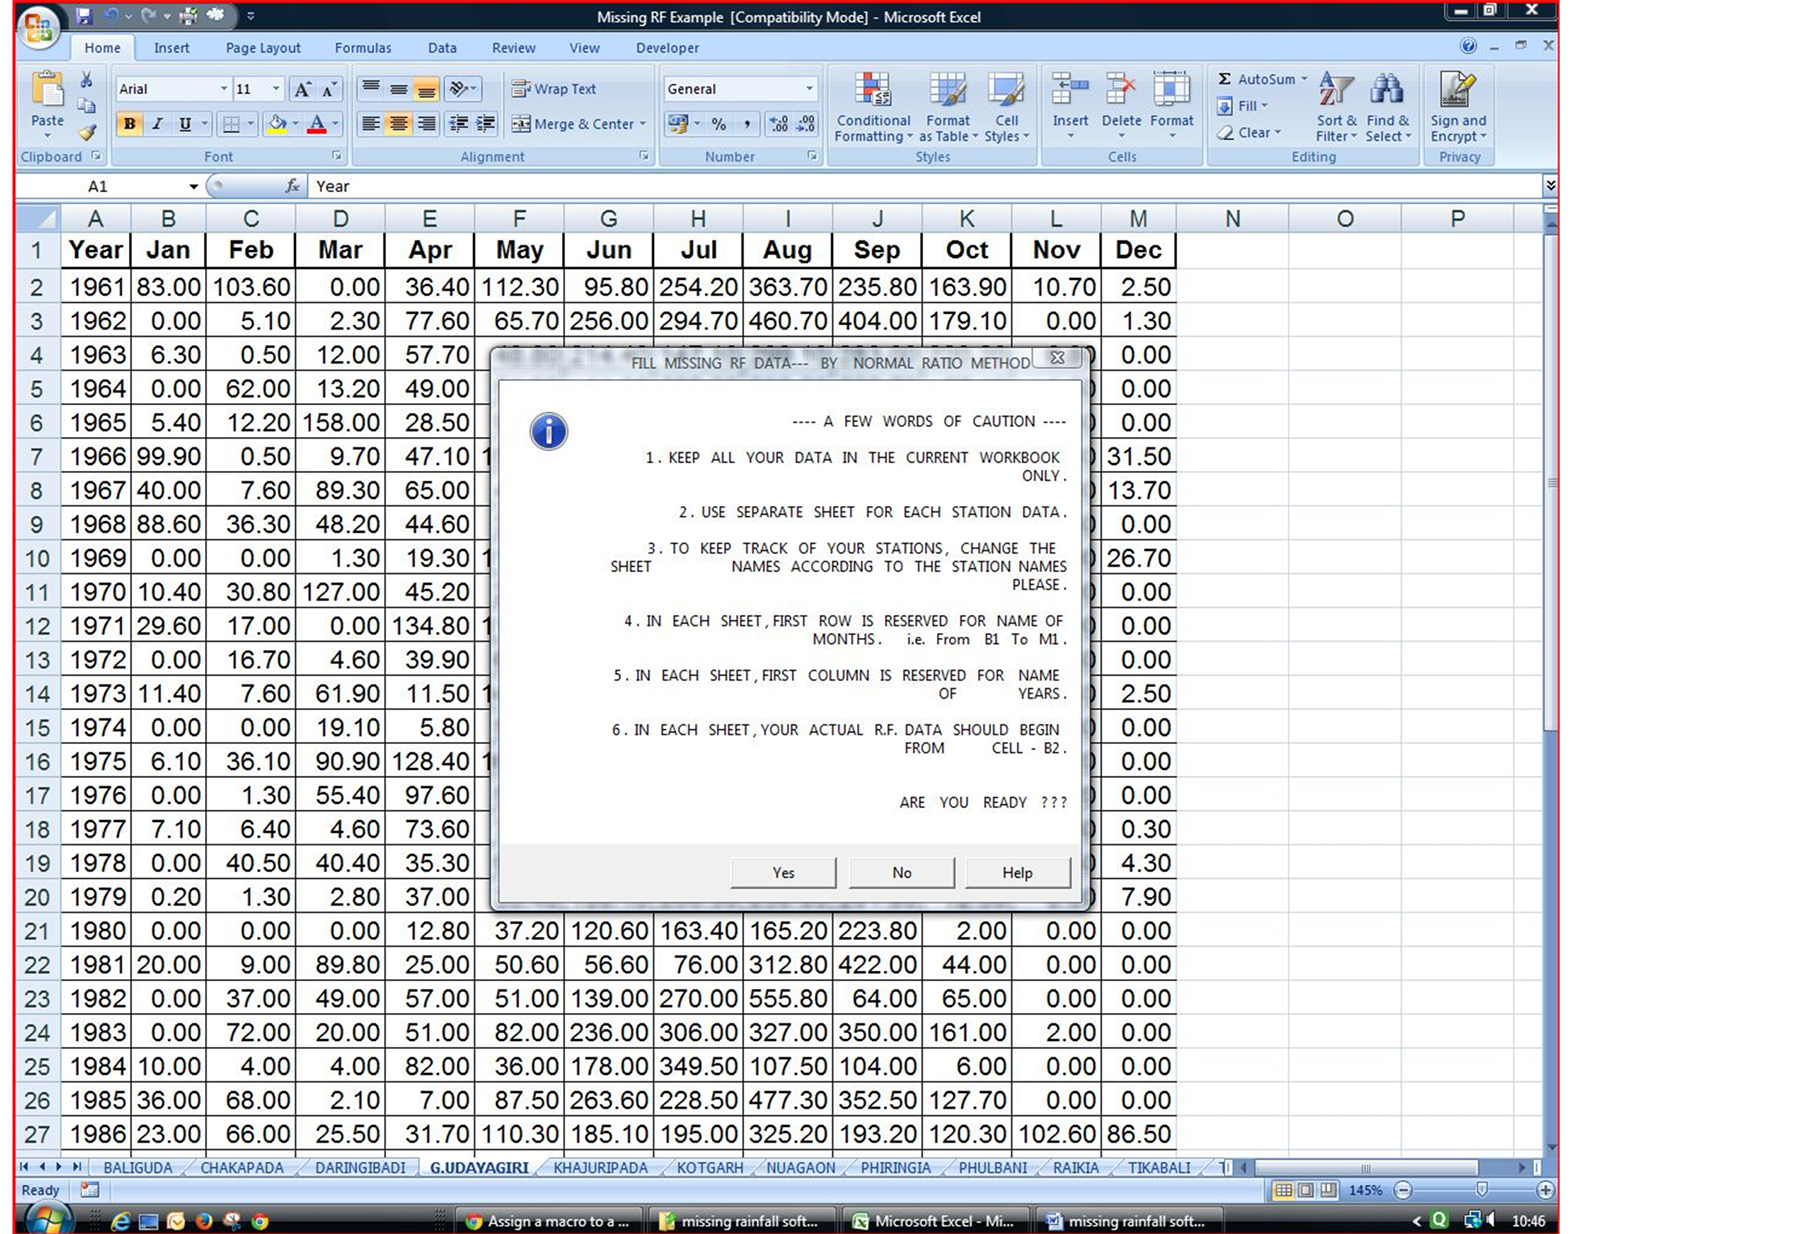
Figure 4. Message box before program execution.
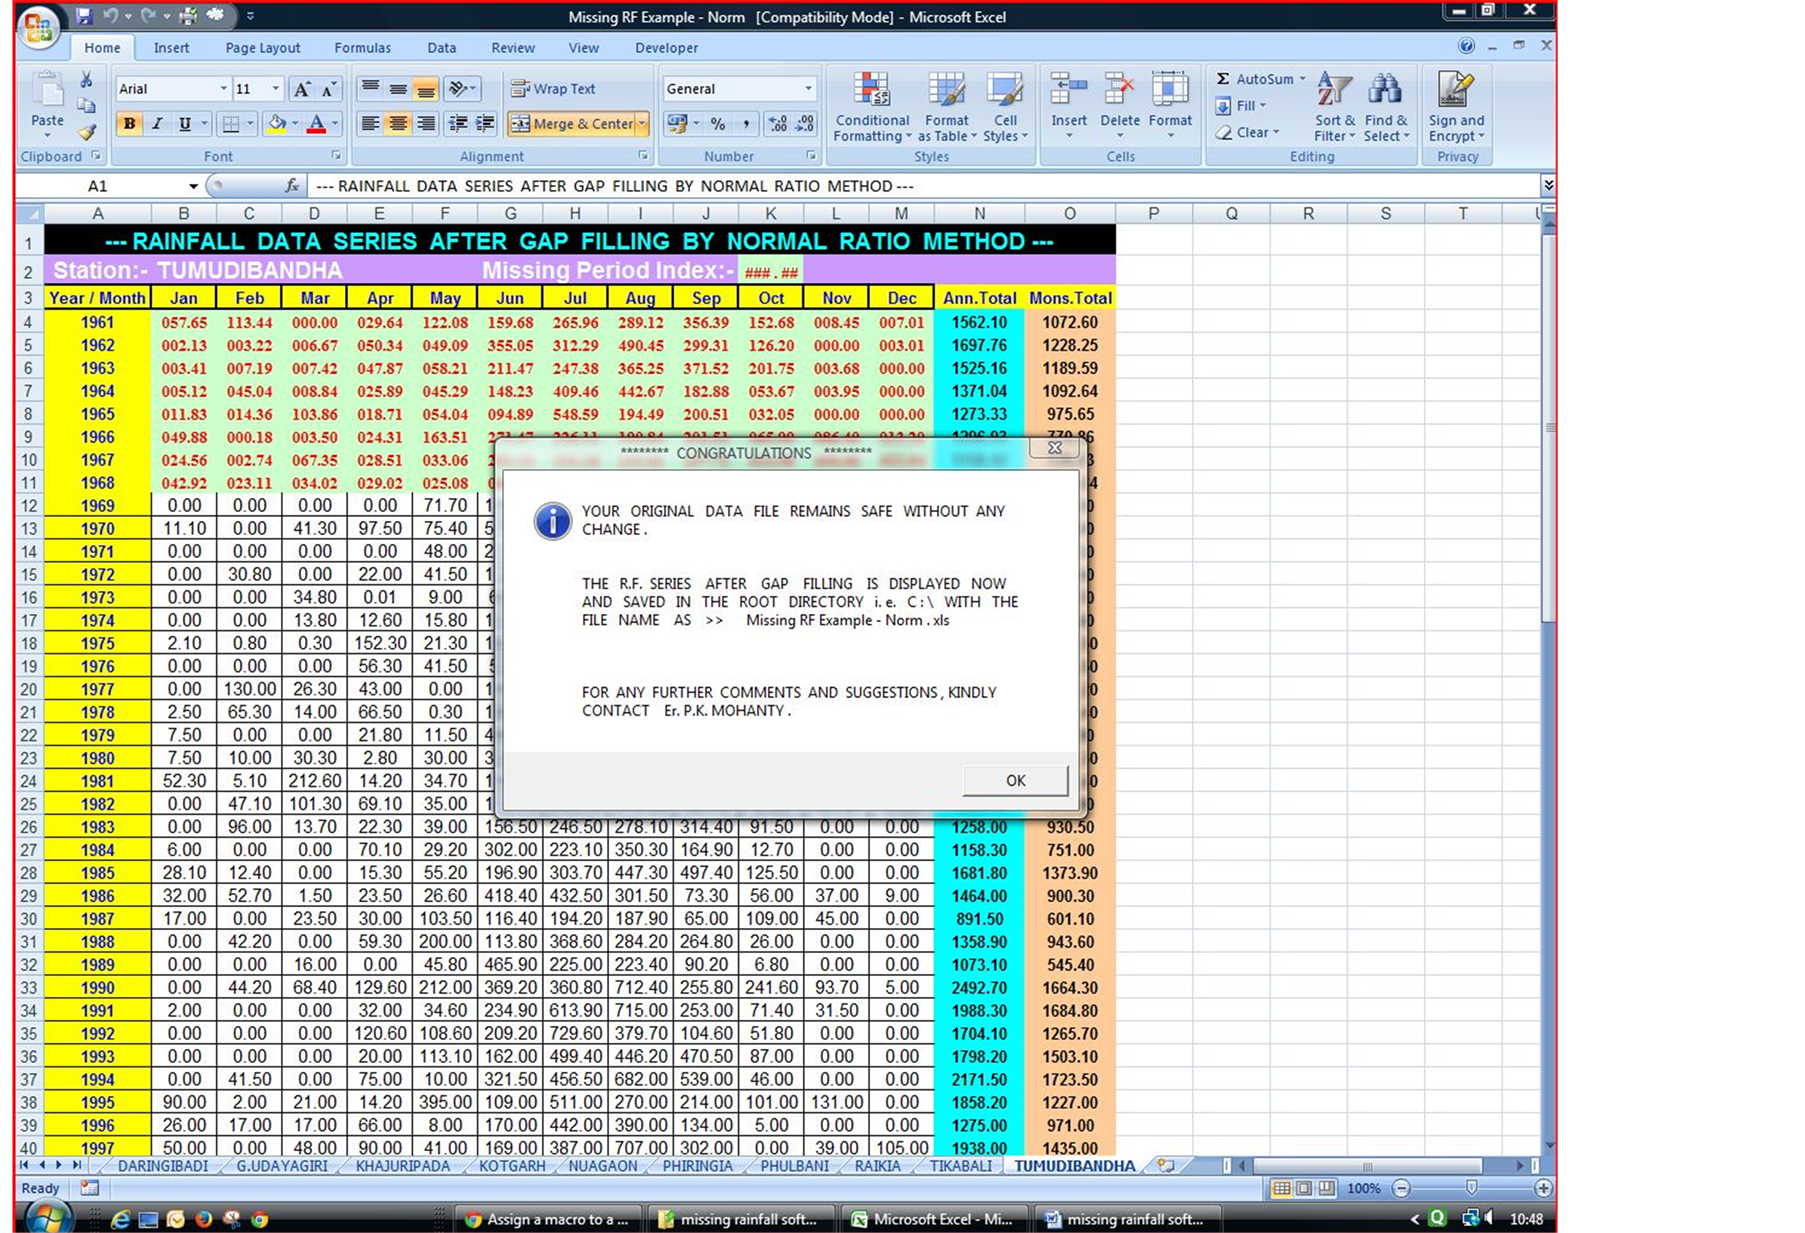
Figure 5. Message box after end of program execution.
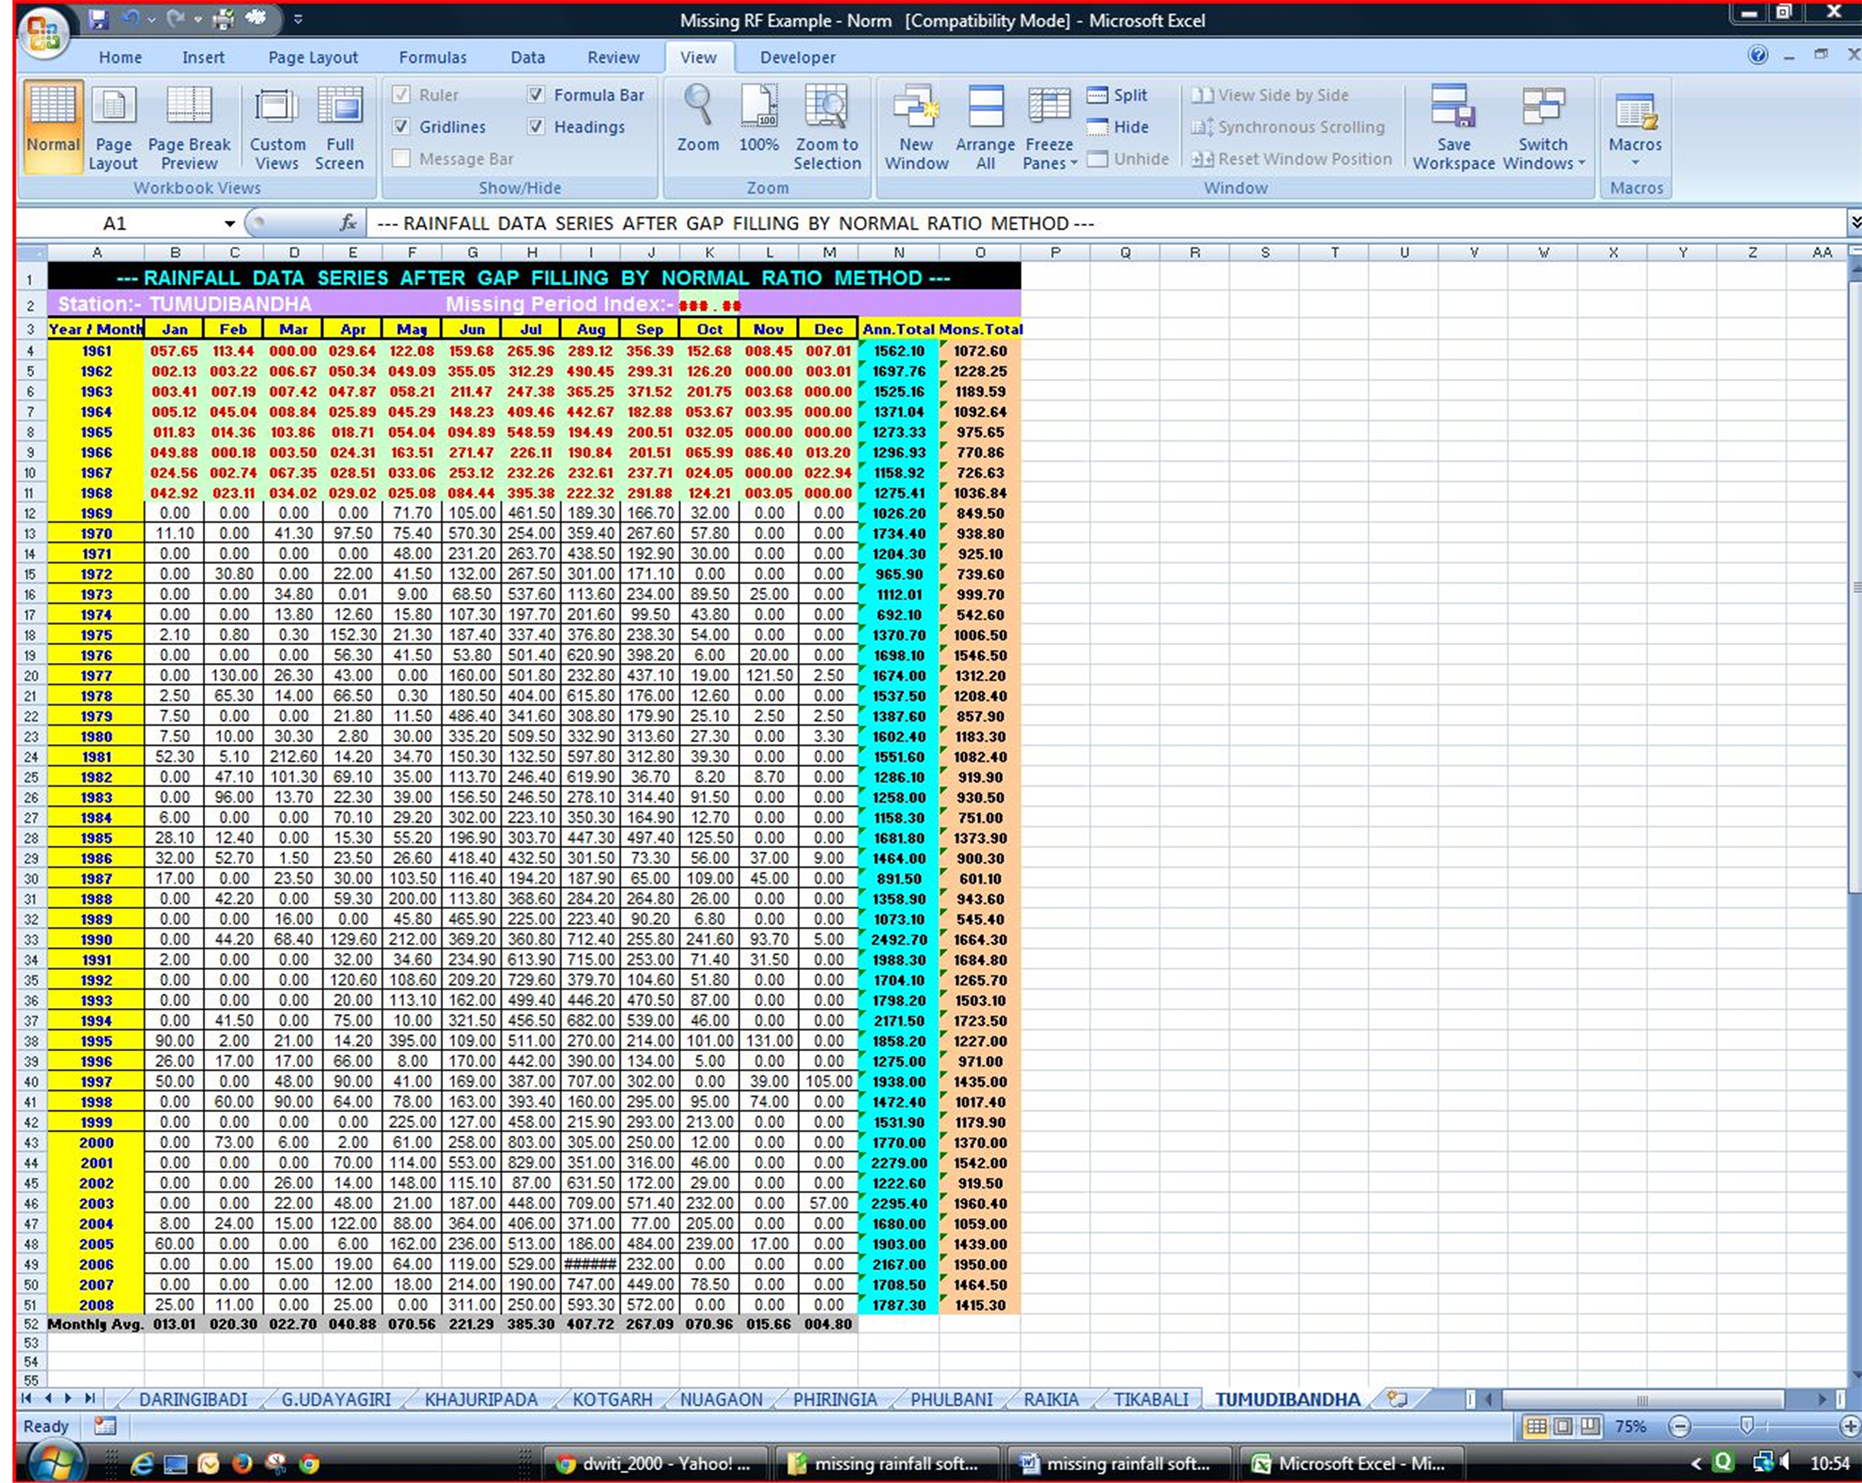
Figure 6. Rainfall data series after gap filling.
vantage of this code is that it does not affect the original data file; rather the output file after gap filling is stored in the root C:\ directory with a new file name. The message box at appropriate stages of the program keeps the user alert for any apprehension. The above codes are operative for finding out the missing monthly data. But for the missing daily data, the program needs to be redesigned.
References
- Wahab, K.A. (2009) Application of Fuzzy Logic to Simulation of Rainfall in Kerayong River Catchment. M.Sc. (Civil Engineering) Thesis, Universiti Teknologi, Mara. http://eprints.uitm.edu.my/6136/
- Roman, U.C., Patela, P.L. and Poreya, P.D. (2012) Prediction of Missing Rainfall Data Using Conventional and Artificial Neural Network Techniques. ISH Journal of Hydraulic Engineering, 18, 224-231. http://dx.doi.org/10.1080/09715010.2012.721660
- Yozgatligil, C., Aslan, S., Iyigun, C. and Batmaz, I. (2012) Comparison of Missing Value Imputation Methods in Time Series: The Case of Turkish Meteorological Data. Theoretical and Applied Climatology, 112, 143-167.
- Kajornrit, J., Wong, K.W. and Fung, C.C. (2012) A Comparative Analysis of Soft Computing Techniques Used to Estimate Missing Precipitation Records. International Telecommunications Society 19th Biennial Conference, ITS 2012, Bangkok, 18-21 November 2012, 9 Pages. http://researchrepository.murdoch.edu.au/11393/
- Gadgay, B., Kulkarni, S. and Chandrasekhar, B. (2012) Novel Ensemble Neural Network Models for better Prediction using Variable Input Approach. International Journal of Computer Applications, 39, 37-45. http://dx.doi.org/10.5120/5082-7268
- Tang, W.Y., Kassim, A.H.M. and Abubakar, S.H. (1996) Comparative Studies of Various Missing Data Treatment Methods. Atmospheric Research, 42, 247-262
- Hagos, B. (2011) Hydraulic Modeling and Flood Mapping of Fogera Flood Plain: A Case Study of Gumera River. M.Sc. (Civil Engineering) Thesis, Addis Ababa University, Addis Ababa.
- Räsänen, T.A., Koponen, J., Lauri, H. and Kummu, M. (2012) Downstream Hydrological Impacts of Hydropower Development in the Upper Mekong Basin. Water Resources Management, 26, 3495-3513. http://dx.doi.org/10.1007/s11269-012-0087-0