iBusiness
Vol.6 No.1(2014), Article ID:43642,11 pages DOI:10.4236/ib.2014.61003
Authorized Service Vendors in Mobile Terminals Voice
Andi Mwegerano, Jyrki Sippola
Nokia Corporation, Salo, Finland
Email: andi.mwegerano@nokia.com, jyrki.sippola@gmail.com
Copyright © 2014 by authors and Scientific Research Publishing Inc.
This work is licensed under the Creative Commons Attribution International License (CC BY).
http://creativecommons.org/licenses/by/4.0/


Received 17 December 2013; revised 15 January 2014; accepted 14 February 2014
ABSTRACT
This study examines whether authorized service vendors (ASV) for mobile terminals (MT) are satisfied with the original equipment manufacturer (OEM) in terms of service provided to them and also how the ASV is performing at their premises. A seamless relationship between the OEM and the ASV is essential for both sides to prosper in this business. When the ASV supplies good services to end-users, this contributes to an increase in the customer satisfaction rating, loyalty and retention. The study employs an exploratory research design; in-depth survey interviews were carried out in six different ASV in Europe. The study was conducted at Nokia Corporation in Finland. The survey analysis of the association between category variables is descriptively analyzed. The main findings in this work were that the ASV is satisfied with the MT product manufacturer, and that the internal working practice of the ASV organization was perceived as more positive than negative. From the OEM side, the issue resolution time (iRT) and training before product launch are items that should be focused on in the first place, as these affect customer satisfaction. The ASV management should seek a way to share the end-user customer feedback to the ASV teams, and internal information communication should also be improved.
Keywords:Authorized Service Vendors (ASV); Survey, Mobile Terminals (MT); Correlation

1. Introduction
A seamless relationship between the equipment manufacturer and the mobile terminals repair service done by the authorized service vendors (ASV) is essential for both sides to prosper in this business. Success for one party equals success for the other party; a win-win situation is created. When an ASV supplies good services to end-users, this contributes to an increase in customer satisfaction rating, loyalty and retention. Figure 1 illu-
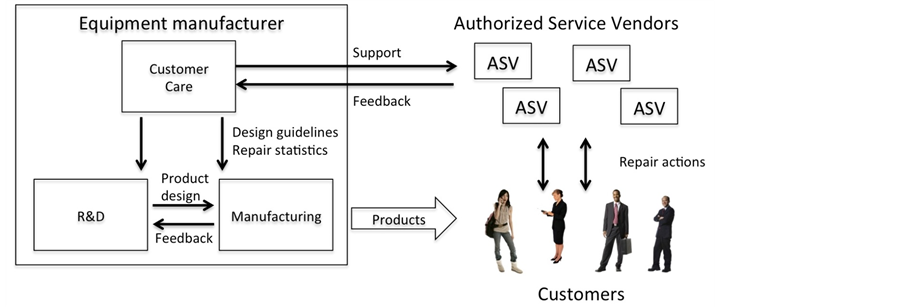
Figure 1. A simplified block diagram of the chain network providing customers’ issues corrective actions.
strates the interaction between customers, ASV and the equipment manufacturer of mobile terminals (MT).
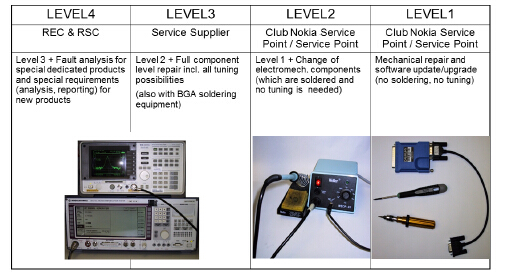
Authorized service vendors (ASV) are sub-grouped into 4 levels according to what they are allowed to service (see diagram in Appendix 4). The survey was done for all 4 different groups in six countries. Most of the issues reported by the customers are resolved at one of the nearest ASVs. When an issue cannot be resolved by an ASV, the issue is escalated via an in-built house tool to the customer care of the equipment manufacturer, in this case, of the MT manufacturer. The customer care organization with its technical support technicians/engineers resolves the issue and escalates the issue corrective action (iCA) to the ASV who then, after implementing the resolution, contacts the customer for final closing of the issue if the customer is satisfied. If the escalated issue from the ASV to customer care cannot be resolved at that stage, then the issue is escalated to the research and development group (R & D) for corrective action. All lessons learned from the field by the technical support staff in the care organization are fed back to R & D to improve the functionality of the next product generation and to prevent the same issue from occurring in future. There is a mutual cooperation between R & D and the manufacturing factory. Most of the issues are captured and corrected in the factory before the products are out in the field. But there are always some issues that arise in the field which were not visible in the factory, and these are noted by end users, who in turn report them to the nearest ASV, who in turn escalate the issues to the manufacture’s customer care support if they can’t resolve those issues by themselves. This could be, for example, a manufacturing issue or software bug which could not be corrected simply by updating the terminal.
This study investigates whether the authorized service vendors (ASV) in mobile terminals (MT) are satisfied with the original equipment manufacturer and also how the ASV is performing at their premises. The investigation was done through three research questions including: 1) How satisfied are the ASV providers with the support from the mobile terminal manufacturer? 2) How do the ASV providers judge their own internal organization and development? and 3) How does work experience affect the employees’ perceived quality of working conditions, for example training and support? Based on the research observation, action points were defined for improving the relationship between the two parties in order to increase customer satisfaction among the mobile terminal users.
The rest of this paper is organized as follows: First we go through the literature review in section 2. In section 3 we describe the data collection and method used for analyzing the data. In section 4 we present the results of the data analysis. In section 5 a summary and discussion is presented. Finally in Section 6 the conclusions of the study are presented.
2. Literature Review
According to Koufteros [1] , due to fearful competition and rapid changes in business, product manufacturer companies are seeking and doing cooperation with companies or vendors to keep their business sustainable. Among giants like Nokia, Lucent, Microsystems, etc. there are few examples of companies who have implemented the idea of not “doing it alone”, as one researcher [2] , who stated that business value can be created through chain supply integration. Supply firms having partnerships with other supply vendors render a mutual benefit on both sides [3] . With this in mind, the co-operations between mobile terminal manufacturers and authorized service vendors should be a win-win situation. It’s vital that the companies keep their employees and customers both satisfied, as this brings significant business success [4] [5] ). However, according to Larsson and Bowen [6] , it can be difficult to control customers involved in the service process.
Customer satisfaction (CS) is changing as new technologies evolves, and hence to measure the level of CS longitudinal surveys should be carried out continuously. By doing so the firm suppliers can learn from their customers what to improve and leave away things that do not bring any added value to the customers. A CS survey, if done correctly, can be an effective way to measure CS and loyalty. However, it should be noted that the factors that impact on CS are not necessarily the same factors that influence customer loyalty (CL) [7] .
Technical support for aftermarket sales in MT involves among other things supporting training for new products, providing spare parts for repairs, bulletins with new information regarding the products, and software for flashing or upgrading the software versions. According to Koskela [8] , service managers in the field in hightechnologies companies face five major challenges: “recruiting and retaining personnel, simplifying process, scheduling, controlling spare parts inventory, and formulating policy relating to obsolete equipment.”
It is vital that the communication between suppliers and vendors functions well for keeping the business beneficial and growing. One of the areas that could reduce the manufactures costs is reducing after sales warranty costs. This can be achieved by providing proper trainings to the vendors at the same time as the companies take seriously the feedback from the vendors not to repeat the same issues with future products [9] .
3. Data Collection and Method
This chapter explains the data collections procedures used in this article. The methods used to analyze the data are also explained.
3.1. Data Collection
It is in the interest of mobile terminal manufacturers to find out how the terminal ASV network is doing. One way of finding out is through regular survey questionnaires. In this paper a survey questionnaire, containing 37 questions, were sent to 6 different countries (C1-C6) in Europein 2011. The countries C1-C6 are anonymous due to business reasons. However it can be said that 4 countries belongs to the eastern European countries and 2 countries belongs to Western Europe. The criteria for selecting these countries based on their repair and service activities. Those ASV with higher activities were involved in this study. Another motive was to compare the differences of performances between eastern and western European ASVs, but this part is beyond the scope of this paper. The questions were translated into the local country language. The respondents from each country are displayed in Figure 2.
A total of 211 survey responses using the 5-point Likert scale were received from the six countries. On the scale, 1 was the most favorable response to a question and 4 was the least favorable response to the question. A response of 5 point indicated “don’t know” answer, but these were later discarded in the analysis phase due to the absence of information they provided.
3.2. Method
The data was analyzed by finding the average and mean values for responses given by different ASVs in the six countries. The correlation between questions and responses were calculated, and finally, the correlation of work experience among the ASV. The results of the items are presented in Appendices 1 to 3. The opinion section of the questionnaire was coded on a numerical scale from 1 to 4, where 1 equals “Strongly agree” and 4. “Strongly disagree”. The favorable or positive view means a smaller value. If a person answered “I don’t know” or left the question unanswered, the result was not included in the calculations.
The questions were grouped into two categories. Category “Internal” (I) contains questions in which the positive or negative feedback is mostly defined by the internal factors in ASV’s company (e.g. procedures, practices and resources). Category “External” contains those questions which are mainly factors external to ASV organization. In the questionnaire, the external category questions are especially focusing on relationship and support from the OEM Company.
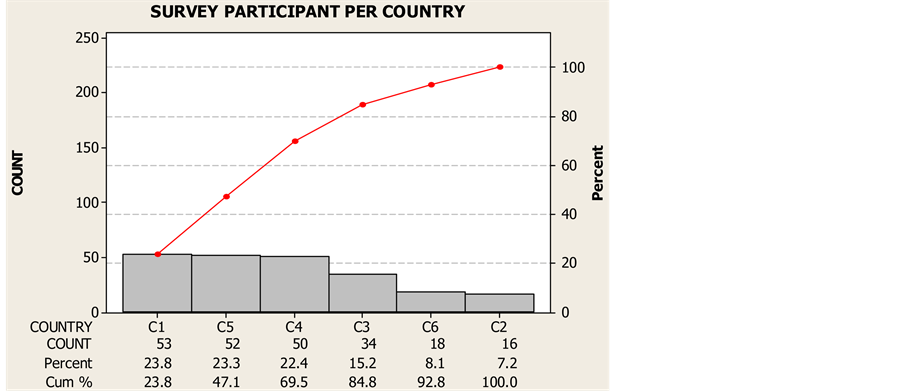
Figure 2. Survey participants by country.
4. Analysis Results and Discussion
4.1. Descriptive Statistics
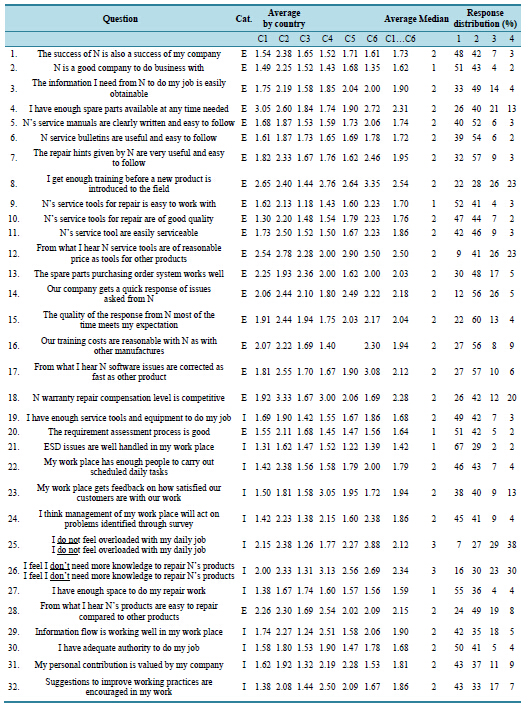
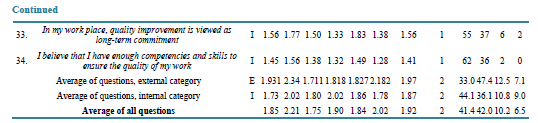
First, the average values were calculated for all answers, by country as well as by category (internal or external) as presented in Table1
A complete summary of the average and mean value for the ASV in different countries is presented in Appendix 1. The overall result of all answers was slightly positive. The average value for all answers was 1.95, while 2 equals “Slightly agree”.
The most favorable result score was found in country 3 (1.75) and the least favorable in country 2 (2.21).
In the comparison between internal and external category questions, the responses were slightly more positive about internal ways of working than external, gaining a 0.1 better score (1.87 vs. 1.97). However, there were significant differences between countries; in half of the countries (C1, C2 and C6) internal working procedures got higher score while in C3, C4 and C5 the external procedures got higher values.
The biggest difference in favor of internal working procedures was in C6, where the score was 0.40 units. Also, in C2 the result was 0.32 better in favor of internal working practices.
The lowest scores in the external category were also in C2 (2.34), C6 having the second most unfavorable result (2.18). Therefore, it seems necessary to pay more attention to the co-operation between ASV and OEM in country C2 and C6, and perhaps define and execute an improvement activity.
The internal (I) category is internal ASV assessment and the external (E) category is the assessment of ASV of the mobile terminal (MT) manufacturer. The questions with most favorable scores are listed below. Four out five belong to the internal category.
2. (E) N is a good company to do business with 21. (I) ESD (Electro Static Discharge) issues are well handled in my work place 27. (I) I have enough space to do my repair work 33. (I) In my work place, quality improvement is viewed as long-term commitment 34. (I) I believe that I have enough competencies and skills to ensure the quality of my work Respectively, four out of five questions with the most unfavorable score belong to the external category:
4. (E) I have enough spare parts available at any time needed 8. (E) I get enough training before a new product is introduced to the field 12. (E) From what I hear N service tools are of reasonable price as tools for other products 18. (E) N warranty repair compensation level is competitive 26. (I) I feel I don’t need more knowledge to repair N’s products Looking at the scores per country, question 8 got the most unfavorable result from country C6 (3.35), and question 18 was nearly as low in C2 (3.33). These topics clearly need attention from the OEM Company.

Table 1. Average values per country.
4.2. Correlation
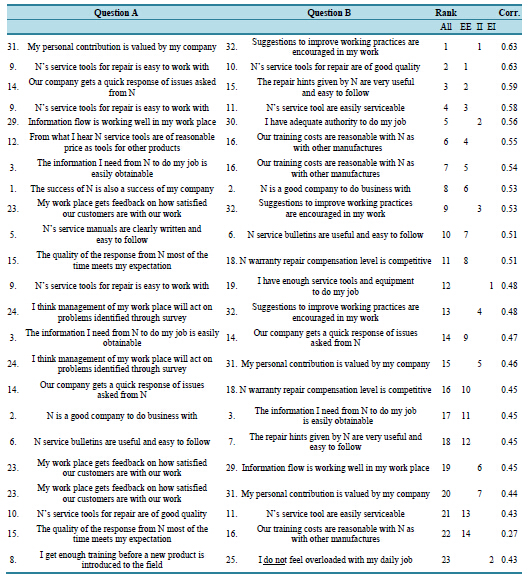
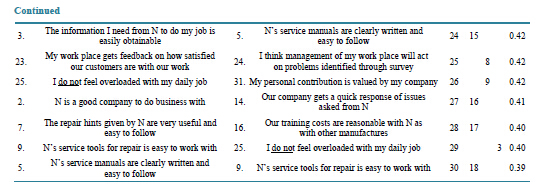
For each question, the correlation with other questions was calculated in order to find the items that have a clear dependency.
The correlation pairs can be divided into 3 subgroups: both results belong to the external category (EE); both belong to the internal category (II) or a pair consisting of one external and one internal category question (EI).
The 30 highest correlation values out of 527 totals are presented in Appendix 2. The Rank listing presents the order number in priority order among all question pairs (All) or in one of the subgroups (EE, II, EI) according to the category of the questions.
From the results it can be seen that the correlation is much higher inside external and internal groups (EE and II categories) than between them (EI). This indicates high consistency in the ASV’s perception about internal and external factors, whether they are positive or negative views.
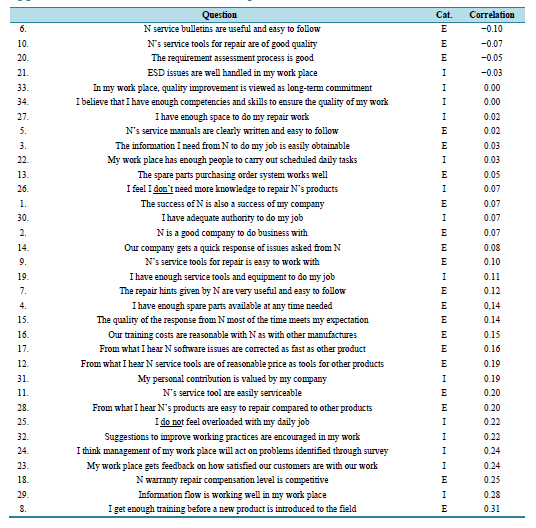
The respondents were sorted to four roughly equally sized groups according to their working experience as seen in Table2 The correlation between work experience and their answers was calculated.
The results are presented in Appendix 3 listed from negative to positive. A negative correlation means that the average result gets smaller value, or the view is more positive when the work experience increases. A positive correlation means the opposite. The experienced repairmen seem to be positive only about a few items compared to novice colleagues. The service bulletins, the quality and the repair assessment process are valued OEM offerings.
On the negative side, questions 8 and 18 again get the most negative score from experienced service persons. This highlights again that these topics need attention.
The average correlation values for external items was 0.10 and for internal 0.12. In general the view about ASV internal topics seems to get slightly more negative over the time.
4.3. Repair Activities in Different Countries
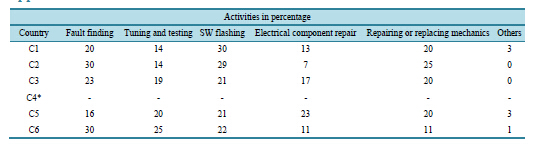
Appendix 5 presents the average repair activities in different countries.
It can be seen from Appendix 5 that the most activity in all countries is software flashing, i.e. on average it constitutes ca. 24.6% for all the ASV in different countries when combined. Software flashing is the updating or upgrading of the phone software. This activity is mainly done when certain components in the MT are changed or replaced. It is also done after tuning the MT components and also when a new software version is provided by the product manufacturer. Fault finding is the second most active activity, and the time spent is ca. 23.8%. Repairing or replacing mechanical or electromechanical parts is 19.2%, and tuning and testing and electrical component repair activity is 18.4%. C1 is most engaged in phone software upgrading or updating, while C2 and C6 spend most of the time in fault finding.
C4 * did not provide its activities in the survey, so the calculation in this particular part does not include this country.
4.4. Provision of Spare Parts to ASVs
Table 3 displays the response to question 12, which asked about “The accuracy of the codes of spare parts provided by the manufacturer through service bulletins”.
It can be summarized from the Table 3 that when all the countries are taken together, the average trust in the accuracy of the spare part code is ca. 90%. The more accurate the spare parts code, the less is the delay for the ASV to get the correct spare parts, implying fewer delays in repairing the phones of the customers.
Table 2. Group working experience.
N = Number of participants.
Table 3. Response by countries of how accurate the spare parts codes provided by the manufacturer were.
5. Summary and Discussion
According to the analysis results tabulated in Appendix 1, the respondents were especially satisfied with the OEM Company as a business partner. The highest 3 scores of ASV satisfaction working with OEM company were: 1) Mutual business success, 2) Good business partnership, 3) Easy usability of the repair tools. The lowest 3 scores of ASV satisfaction were: 1) High response issue resolution time (iRT), 2) Relative low warrant cost compensation, 3) Scarcity of repair spare parts.
According to the analysis results tabulated in Appendix 2, on average, the ASV providers are also more satisfied than unsatisfied about their internal practices. Comparing internal working practices and development across countries, the satisfaction was at the same level or slightly higher, depending on the country. The ASVsevaluating their internal organization gave the following 3 items the highest score: 1) Enough authority to do their jobs, 2) Enough competencies and skills ensuring quality work, 3) Quality improvement as a long-term commitment, 4) Enough space to do the repair work, 5) ESD issues handled well. The 5 lowest scored items among the ASVs were: 1) Information flow not working well, 2) Missing feedback about their work performance from end customers, 3) Feel overloaded with daily work, 4) Feel needs more knowledge for product repair, and 5) Poor internal managerial feed regarding survey results.
The working group experience was divided into 5 groups (see Table 2). According to the results tabulated in this table, it shows that the more experienced repairman on average seems to be satisfied only with a few items compared to a fresh colleague. Service bulletins, the quality and the repair assessment process are valued OEM offerings. On the negative side, questions 8 and 18 received the most negative score from experienced service persons. This highlights that these topics need attention.
The average correlation values for external items was 0.10 and for internal 0.12. In general the view about ASV internal topics seems to get slightly more negative over time.
6. Conclusions
This article has tried to identify the strong and weak activities between ASVs as a service provider to the end customers and MT product manufacturer providers. A seamless relationship between equipment manufacturer and the mobile terminals repair service done by the authorized service vendors (ASV) is essential for both sides to prosper in this business. Success for one party equals success for the other party; a win-win situation is created. When an ASV supplies good services to end-users, this contributes to an increase in customer satisfaction rating, loyalty and leads to retention. In this study it was found on average that the ASVs are more satisfied than unsatisfied with the MT manufacturer support. The internal working practice of the ASV organization was perceived as more positive than negative. The more experienced persons, on average, seem to be satisfied with fewer items compared to less experience service colleagues. Opportunities for improvement found in this work will be shared with managerial shareholders for corrective and preventive measures and actions. From the OEM side, the response iRT and training before product launch are items that should be focused on in the first place, as these affect customer satisfaction directly and indirectly. The ASV management should seek a way to share the end user customer feedback with the ASV teams, and internal information communication should also be improved.
In future, if a questionnaire survey is done in the future on the basis of a specific time period, i.e., longitudinal, a panel data analysis could be considered as a future candidate method for analyzing the data. Structural equation modeling (SEM) could be used in future to extract in detail the underlying meaning from a set of indicator variables.
Authors’ Contributions
This work is collaboration between the two authors. Author AM, as an expert on the authorized service vendor’s process, designed the study, collected the data through an interview survey, compiled the descriptive statistics and composed the article. JS, compiled the inference statistics jointly with AM. The authors contributed equally by reviewing the entire study for quality and contribution to knowledge. Both authors read and approved this manuscript.
References
- Koufteros, X.A., Cheng, T.C.E. and Lai, K.H. (2007) Black-Box and Gray-Box Supplier Integration in Product Development: Antecedents Consequences and Moderating Role of Firm Size. Journal of Operations Management, 25, 847-870. http://dx.doi.org/10.1016/j.jom.2006.10.009
- Lee, H. (2000) Creating Value through Supply Chain Integration. Supply Chain Management Review, 4, 30-36.
- Wang, L. and Kess, P. (2006) Partnering Motives and Partner Selection: Case Studies of Finnish Distributor Relationships in China. International Journal of Physical Distribution & Logistics Management, 36, 466-478.http://dx.doi.org/10.1108/09600030610677410
- Heskett, L., Jones, T.O., Loveman, G.W., Sasser, W.E. and Schlesinger, L. (1994) Putting the Service-Profit Chain to Work. Harvard Business Review.
- Kasper, H. and Lemmink, J. (1989) After Sales Service Quality: Views between Industrial Customers and Service Managers. Industrial Marketing Management, 18, 199-208. http://dx.doi.org/10.1016/0019-8501(89)90036-9
- Larsson, R. and Bowen, D.E. (1989) Organization and Customer: Managing Design and Coordination of Service. Academy of Management Review, 14, 213-233.
- Danaher, P.J. and Mattsson, J. (1998) A Comparison of Service Delivery Process of Different Complexity. International Journal of Service Industry Management, 9, 48-88. http://dx.doi.org/10.1108/09564239810199941
- Koskela, H. (2002) Customer Satisfaction and Loyalty in after Sales Service: Modes of Care in Telecommunications Systems Delivery. PhD Dissertation, HUT Industrial Management and Work and Organizational Psychology Report No. 21.
- Mwegerano, A.M. (2014) Managing Customer Issues through a Support Channel Network. Doctorate Thesis due for Publication.
Abbreviations
ASV: Authorized Service Vendor C: Country iCA: issue Corrective Actions iRT: issue Resolution Time MT: Mobile Terminal RSC: Regional Service Center BGA: Ball Grid Array E: External I: Internal
Appendix 1. Results by Country
Appendix 2. Correlation
Appendix 3. Correlation with Work Experience in the ASV
Appendix 4. Definition of the Authorized Service Vendors’ Level
Appendix 5. AVS Activities in Different Countries