Positioning
Vol.2 No.2(2011), Article ID:5053,19 pages DOI:10.4236/pos.2011.22009
Development of 3-D Gravity-Magnetic Models of the Earth’s Crust of Azerbaijan and Adjacent Areas: an Overview
![]()
1Dept. of Geophysics and Planetary Sciences, Raymond and Beverly Sackler Faculty of Exact Sciences, Tel Aviv University, Ramat Aviv 69978, Tel Aviv, Israel; 2Dept. of Geological and Environmental Sciences, Ben-Gurion University of the Negev, Be’er-Sheva, P. O. Box 653, Israel
Email: levap@post.tau.ac.il
Received April 28th, 2011; revised May 10th, 2011; accepted May 15th, 2011.
Keywords: 3d Gravity-Magnetic Modeling, Deep Structure, Caucasus, Economic Minerals
ABSTRACT
Azerbaijan is located in the Alpine Himalayan collisional zone and is characterized by its complex and variable geological structure. To study Azerbaijan’s deep structure, twelve main regional interpreting profiles were selected for comprehensive 3D combined gravity-magnetic modeling. The development of the initial physical-geological models (PGMs) was based on known surface geology, drilling data, previous seismic, magnetotelluric and thermal data analysis, examination of the richest petrophysical data, as well as quantitative and qualitative gravity/magnetic data examination. The PGMs thus reflect the key structural-formational specifics of Azerbaijan’s geological structure, beginning from the subsurface (hundreds of meters) up to the Moho discontinuity (40 - 60 km). The PGMs revealed common factors controlling oreand hydrocarbon bearing formations, primarily the boundaries of tectonic blocks, masked faults, and buried uplifts of magmatic rocks. Many of these factors can be used to investigate long-term geodynamic activity at a depth. The article summarizes many years of investigation by exemplifying the most typical PGMs for the Greater and Lesser Caucasus, the Kura depression, and central and northern Azerbaijan.
1. Introduction
Investigating the South Caspian basin to localize commercial oil-and-gas deposits is of great interest to geoscientists [e.g., 1-6]. At the same time, Azerbaijan is known to be rich in economic minerals. Besides oil and gas there are iron, copper, gold, mercury, zinc, molybdenum, cobalt, aluminum and other deposits [7]. Rich geological-geophysical data (including physical properties) are available and have been analyzed in numerous gravity-magnetic surveys at different scales with different structural-geological implications for Azerbaijan. The first models of the Earth’s crust of Azerbaijan were put forward in the mid-1960s [8-11]. These models were subsequently evaluated in the works of Tzimelzon [12], Azizbekov et al. [13], Shikhalibeyli [14], Khesin [15], Gugunava [16], Alexeyev et al. [17], and later by Khesin et al. [18,19]. Some recent works have studied the deep structure of the Caucasus and Azerbaijan and have revealed the important generalized regional peculiarities of this region [e.g., 20-27]. This overview presents a detailed evaluation of the variable deep structure of Azerbaijan primarily by using 3D combined gravity-magnetic data analysis. This study was preceded by a complex qualitative and advanced quantitative gravity/magnetic data analysis supported by detailed examination of available geological, seismic, magnetotelluric and thermal data, and utilization of numerous magnetic, paleomagnetic and density properties of geological samples from Azerbaijan. This series of physical-geological models (PGMs) can be used not only for substantiation of various types of prospective economic deposits, but also to delineate the tectonic-structural factors affecting long-term seismological prognosis.
2. Azerbaijan: a Brief Geological Outline
The complexity of Azerbaijan’s geological structure stems from its location in the Alpine Himalayan collisional zone. The NE part of Azerbaijan is part of the Pre-Caucasian foreland filled by Cenozoic terrigenous sediments. A heterogenic Nakhichevan folding system is located in the SW part, where carbonate Paleozoic strata and Cenozoic magmatic formations are mixed (Figure 1). At the mega-anticlinorium of the Greater Caucasus, stratified Cenozoic and Mesozoic thick (predominantly, sedimentary) strata are present. The prevalence of Mesozoic magmatic formations is typical of the megaanticlinorium of the Lesser Caucasus. The Kura megasynclinorium, dividing the Greater and Lesser Caucasus, is characterized by an accumulation of thick (up to several kilometers) Cenozoic terrigenous sediments. The Talysh anticlinorium is located on the SE flank of the Kura depression, where Paleogene magmatic associations are widely distributed [28-29].
According to Khain [29], the most ancient PreBaikalian1 structural complex is characterized by a sub-meridian strike. A less metamorphosed Baikalian complex is rumpled to latitudinal folds in separate areas. The Caledonian complex is practically unknown. The Hercynian complex is characterized by a Caucasian strike identical to the overlying Mesozoic rocks.
The Alpine tectono-magmatic cycle is characterized by more complete geological data. As a whole, the Azerbaijan territory is typical of frequently changing geological associations on the vertical and lateral axes,

Figure 1. Areal map of main profiles used for physical-geological modeling in Azerbaijan and adjacent regions of the East Caucasus. (1) profiles and pickets; (2) Pg3-Q: (a) orogenic magmatic associations, (b) background sedimentary deposits; (3) K2-Pg2: (a) pre-orogenic magmatic associations, (b) background sedimentary deposits; (4) J3-K1: (a) magmatic associations of the Late Alpine sub-stage, (b) background sedimentary deposits; (5) J1-J2: (a) magmatic associations of the early alpine sub-stage, (b) background sedimentary deposits; (6) Pz deposits; (7) contour of the guton magnetic anomaly; (8) tectonical regions: I – Nakhichevan folding region, II – SE part of the Lesser Caucasus mega-anticlinorium, III – central and SE parts of the Kura mega-synclinorium, IV – SE part of the Greater Caucasus mega-anticlinorium, V – Talysh anticlinorium.
the presence of multifarious fold and fault structures of different orders, and regional and local metamorphism. All these factors make the development of reliable models of these media highly complex.
3. Creation of Space Indicators and Petrophysical Basis for Modeling
Gravity-magnetic data processing is generally intended to reduce and eliminate noise factors of different origins and intensities. The main problem faced by qualitative interpretation is to single out a desired target, whereas quantitative interpretation needs to determine and refine the target parameters. Thus, geological problems need to be resolved in terms of: (1) the capabilities of the geophysical method selected for measurements of the field containing the information required, (2) the properties of the medium under study, its capability to generate detectable signals (anomalies), (3) the methods for data processing and interpretation; namely, their ability to extract information from the field revealing the effects of the geological objects. Figure 2 presents a general flow chart for analysis and synthesis of geophysical data for complex regions. Each step in this flow chart is divided into sub-steps [19].
The complex geological structure of Azerbaijan determines the highly intricate nature of the gravity and magnetic fields, which reflect the superimposed effects of outcropped bodies and structures and those buried at various depths. Therefore to identify anomalies in the different classes of geological sources, not only observed geophysical fields need to be used but also their transformations. Such a classification can be carried out by the use of spatial features (regional and local anomalies), morphological features (isometric anomalies, elongated anomalies or ledges), or the sign and intensity of geophysical fields.
To study the gravity anomalies in Azerbaijan, the results of Bouguer gravity analytical continuation to levels of 4, 8 and 20 km were examined. on the basis of these transformations, difference DgB(0-4), DgB(4-10) and DgB(8-20) maps were computed. It was found that the residual field DgB(0-4) in orogens reflects the influence of the near-surface Alpine structures composed of volcanogenic and volcanogenic-sedimentary associations and intrusions; in the Kura depression this field reflects the distribution of dense heterogeneities in the upper part of the
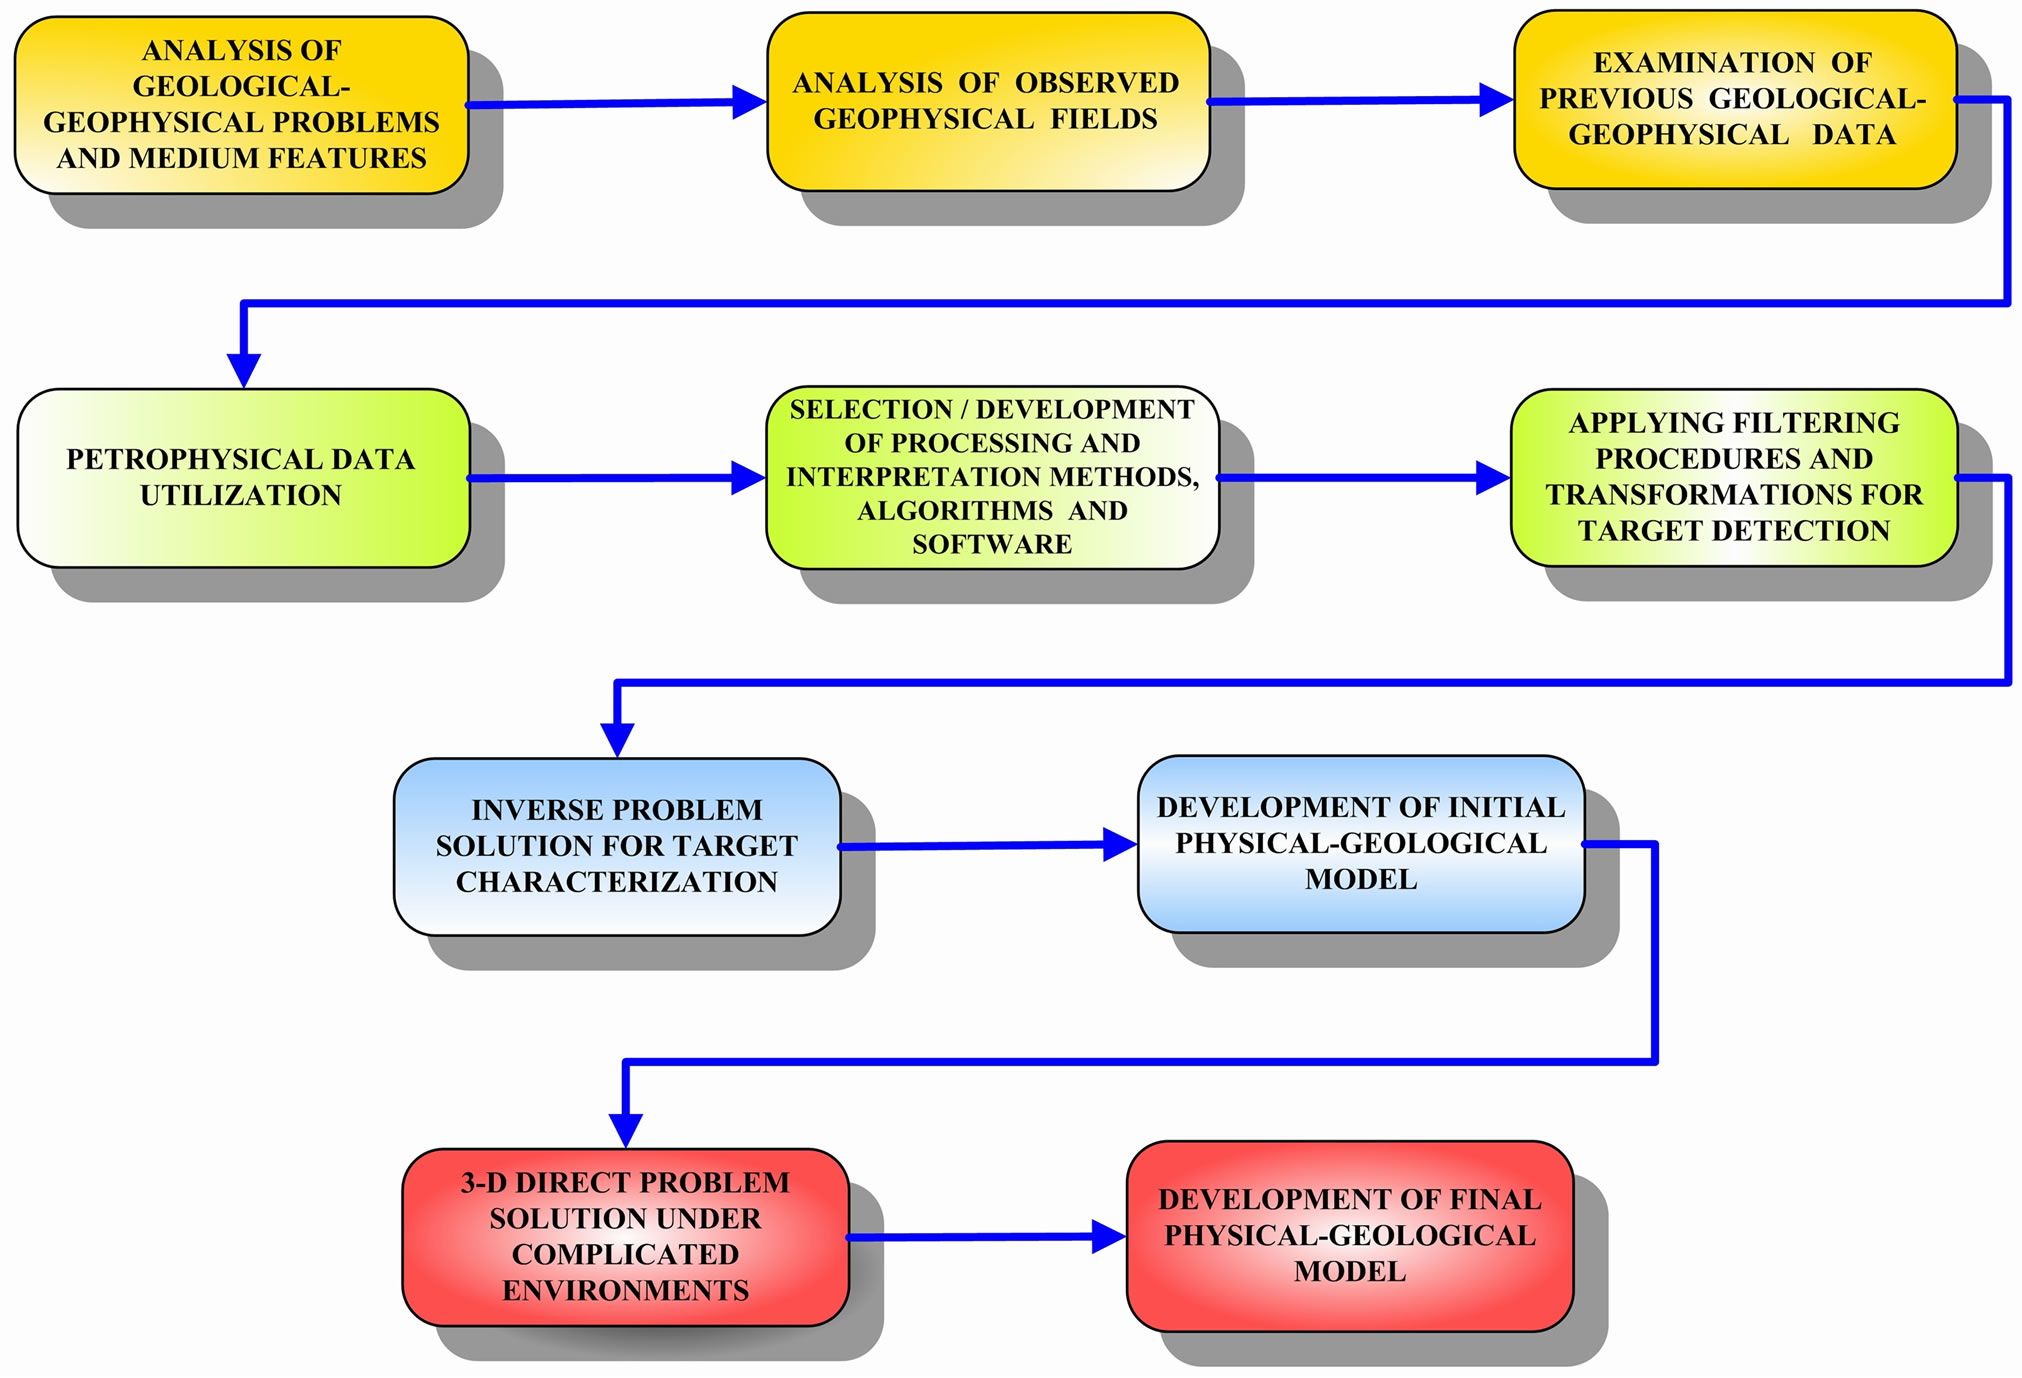
Figure 2. Interpretation of geophysical fields under complex environments: A general scheme.
sedimentary cover. The difference field DgB(8-20) in orogens primarily reflects the influence of the structure and composition of the metamorphic basement (Baikalian folded foundation) and deep parts of some intrusions; in the Kura depression it mainly reflects the influence of the Mesozoic complexes. The pattern of the difference field DgB(4-10) is close to DgB(8-20), but is more differentiated.
To examine the regional magnetic anomalies the following magnetic data were used: field DT (in the Middle Kura Depression – field Za) at the levels of 6 and 10 km, and a field of DT (Za) horizontal gradient at the level of 2 km. Attempts to reveal local magnetic anomalies as a residual field of DT(0-6) or DT(0-10) were unsuccessful because of sharp differentiation of the observed magnetic field in the Lesser Caucasus and in some other areas.
The potential field characterization procedure was based on the richest data from petrophysical studies (more than 80 000 determinations of magnetic susceptibility and more than 25 000 determinations of density) conducted in different areas of Azerbaijan [17]. Some average density values were obtained from seismic velocities using the known relationship [e.g., 30]. A study of magnetic and palaeomagnetic characteristics, which are vectors and substantially more variable parameters, was mainly based on direct measurements of rock samples.
4. Greater Caucasus
The geomagnetic section of the Greater Caucasus mega-anticlinorium is characterized on the whole by low values of magnetic susceptibility (![]() = 80×10−6 SI), which sharply increase for volcanogenic and volcanogenic-sedimentary associations (Figure 3). Here three petromagnetic floors were defined: (1) the Pliocene-
= 80×10−6 SI), which sharply increase for volcanogenic and volcanogenic-sedimentary associations (Figure 3). Here three petromagnetic floors were defined: (1) the Pliocene-
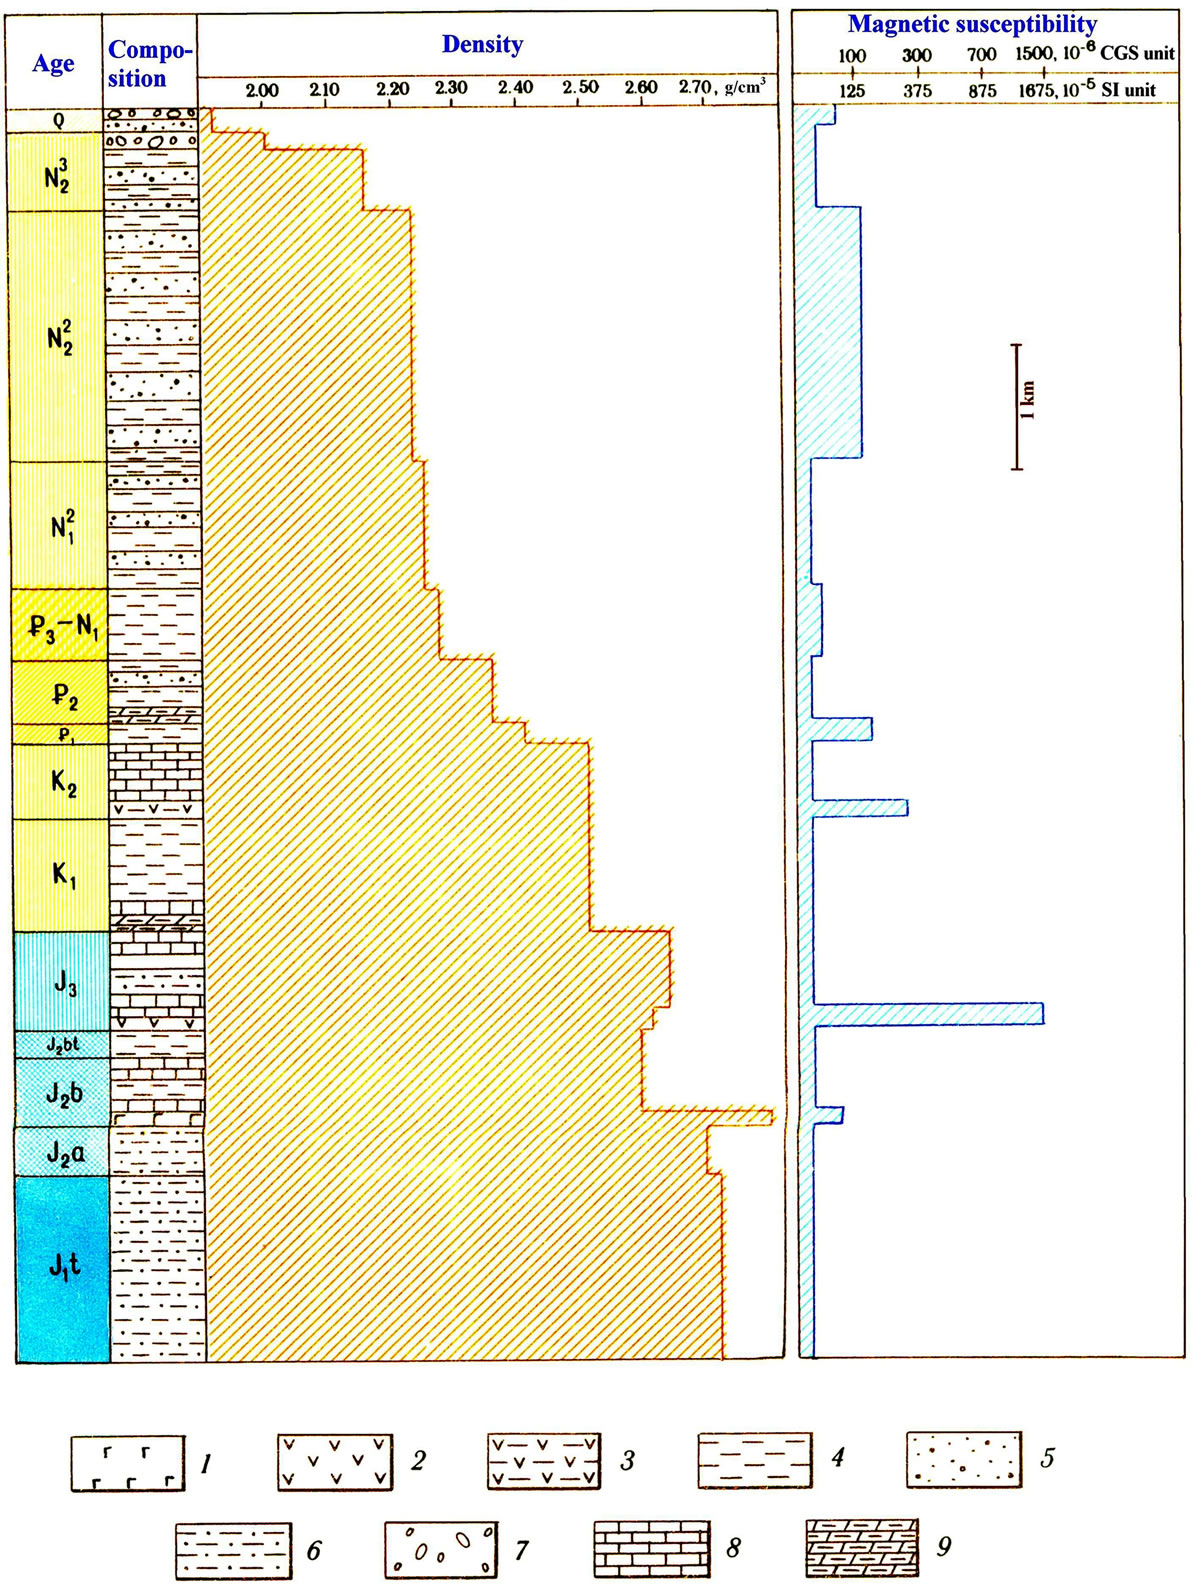
Figure 3. Generalized petrophysical column for the Greater Caucasus mega-anticlinorium.(1) basalts, andesito-basalts and diabases; (2) andesites; (3) volcanogenic-sedimentary rocks; (4) clays; (5) sands; (6) sandy-clay deposits; (7) coarse gravels and conglomerates; (8) limestone and dolomite; (9) marl.
Quaternary (coarse molassa) with ![]() = 100×10-6 SI, (2) the Eocene-Miocene (thin molassa) with
= 100×10-6 SI, (2) the Eocene-Miocene (thin molassa) with ![]() = 100 ×10−6 SI, and (3) the Jurassic-Cretaceous with
= 100 ×10−6 SI, and (3) the Jurassic-Cretaceous with ![]() = 30×10−6 SI.
= 30×10−6 SI.
In the density section, four floors could be identified (Figure 3): (1) the Quaternary ( = 1.95 g/cm3), (2) the Paleogene-Neogene (
 = 2.23 g/cm3), the Bajocian-Upper Jurassic (
 = 2.62 g/cm3), and the Lower Jurassic ((
 = 2.72 g/cm3).
5. Lesser Caucasus
The petromagnetic section is characterized by high differentiation: magnetic and strongly magnetic rocks predominate here (Figure 4). In this region six floors were distinguished: (1) the Eocene-Quaternary (![]() = 700×10−6 SI), (2) the Upper Jurassic – Paleocene (
= 700×10−6 SI), (2) the Upper Jurassic – Paleocene (![]() = 100×10−6 SI), (3) the Upper Cretaceous (
= 100×10−6 SI), (3) the Upper Cretaceous (![]() = 700×10−6 SI), (4) the Upper Jurassic – Lower Cretaceous (
= 700×10−6 SI), (4) the Upper Jurassic – Lower Cretaceous (![]() = 250×10−6 SI), (5) the Middle Jurassic (
= 250×10−6 SI), (5) the Middle Jurassic (![]() = 600×10−6 SI), and (6) the Paleozoic – Lower Jurassic (
= 600×10−6 SI), and (6) the Paleozoic – Lower Jurassic (![]() = 100×10−6 SI).
= 100×10−6 SI).
The petrodensity section has a weak differentiation that complicates singling out accurate density boundaries (Figure 4). Three density floors were integrally selected: (1) the Quaternary (molassa and river deposits) with  = 2.00 g/cm3, (2) the Upper Bajocian – Neogene (
 = 2.57 g/cm3), and (3) the Pre-Cambrian – Lower Bajocian (
 = 2.65 g/cm3).
6. The Kura Depression
Three petromagnetic floors were found: (1) the Pliocene-Quaternary (![]() =300·10−6 SI), the Eocene-Miocene
=300·10−6 SI), the Eocene-Miocene
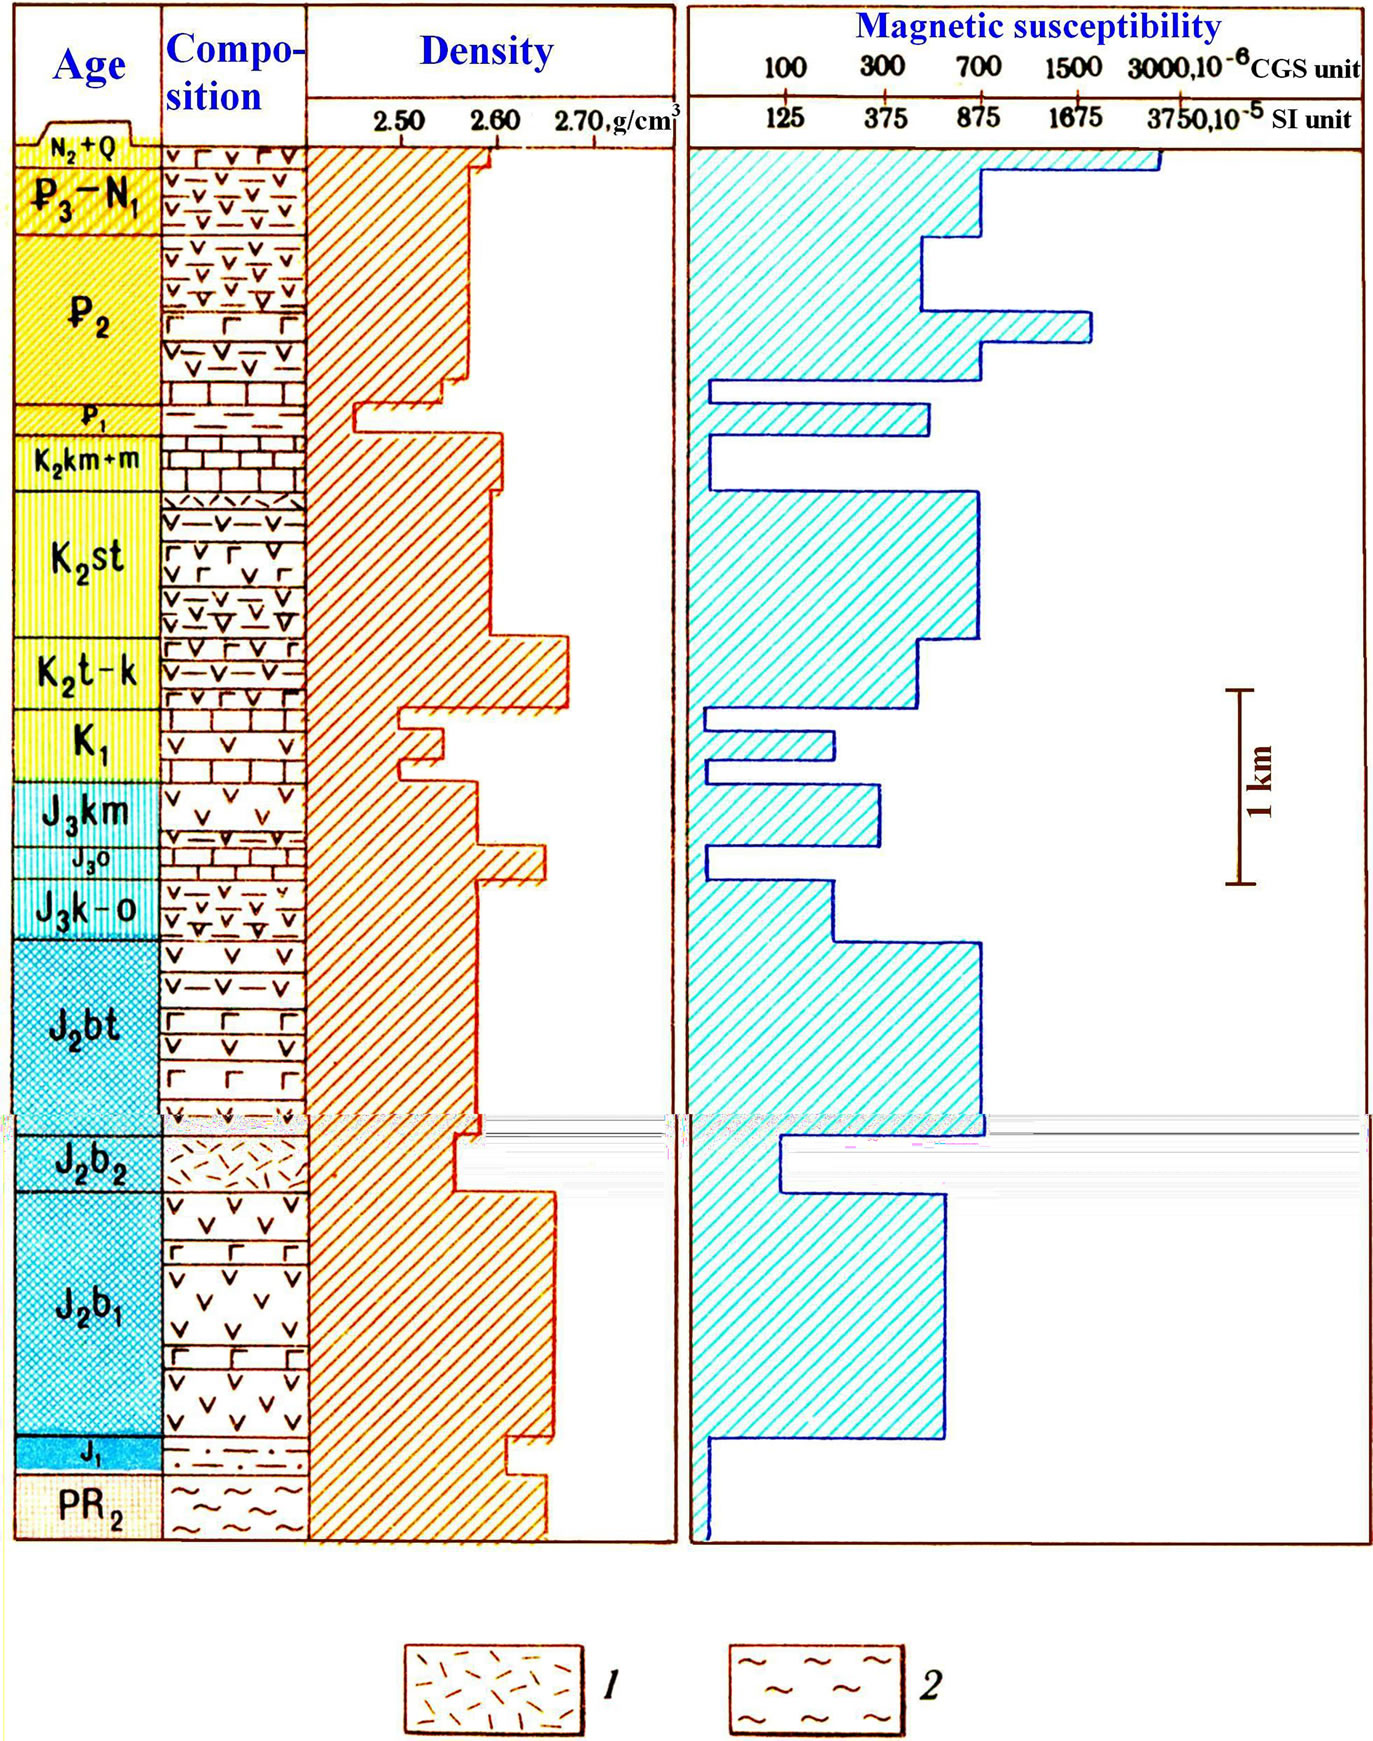
Figure 4. Generalized petrophysical column for the Lesser Caucasus mega-anticlinorium. (1) liparites and plagioliparites; (2) metamorphized schists (other symbols are the same as in Figure 3).
(![]() = 100·10−6 SI), and the Cretaceous (volcanogenic and volcanogenic-sedimentary associations) with
= 100·10−6 SI), and the Cretaceous (volcanogenic and volcanogenic-sedimentary associations) with![]() = 1500·10−6 SI.
= 1500·10−6 SI.
Low-density deposits compose most of the section of the Kura depression; only the Jurassic-Cretaceous associations discovered in the lower part of the section relate to the middle-density associations. The three petrodensity floors have the following characteristics: (1) the Quaternary ( = 2.00 g/cm3), (2) the Paleogene – Neogene (
 = 2.18 g/cm3), and (3) the Jurassic – Cretaceous (
 = 2.62 g/cm3).
7. Talysh Mountains
Two petromagnetic floors were found in the Talysh anticlinorium: the Eocene-Neogene (![]() = 300×10−6 SI), and (2) the Paleocene - Middle Eocene (
= 300×10−6 SI), and (2) the Paleocene - Middle Eocene (![]() = 700×10−6 SI). In the second floor, inverse high-magnetized zones were identified.
= 700×10−6 SI). In the second floor, inverse high-magnetized zones were identified.
The density values range considerably: (1) Pliocene ( = 2.00 g/cm3), (2) Oligocene-Miocene (
 = 2.25 g/cm3), (3) Eocene (
 = 2.53 g/cm3), and (4) Paleocene (
 = 2.45 g/cm3).
8. Common Characteristics of The Petrophysical Boundaries and Geological Associations
The specificity shared by all these sequences is the availability of two geostructures petrodensity boundaries typical of all (Figure 5): (I) between the Quaternary (sometimes Neogene-Quaternary) deposits and underlying more dense associations (Dsaver = 0.2 - 0.3 g/cm3), and (II) a boundary between the Cenozoic and Mesozoic
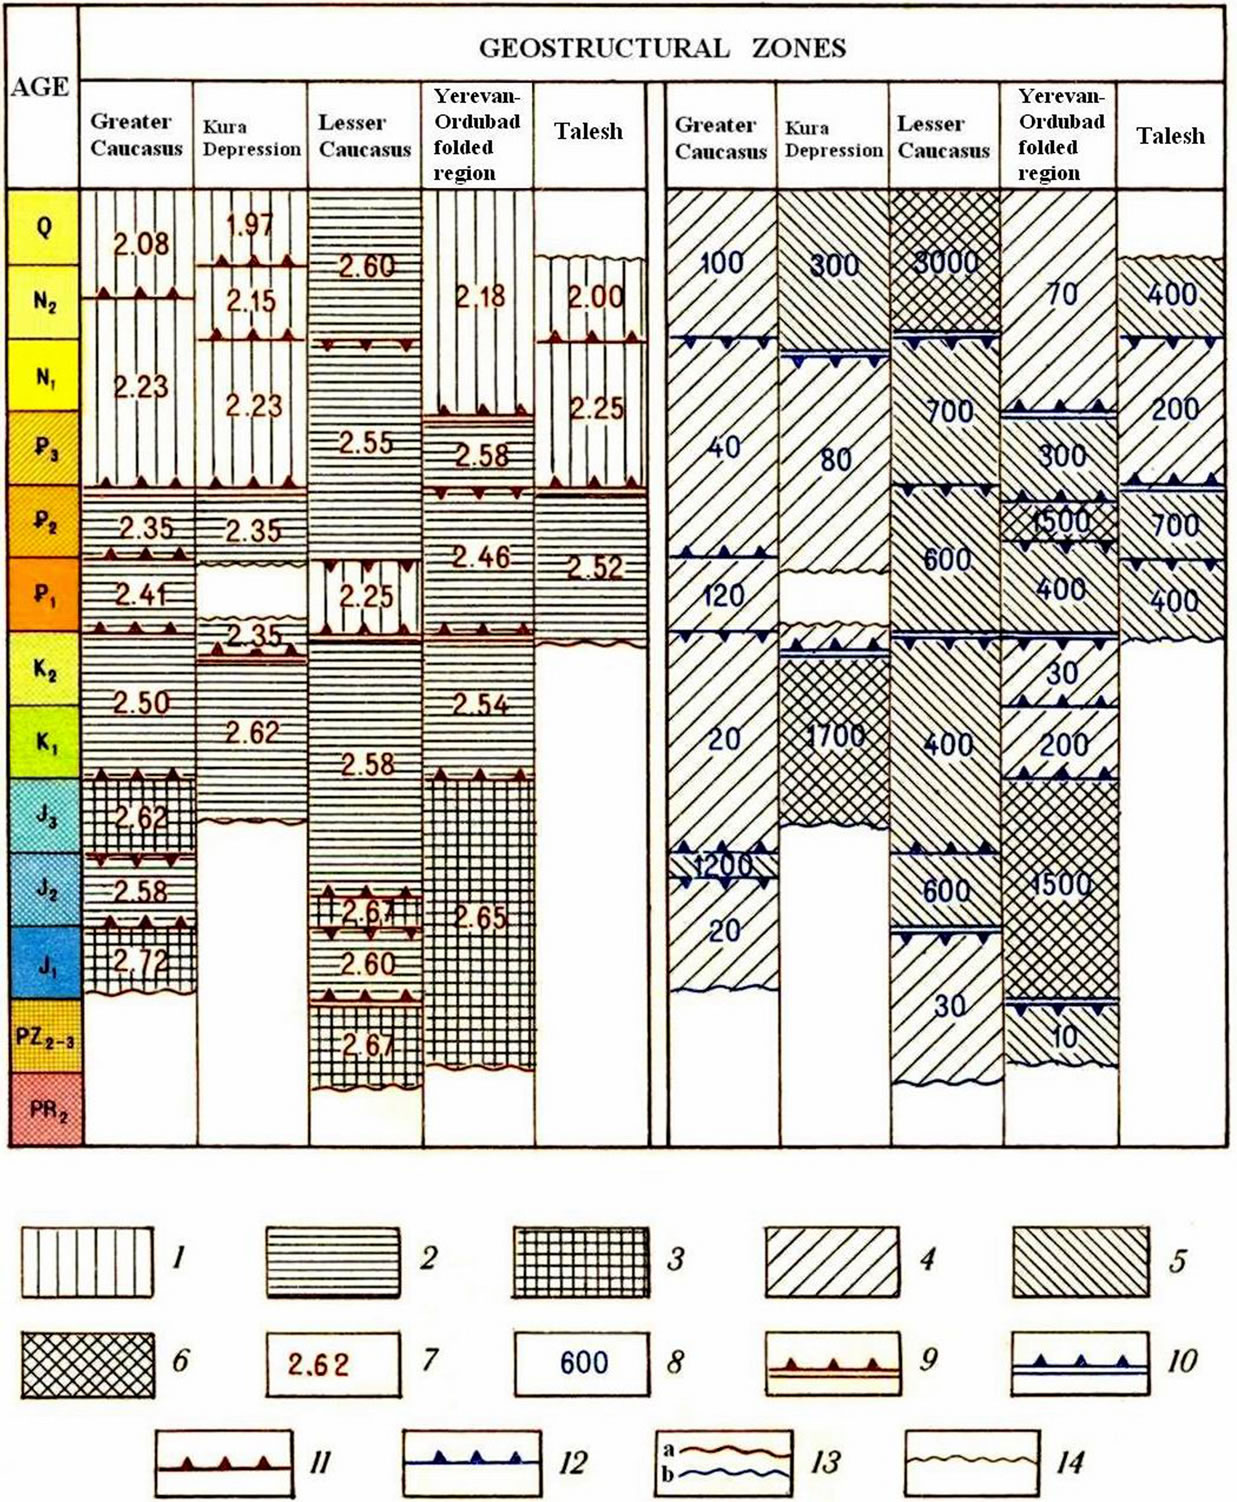
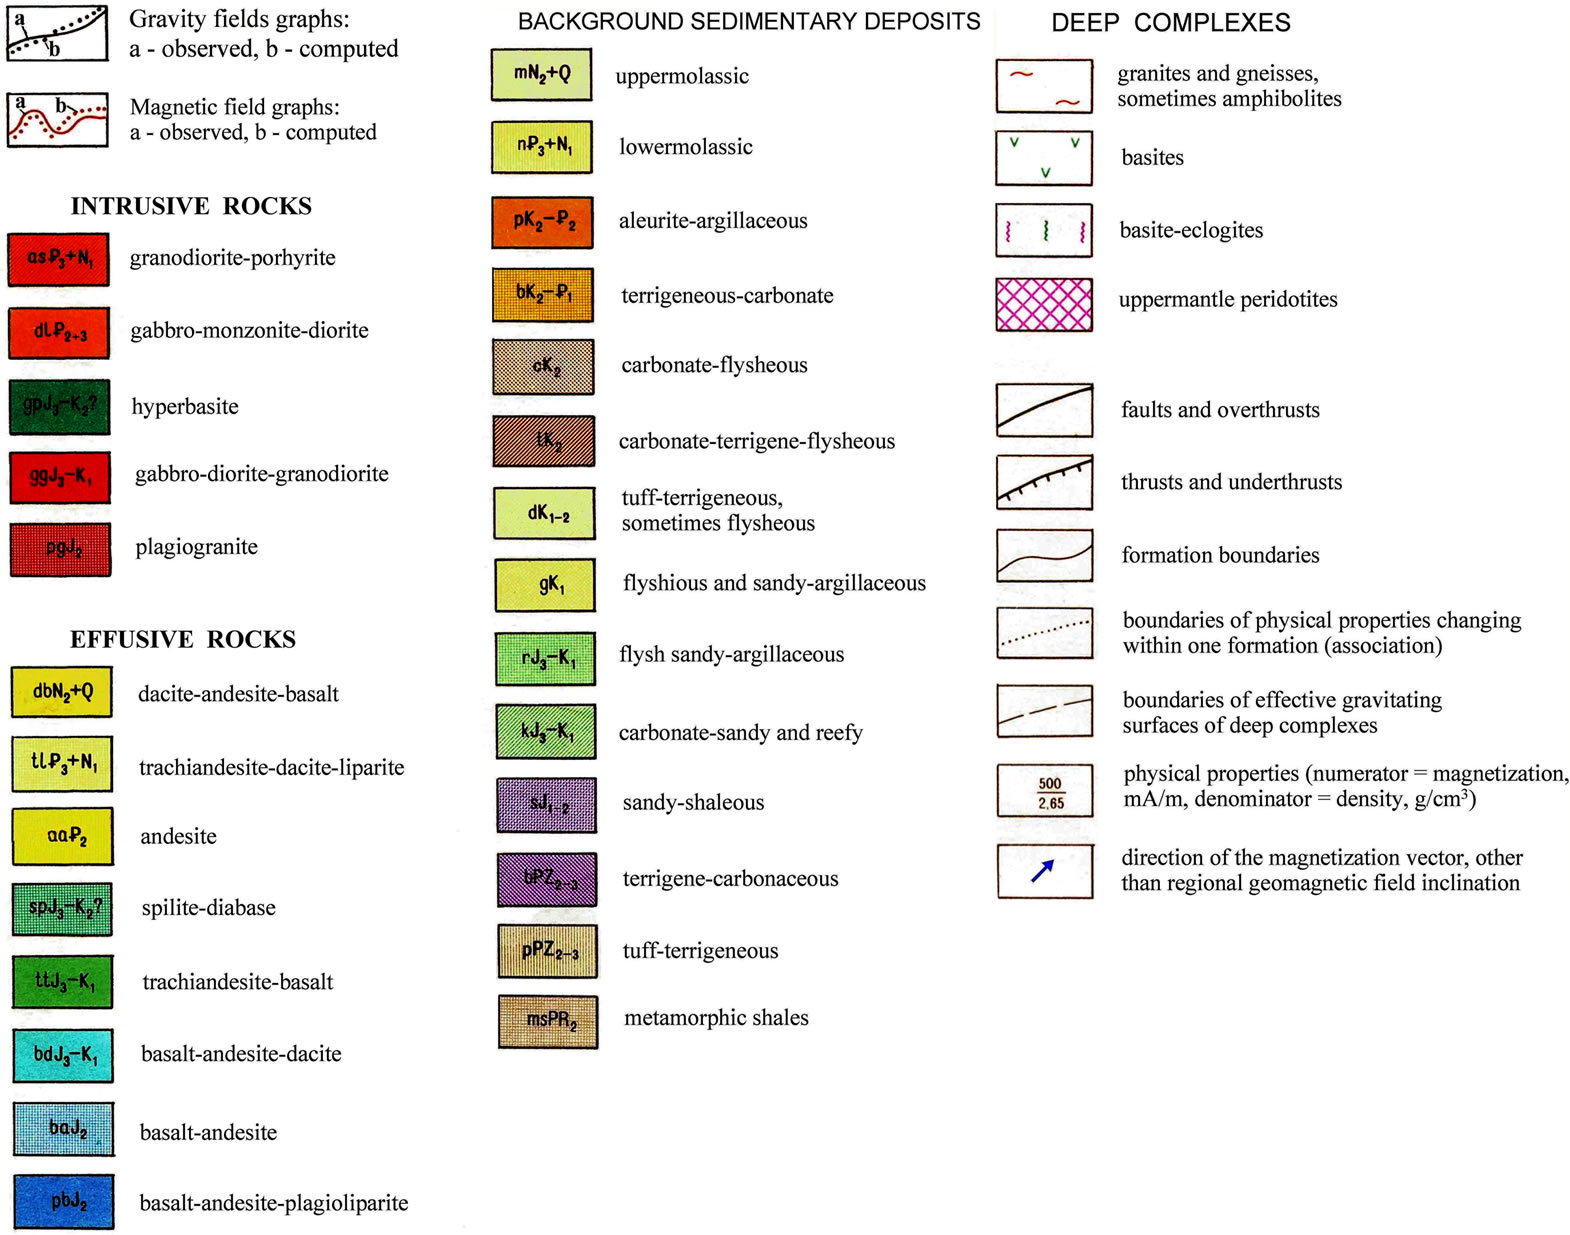
Figure 5. Depiction of petrophysical floors. Intervals of average density values, g/cm3: (1) 1.95-2.30; (2) 2.31-2.60; (3) 2.61-2.90, intervals of average magnetic susceptibility values, 10-6 CGS; (4) 0-250; (5) 251-700; (6) >700; (7) average value of density, g/cm3; (8) average value of magnetic susceptibility, 10-6 CGS, clearer petrophysical boundaries; (9) density; (10) geomagnetic, fuzzier petrophysical boundaries; (11) density; (12) geomagnetic; (13) lower boundary of density (a) and magnetization (b) investigation; (14) boundary of petrophysically unknown section. Note. The arrows in (9)-(12) are oriented in the direction of decreasing density or magnetization.
associations (the contrast Dsaver consists of 0.14 - 0.44 g/cm3). However, in the latter, the boundary is not differentiated clearly in the sequence of the Lesser Caucasus: Dsaver reaches only 0.05 g/cm3. Here the reference horizon of lower density and magnetization are liparites and plagio-liparites of the Upper Bajocian.
As a whole, the densest rocks are typical of intrusive bodies. The density of intrusive rocks of the Early Alpine sub-stage ranges approximately from 2.80 to 2.95 g/cm3(excluding Bajocian plagiogranites with a density of 2.50 - 2.60 g/cm3). The density of the Late Alpine intrusives ranges on average from 2.70 to 2.85 g/cm3; the density of pre-orogenic intrusives exhibits a clear tendency to decrease to the class of intermediate density (saver = 2.65 - 2.75 g/cm3). The intrusives of the orogenic sub-stage have the lowest density (saver = 2.55 - 2.60 g/cm3).
The rocks composing effusive associations mainly belong to the class of increased (saver = 2.70 - 2.85 g/cm3) and intermediate (saver = 2.50 - 2.70 g/cm3) density. This increased density is typical basically of effusive rocks of the Early Alpine sub-stage. The density of the later sub-stages decreases gradually, and rocks of the orogenic sub-stage almost completely belong to the class of low density (saver = 2.45 - 2.60 g/cm3).
Among the sedimentary deposits, the sandy-shales of the Greater Caucasus, as well as carbonates of the Late Jurassic-Early Cretaceous are the densest (saver = 2.60 - 2.75 g/cm3). The tendency for density to decrease from the early to late stages is also found here. The main petrodensity discontinuities show similar peculiarities in the central and western regions of the Caucasus, namely in Armenia [31] and Georgia [32].
As a first approximation, the geomagnetic sequence can be divided into three floors corresponding to the main tectonic stages. The lower floor (Pre-Jurassic), represented mainly by terrigeneous-carbonate formations penetrated by acid intrusions, is practically non-magnetic. Some exclusions can be found in the volcanogenic associations revealed in the Shamkhor anticlinorium of the Lesser Caucasus. The middle floor (Mesozoic-Eocene), within which thick volcanites of basic and intermediate composition have developed, is differentiated by its increased magnetization. The upper floor (Post-Eocene) represented mainly by the terrigeneous deposits of the sedimentary cover is characterized by a lower magnetization (although in some areas Neogene-Quaternary lavas with high magnetization are known).
In the intermediate floor volcanogenic associations of the Middle Jurassic have the highest average magnetic susceptibility – in the Lesser Caucasus they are approximately 4 km thick. The remanent magnetization of these rocks may be parallel or antiparallel to the induced magnetization; relatively low-magnetic associations are usually typical of the zones of inverse magnetization.
The Cenozoic volcanogenic associations of the Talysh as well as lava covering the central part of the Lesser Caucasus have other characteristics. Here paleomagnetic zones of different polarities alternate. Analyses indicate that upward continued magnetic anomalies (associated with the gently sloping Cenozoic associations) are rapidly attenuated. The lavas are characterized by significant magnetization values compared to pyroclastic associations of a similar composition. The magnetization of ultrabasites is approximately proportional to their degree of serpentinization (at the same time the density of the ultrabasites decreases as a function of their serpentinization).
By analyzing the sequence of the main Caucasian petrodensity and petromagnetic floors (Figure 5), it can be concluded that these floors are correlated in terms of age, but the average values of their physical characteristics and relations differ. Obviously, this is caused by the different history of geological evolution of these geostructures. Nevertheless, these physical parameters served as the basis for creating 3D physical-geological models (PGMs) of the Earth’s crust for the 3D combined gravity-magnetic modeling presented below.
9. Advanced Inverse Problem Solution for Magnetic and Gravity Anomalies
To conduct a quantitative interpretation of magnetic and gravity anomalies, advanced methods have specially been developed for complex environments [19] including oblique magnetization (inclined magnetization is typical of the regions located in tropical and temperate latitudes; in Azerbaijan the normal value of magnetic inclination is about 58˚), rugged topography (or uneven surface of measurements) and an unknown level of the normal field. These methods (modified versions of the characteristic point method, tangent method and method of characteristic areas) have been tested in numerous models (with an accuracy of 1 - 3%) and in real situations (with an accuracy of 3 - 20% for magnetic anomalies and 5 - 25% – for gravity anomalies).
One example of such an interpretation is the Guton magnetic anomaly situated in NW Azerbaijan, near the border with Russia (Figure 6). Examination of this anomaly was conducted along fifteen profiles crossing this anomaly. The results along one of these profiles (an anomalous body was approximated by a model of a thick inclined bed) are presented in Figure 7 [33]. The data indicate that the anomalous body is characterized by comparatively low magnetization (250 mA/m), large vertical thickness (about 30 km) and a steep dip in the lateral contacts (detailed methodology supporting this interpretation can be found in Khesin et al. [19]). The

Figure 6. Guton anomaly: map of the total magnetic field DT (isolines are given in mA/m) and location of profile A – B. location of this area is shown in Figure 1.
abovementioned characteristics point to the basic-acid composition of the anomalous body (intrusion). The conclusion as to the significant vertical thickness of this body concurs with the geothermic data for the depth of the Curie discontinuity in this area (about 30 km) [34]. The upper edge of this intrusion is at a depth of 2.6 km (from the Earth’s surface) in its middle part and at depths of 1.5 and 3 km in its northern and southern parts, respectively. This magmatic intrusion is associated with the rich pyrite-polymetallic deposits of the BelokanZakataly ore area [35] and possibly other areas in the Greater Caucasus [17].
10. Development of Physical-Geological Models
The development of 3-D PGM was performed in three
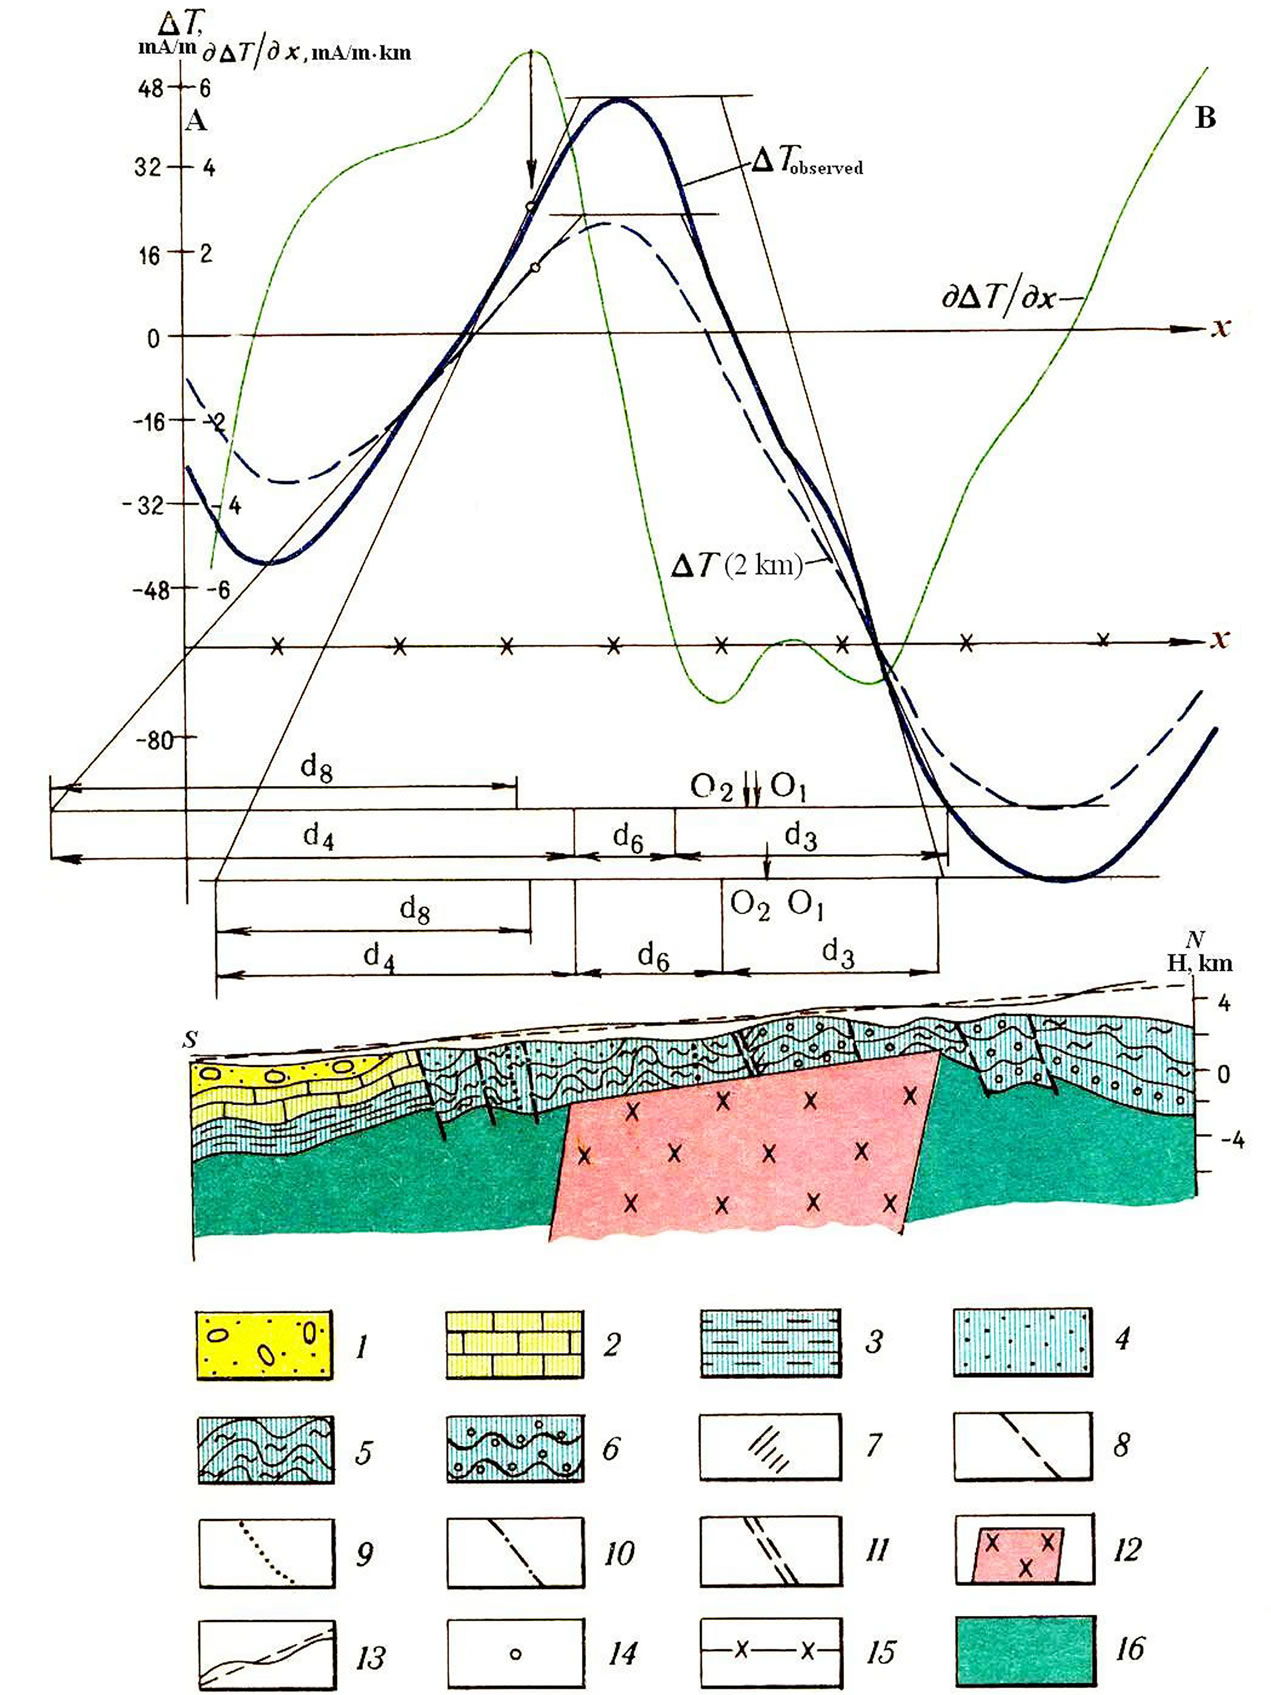
Figure 7. Example of tangent plotting and results of interpretation of DT graphs on two levels along the profile A – B through the Guton anomaly (southern slope of the Greater Caucasus). (1) recent alluvial sediments; (2) limestones, tuff sandstones, clayey shales (K); (3) mudstones, tuff sandstones (J3); (4) monolith clayey shales and coarse-grained tuff sandstones (J2); (5) sandy-clayey shales with horizons of sand flysh, metamorphosed clayey shales and sandstones (J2); (6) phyllitizated clayey shales, sandstones, spilites (J1); (7) dikes and sheet bodies of the gabbro-diabasic association (J2); (8) regional upthrust-overthrusts; (9) upthrust-overthrusts separating the longitudinal tectonic steps of the second order; (10) upthrust-overthrusts complicating the longitudinal tectonic steps; (11) transverse faults; (12) magmatic intrusion of intermediate-acid composition according to the results (in non-segmented J1-2 complex); (13) the lines of flight and averaged inclined straight line; (14) inflection point of the plot DT nearest to the maximum on the left; (15) corrected zero line of the plots DT, O1, O2 are locations of the beginning of coordinates (middle of the anomalous body’s upper edge) obtained from xun.r and xun.l, respectively; (16) J1-2 complex.
basic steps:
The first step is as follows:
(A) A geological Section is constructed where all the intrusive, effusive and other associations, as well as faults and the surface of folded foundation are compiled on the basis of geological data within a strip 15 - 20 km wide. The interpreting Section is located in the middle of this strip.
Such a Section characterizes the upper portion of the Earth’s crust, which is 2 - 3 to 5 - 8 km in thickness from the Earth’s surface to the Baikalian basement. Deeper parts of the intrusive bodies and certain faults are formed by extrapolation of the available constructions, general geological considerations and the results of previous geophysical analyses.
(B) A preliminary petrophysical model of the Section is developed. Here all the geological bodies acquire density and magnetization values according to the preceding petrophysical data and results of geophysical field interpretations. When no data are available on the magnetization direction, it is assumed to be parallel to the normal geomagnetic field. Further, the magnetization direction is refined in the course of physical-geological modeling. The petrophysical model includes deep-seated layers of the Earth’s crust: (1) the “basaltic”, (2) the intermediate between the crust and the upper mantle, and (3) the upper mantle. Their surfaces are constructed and physical properties are associated with them according to the data from previous seismic, magnetotelluric and other deep geophysical studies.
(C) The initial (preliminary) petrophysical model includes hidden bodies as well. Their location, thickness, depth, density and magnetization are obtained from a quantitative analysis of magnetic and gravity anomalies as well as seismic data.
The second step selects the gravity and magnetic fields along the interpreting profiles using the Geological Space Field Computing (GSFC) program [19,35]. Each time the fields are from different bodies, groups of bodies and the total computed model are displayed and compared to the observed gravity and magnetic fields. Using the results of this comparison, the changes that match the gravity and magnetic effects are introduced into the model of the medium. Computations, comparisons of fields and model modifications are repeated until the desired fit between the computed and observed fields is obtained.
Then, a regional gravity (and sometimes magnetic) field is roughly selected. As a rule, the densities of deep-seated complexes are not changed; the modi-fications only affect the shape of their roof. Next, fields of local bodies are selected. If necessary, this is followed by a verification of the regional field and the field of the local bodies.
At each computational step, a separate analysis of gravity and magnetic fields is carried out. Coordinated variations are verified in the subsequent steps, and then introduced into the model. This procedure leads to an integrated quantitative interpretation for anomalous gravity and magnetic fields. The selection ends when the computed gravity and magnetic fields coincide accurately with the observed fields.
The third step involves a detailed geological interpretation of these models. A 3-D PGM of the area under investigation is developed based on the qualitative and quantitative data. This yields the final geological maps, and the models are characterized by a more complete rendering of the geological targets, mineral controls and mineral deposits, including deep-seated ones.
The geological interpretation of the complexes and local bodies of the selected (final) petrophysical model does not usually present any difficulties, since in the implementation of the interactive selection system almost all the bodies in the model acquire some specific geological content. The geological nature of new sources introduced into the model during the selection and reflected either in the initial geological section, or in the initial PGM, is determined according to the similarity of their physical properties, dimensions, and depth of occurrence with respect to the known targets. The age of the bodies is determined according to their interrelations with the host rocks.
11. Key Examples of 3-D Modeling
11.1. 3-D Integrated Gravity-Magnetic Models Along Profiles Crossing the Lesser Caucasus
Profiles 1 and 2 crossing the Lesser Caucasus (Figures 8 and 9) illustrate the very complex geological structure of this region. The Late-Alpine effusives in these PGMs compose an ophiolite zone (which is a relic of the ocean crust). It is thought that the same rocks occur in the NE immersion of the Lesser Caucasus. Pre-orogenic and orogenic intrusive and effusive rocks are fixed in the southern parts of these PGMs. Thick sedimentary deposits are found in northern parts of these profiles. A smooth high of the Moho discontinuity is observed from south to north from a depth of 52 - 54 km up to 42 km. Classes of disturbing objects were revealed here such as acid intrusions of lower density and magnetization, basic magmatic rocks of increased density and magnetization and fault zones. It was determined that the clearest density boundaries were associated with the base of the Cenozoic sedimentary strata and to a lesser degree with the base of the Alpine complexes. According to the modeling, geomagnetic boundaries were associated mainly with the roof and bottom of the Mesozoic floor of heightened magnetization.
In the southern part of profile 2, a zone of strong decompaction is observed in the root parts of the Dalidag intrusive at depths from 4 to 17 km, and by a horizontal thickness of 30 km. This rock decompaction zone produces the greatest Kelbadzhar-Dalidag gravity minimum. This large “granite room” apparently was a source of pre-orogenic and orogenic granitoid magmatism.
11.2. 3-D Integrated Gravity-Magnetic Model Along the Profile Across the Greater Caucasus
Three profiles (No. 4, 5 and 6) were studied across the Greater Caucasus mega-anticlinorium. Profile 6, presented in Figure 10, points to the sharp increase in the
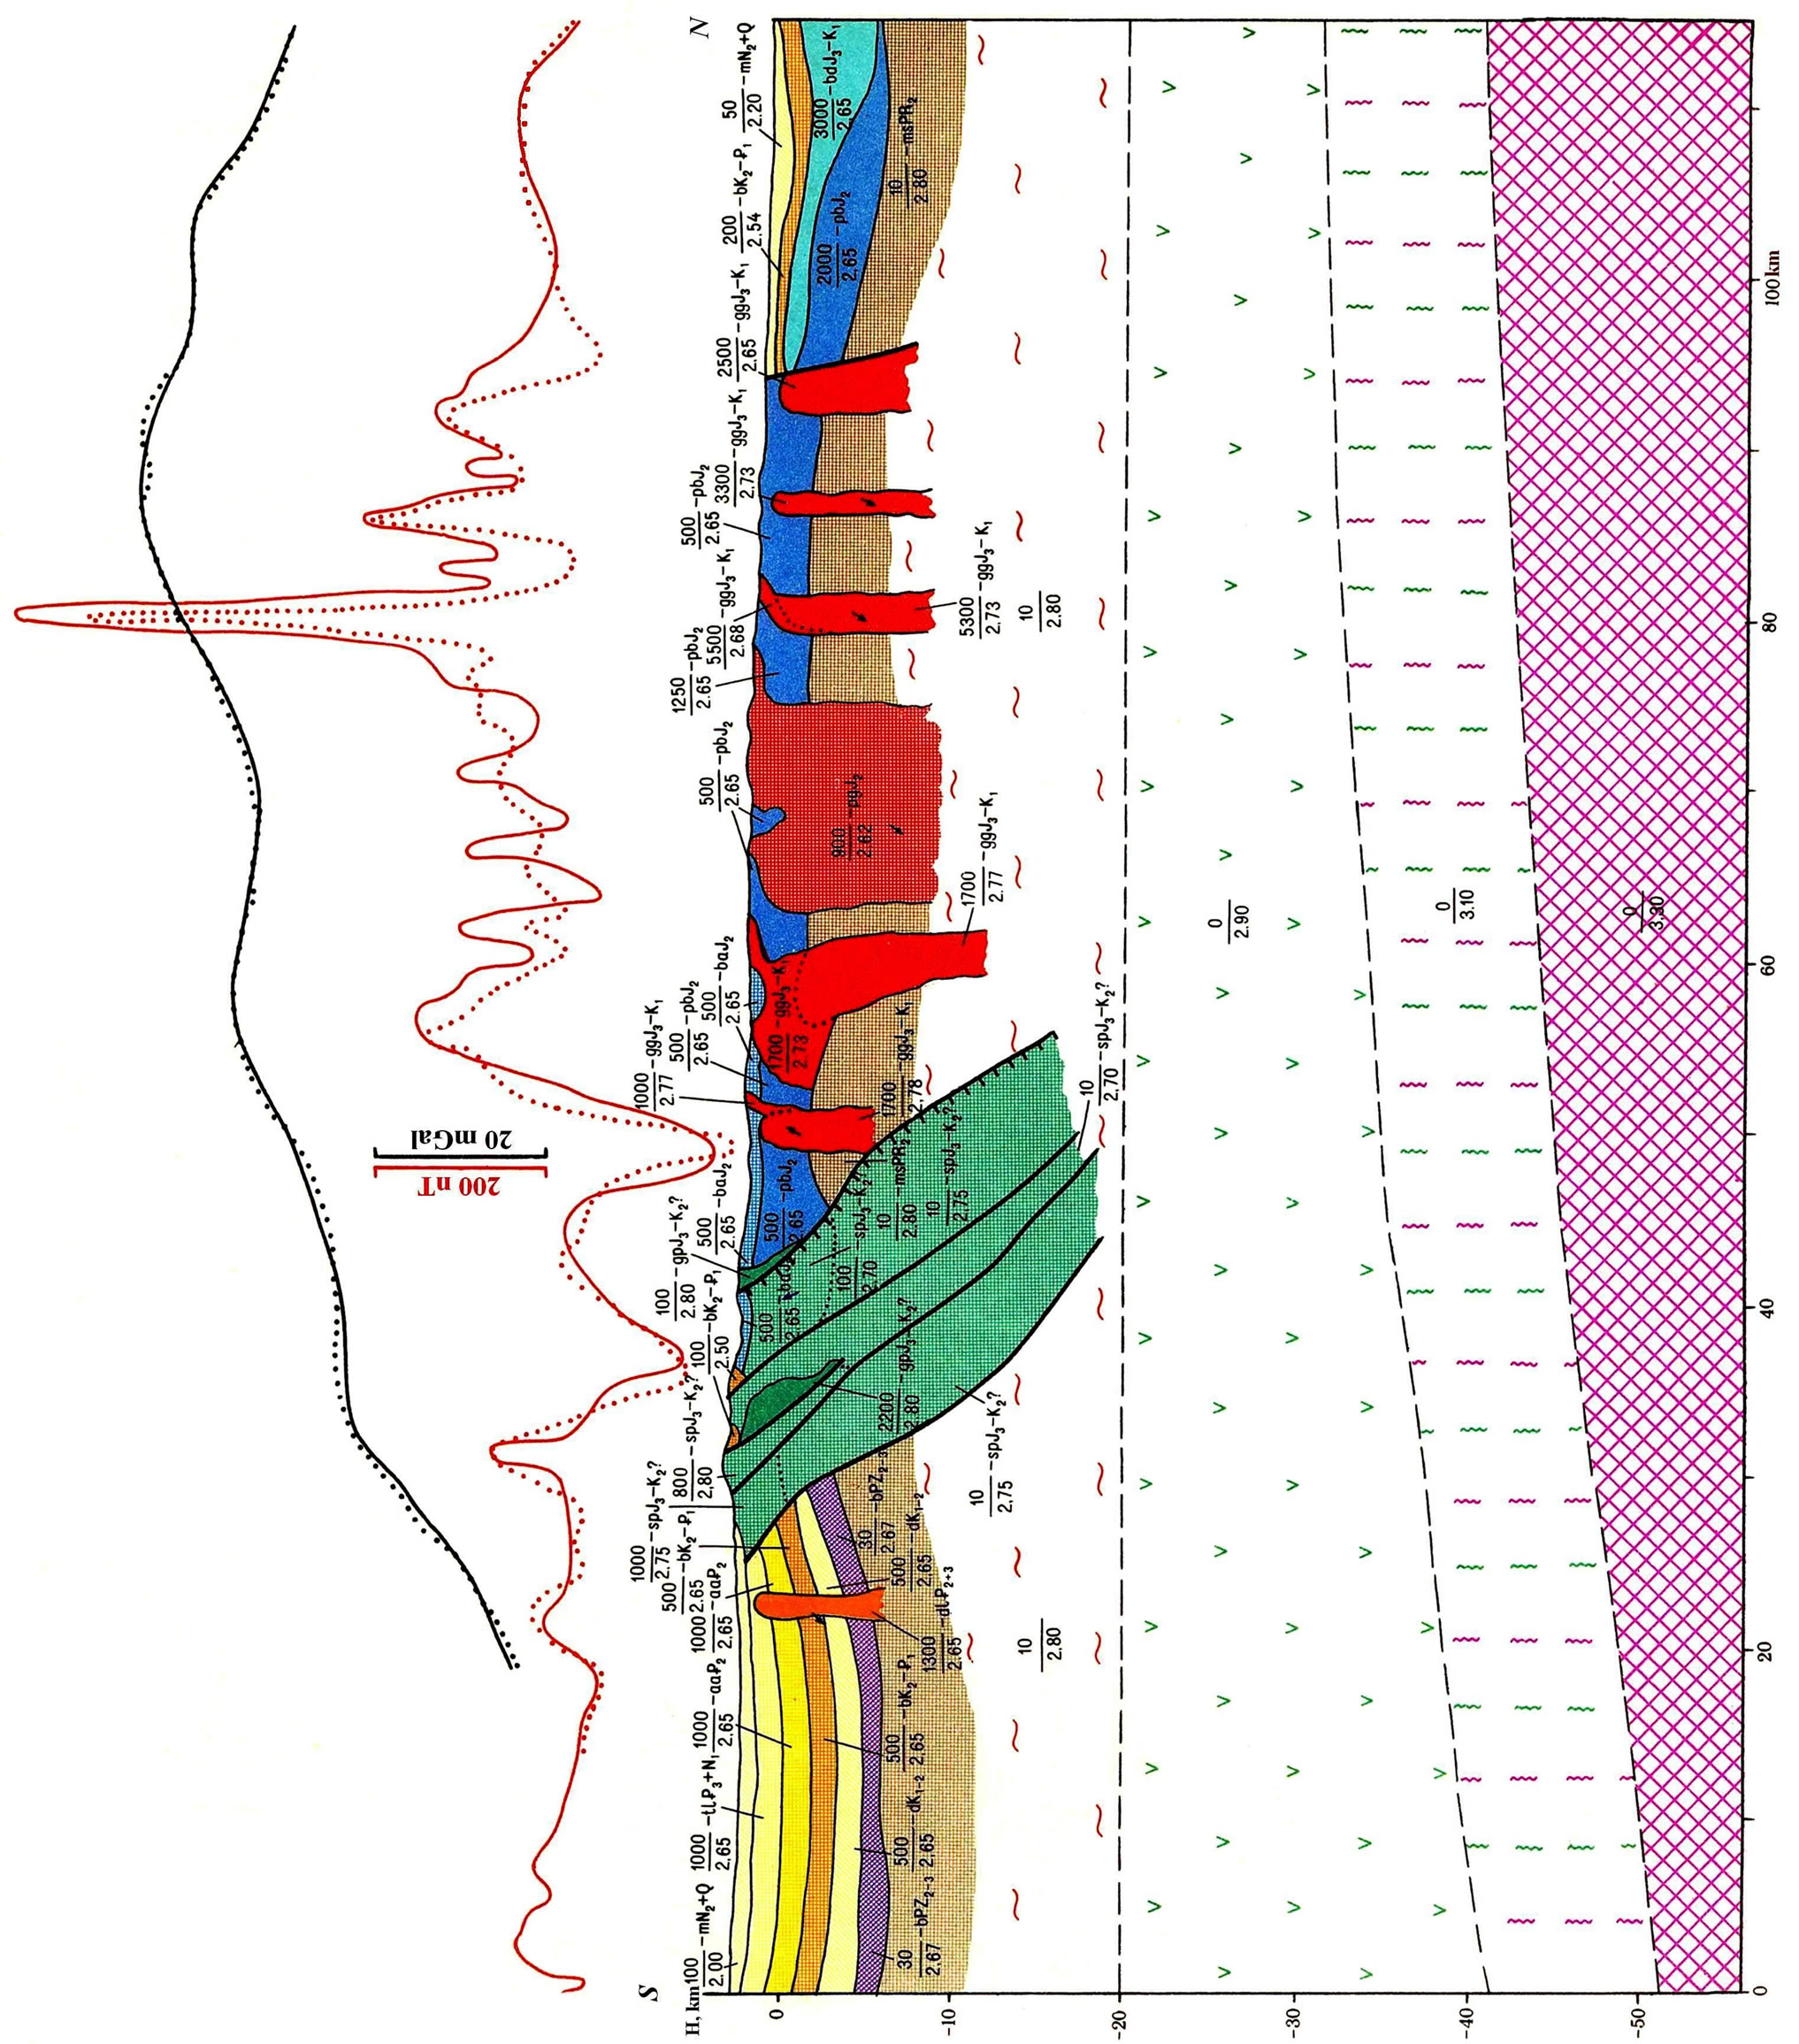
Figure 8. Physical-geological model along profile 1: Mez-Mazra – Kedabek - Dzegam-Djirdakhan (location of the profile is shown in Figure 1).

Figure 9. Physical-geological model along profile 2: Karagel - Dashkesan - Chinarly (location of the profile is shown in Figure 1).

Figure 10. Physical-geological model along profile 6: Central Azerbaijan - Southern Dagestan (Russia) (location of the profile is shown in Figure 1).
depth of the Moho discontinuity from the south to the middle part of this profile (from 47 to 60 km). The behavior of the gravity field depends primarily on the Moho depth.
In this PGM the Early-Alpine cores of the Greater Caucasus are clearly linked to the development of Jurassic associations present in the Lower-Middle-Jurassic sandy-shale deposits. A surface of the Pre-Alpine foundation occupies the highest position in this core. In the PGM (the Greater Caucasus) their wide distribution was predicted given the results of 3D combined gravitymagnetic modeling of the Early-Alpine LowerMiddle-Jurassic sandy-shale deposits of the Greater Caucasus (occupying this position as a result of overthrust), as well as the sedimentary cover of the Kura Depression. In the northern parts of this profile, rocks of significant magnetization were identified at a depth of 9 - 10 km. These rocks are presumably related to tuff-terrigeneous deposits of the Middle-Late-Paleozoic age.
11.3. 3-D Integrated Gravity-Magnetic Model Along the Lesser Caucasus – Kura Depression – Foothills of the Greater Caucasus Profile
Figure 11 presents results of 3D combined interactive modeling of gravity and magnetic fields along stakes 700 – 1350 of profiles 3-4 (see Figure 1). A distinct peculiarity of this profile is that it crosses three significant regions of Azerbaijan: the Lesser Caucasus, the Middle Kura Depression and abuts on a sub-mountain zone of the Greater Caucasus. As can be seen in Figure 11, the magnetic field pattern is more complex in the southern (Lesser Caucasian) part of this profile. The gravity field behavior has a generally negative correlation with the depth of the Moho discontinuity; this can be accounted for by the predominant gravity effect of eclogites at depths of 9 - 20 km.
11.4. Combined PGM of the Saatly Super-Deep Borehole Area (Central Azerbaijan)
For many years the prevailing view was that in the Kura depression separating mega-anticlinoria of the Greater and the Lesser Caucasus, thick sedimentary deposits occur in the crystalline Pre-Alpine basement, and subvertical deep faults divide these structures. On a projection of the buried uplift of the basement to the Earth’s surface, which is assumed to exist on the basis of high densities and velocities of elastic waves, the Saatly Super-Deep borehole (SD-1) was drilled in 1965. However, analysis of the magnetic properties of rocks and magnetic survey results showed that the basement was not magnetized, and the Mesozoic magmatic associations of basic and intermediate composition (of high magnetization) occupied most of the geological section in the Middle Kura

Figure 11. Physical-geological model along pickets 700-1350 of profiles 3 - 4 (Lesser Caucasus – Kura depression – foothills of the Greater Caucasus). Location of these profiles is shown in Figure 1. (1) intrusive gabbro-diorite-granodioritic association, (2-5) effusive associations; (2) liparite-basaltic; (3) basalt-andesite-dacitic; (4) basalt-andesitic; (5) basalt-andesiteplagioliparitic; (6-11) background sedimentary deposits: (6) upper molassic; (7) lower molassic; (8) terrigenous; (9) terrigenous-carbonaceous; in some places flyschoid; (10) carbonaceous-sandy, reef rocks; (11) metamorphic schists and other metamorphic rocks; (12-15) deep-seated complexes: (12) granites and gneisses; in some places amphibolites; (13) basic rocks; (14) basic rocks – eclogites; (15) upper-mantle peridotites; (16) faults, upthrusts; (17) crush zones; (18) boundaries of physical properties changing within the same association; (19) physical properties (numerator is magnetization, mA/m, denominator is density, g/cm3); (20) direction of the magnetization vector differs from the geomagnetic field inclination.
depression [15]. The abovementioned (mainly Jurassic) associations are widely distributed in the NE part of the Lesser Caucasus. These associations have a deep-seated gently sloping underthrust under a thick sand-shale series of the Greater Caucasus Jurassic.
The validity of this interpretation was confirmed by the results of SD-1 drilling: the borehole exposed Mesozoic volcanogenic rocks at a depth of 3.6 km and did not come from the rocks at its bottom at 8.2 km [17]. Advanced interpretation methods (improved modifications of tangents, characteristic point methods and areal method) were applied to study gravity and magnetic anomalies along all profiles surrounding SD-1. A fragment of this interpretation along profile 18 is shown in Figure 12. First of all, note that the behavior of the magnetic DZ curve and graph 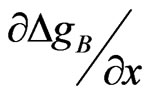 are very simularwhich testifies to the fact that these anomalies are due to the same geological objects. A quantitative analysis of the magnetic curve showed two magnetic targets. The main target apparently is a source of the Talysh-Vandam gravity anomaly (its upper edge coincides with the data obtained by SD-1 drilling).
An integrated PGM (gravity-magnetic-seismic with elements of thermal field analysis) of the Earth’s crust along profile No. 9 is shown in Figure 13. This PGM clearly accounts for the main sources of gravity and magnetic anomalies in this area.
The analysis indicates that the area of the TalyshVandam gravity maximum (TVGM) has a highly inhomogeneous geological structure. Separate elements of the TVGM – anomalies of the second order – reflect differently, showing that they originated independently in different areas of the Earth’s crust. Taking into account the location of the lower edge of the magnetized masses and similarities between this geological section and the Lesser Caucasian, it was presumed that magmatic rocks should be found down to 10 km in depth (comparable to the Lower Bajocian rocks of the Lesser Caucasus).
Obviously, the main source of the TVGM is associated with the underlying highly dense, strongly metamorphosized (initially chiefly sedimentary associations) nonmagnetic or low-magnetic Pre-Baikalian floor (this type of floor has a submeridional strike in Russian and African platforms [29,36]). The depth of the upper edge of these highly dense rocks was estimated at 9.5 km.
Thus, SD-1 has yet to discover (it is unlikely that these drilling operations will be pursued in the coming years) the source of the TVGM, but clarified the origin of the Gandja magnetic maximum. This is crucial not only for analysis of the tectonic-magmatic evolution of the Caucasus region, but also for prospecting of its oreand oil and gasbearing deposits. For example, the geomag-

Figure 12. Fragment of gravity and magnetic field analysis along profile 18 (location of this profile is shown in Figure 1. (1) Bouguer gravity field DgB; (2) magnetic field DZ; (3) first horizontal derivative of gravity field ; (4) contour of magnetized body and position of magnetization vector; (5) contour of body determined by analysis of
 .
.

Figure 13. Deep geological section of the earth’s crust in SD-1 area along profile 9 (location of this profile is shown in Figure 1). A: gravity and magnetic fields observed and computed for model B; B: petrophysical model, C: geological model. Observed fields: (1) DgB; (2) DZ, fields computed by model B; (3) DgB; (4) DZ; (5) boundaries of the velocity and the density heterogeneities and their indices; (6) diffraction points; (7) body number (numerator) and density value, g/cm3 (denominator); (8) geological bodies with the magnetization of 2,500 mA/m (a) and 2,800 mA/m (b); (9) projection of the Curie surface constructed on the basis of geothermal data analysis; (10) sub-vertical boundaries obtained by the use of magnetic (a) and gravity (b) field modeling; (11) Cenozoic; (12) Mesozoic; (13) G complex (velocity analogue of the “granitic” layer); (14) Bu and Bl subcomplexes of B complex (complex B is the “basaltic” layer velocity analogue); (15) B1 complex (presumed basite and eclogite composition); (16) M complex (presumed peridotite composition); (17) Cenozoic complex: mainly terrigenous deposits, Mesozoic complex; (18) terrigenous-carbonaceous formations; (19) mainly effusive associations of basic and intermediate composition; (20) mainly Baikalian complex (Pt2-Pz): metamorphic (primarily terrigenous) associations (the presence of younger deposits is possible in the upper part); (21) Pre-Baikalian complex (Ar2-Pr1): mainly gneisses and marbles; (22) ancient complex (Ar1): gneisses and amphibolites; (23) root of the basic magmatism; (24) undivided effusive-intrusive complex; (25) rock complex of a low density (serpentinization zone ?); (26) complex of associations corresponding to the crust-mantle transition; (27) upper mantle roof position, (28) large fault zones.
netic models makes it possible to extend prospecting of oil deposits in the Middle Kura depression, which are associated with the zones of protrusions of the Mesozoic magnetoiactive associations. Many geophysical methods have mapped the dense Mesozoic associations, but only magnetic prospecting has been able to reveal the geological associations of basic and middle consistency [18].
12. Conclusion
The complex geological structure of Azerbaijan determines the highly intricate nature of its gravity and magnetic fields, which reflect the superimposed effects of outcropped bodies and structures and those buried at various depths. It was shown that a combined gravity-magnetic investigation (including the field behaviors at different levels, qualitative and modern quantitative analyses, and 3D combined modeling of potential fields) is powerful tool for studying such complex geological regions as the land of Azerbaijan. A significant role is played by the analysis of petrophysical characteristics, as well as an integrated examination of seismic, magnetotelluric and thermal data. On the basis of a comprehend-sive combined analysis of gravity and magnetic fields, a series of 3-D regional PGMs (including the area of the Saatly Super-Deep borehole), covering Azerbaijan and some adjacent land areas, were developed. The key examples of PGMs presented here highlight the significant formational and tectonic peculiarities of Azerbaijan’s deep structure and could be used for various types of geological-geophysical zonation. The next steps should include a more detailed physical-geological examination of these PGMs.
13. Acknowledgements
The author would like to thank the anonymous reviewers who thoroughly reviewed the manuscript, and whose critical comments and valuable suggestions were so helpful in preparing this paper.
This article is dedicated to the memory of Prof. Boris Khesin who passed away on November 8, 2010 in his 79th year.
14. References
[1] Katz B., Richards D., Long D. and Lawrence W., “A new look at the components of the petroleum system of the South Caspian Basin,” Journal of Petroleum Science and Engineering, Vol. 28, 2000, pp. 161-182. doi:10.1016/S0920-4105(00)00076-0
[2] Diaconescu C. C., Kieckhefer R. M. and Knapp J. H., “Geophysical evidence for gas hydrates in the deep water of the South Caspian Basin, Azerbaijan, ”Marine and Petroleum Geology, Vol. 18, 2001, pp. 209-221. doi:10.1016/S0264-8172(00)00061-1
[3] Jackson J., Priestley K., Allen M., Berberian M., “Active tectonics of the South Caspian Basin,”Geophysical Journal International, Vol. 148, 2002, pp. 214-245.
[4] Brunet M.-F., Korotaev M. V., Ershov A. V. and Nikishin, A. M., “The South Caspian Basin: a review of its evolution from subsidence modeling,” Sedimentary Geology, Vol.156,2003,pp.119-148. doi:10.1016/S0037-0738(02)00285-3
[5] Knapp C. C., Knapp J. H. and Connor J. A., “Crustal-scale structure of the South Caspian Basin revealed by deep seismic reflection profiling,” Marine and Petroleum Geology, Vol. 21, 2004, pp.1073-1081. doi:10.1016/j.marpetgeo.2003.04.002
[6] Manley D.M., Mohammed S.F. and Robinson N.D., Thomas R.W., “Structural interpretation of the deepwater Gunashli Field,” facilitated by 4-C OBS seismic data, The Leading Edge, No. 9, 2005, pp. 922-926. doi:10.1190/1.2056396
[7] Mekhtiev Sh. F. and Gadjiev T. G. (Eds.), “Azerbaijan SSR, Economic Minerals,” Ministry of Geology of the USSR, 1976, Moscow.
[8] Gadjiev R. M., “Deep geological structure of Azerbaijan, ”Azgosizdat, 1965, Baku (in Russian).
[9] Tzimelzon I. O., “Deep structure of the Earth’s crust and tectonics of Azerbaijan on the geophysical data analysis,” Soviet Geology, 1965, No. 4, 103-111 (in Russian).
[10] Shekinsky E., Radzhabov M., Timukyan G., Levi V. and Riger R., “Study of the Earth’s crust structure in Azerbaijan using deep seismic sounding,” Izv. Akad. Nauk Azerb. SSR, 1967, Ser.: Nauki o Zemle, 5, pp.41-50 (in Russian).
[11] Khesin B. E., “Geophysical characteristics of tectono-magmatic zones of Azerbaijan,” Geotektonika(in Russian), No. 6, 1968, pp. 61-69.
[12] Tzimelzon I. O., “Relation between the tectonics of sedimentary deposits of Azerbaijan and earth’s deep structure,” Geotectonics(in Russian), No. 5, 1970, pp. 69-81.
[13] Azizbekov Sh. A., Agabekov M. G., Grigoryants B. V., Shikalibeyli E. Sh. and Mamedov A. V., “The history of the geological evolution,” In: Azizbekov Sh. A. (Ed.), Geology of the USSR, Azerbaijan, Nedra, Moscow(in Russian), Vol. XLVII, 1972, pp.441-503.
[14] Shikhalibeyli E. Sh., “Location of Azerbaijan in general structure of the Caucasus and surrounding folded region,” In: Azizbekov Sh. A. (Ed.), Geology of the USSR, Azerbaijan, Nedra, Moscow(in Russian), Vol. XLVII, 1972, pp. 286-290.
[15] Khesin B. E., “Prognosis and localization of hidden mineralization in mountainous regions on the basis of geophysical data, ”Nedra, Moscow (in Russian), 1976.
[16] Gugunava G. E., “Interrelation of some geophysical fields and deep structure of the Caucasus,” Mezniereba(in Russian), Tbilisi, 1981.
[17] Alexeyev V. V., Gadjiev T. G., Karkoshkin A. I. and Khesin B. E., “Gravity and magnetic anomalies in Azerbaijan and their geological interpretation,” Map Printing Factory, Leningrad (in Russian), 1988.
[18] Khesin B. E., Alexeyev V. V. and Eppelbaum L. V., “3-D modelling of gravity and magnetic fields as a final stage of application of effective interpretation system of geophysical data under difficult geological conditions,” Geoinformatics, Vol. 4, No. 3, 1993, pp.177-188.
[19] Khesin B. E., “Alexeyev V. V., Eppelbaum L. V., Interpretation of Geophysical Fields in Complicated Environments,” Kluwer Academic Publisher, 1996, Ser: Modern Approaches in Geophysics, Boston – Dordrecht – London.
[20] Sarker G., and Abers G. A., “Deep structures along the boundary of a collision belt: attenuation tomography of P and S waves in the Greater Caucasus,” Geophysical Journal International, Vol. 133, 1998, pp. 326-340. doi:10.1046/j.1365-246X.1998.00506.x
[21] Ershov, A. V., Brunet, M.-F., Korotaev, M. V., Nikishin, A. M. and Bolotov, S. N., “Late Cenozoic burial history and dynamics of the Northern Caucasus molasses basin: implications for foreland basin modeling,” Tectonophysics, Vol. 313, 1999, pp. 219 - 241. doi:10.1016/S0040-1951(99)00197-3
[22] Artyushkov E. V., Mörner N.-A. and Tarling D. H., “The cause of loss of lithospheric rigidity in areas far from plate tectonic activity,” Geophysical Journal International, Vol. 143, 2000, pp.752-766. doi:10.1046/j.1365-246X.2000.00275.x
[23] Kaban M. K., “A gravity model of the north Eurasia crust and upper mantle: 2. The Alpine-Mediterranean foldbelt and adjacent structures of the southern former USSR,” Russian Journal of Earth Sci., Vol.4, No.1, 2002, pp. 19-33. doi:10.2205/2002ES000082
[24] Allen M. B., Vincent S. J., Alsop G. I., Ismail-zadeh A. and Flecker R., “Late Cenozoic deformation in the South Caspian region: effects of a rigid basement block within a collision zone,”Tectonophysics,Vol.366,2003,pp. 223-239. doi:10.1016/S0040-1951(03)00098-2
[25] Saintot A., Brunet M.-F., Yakovlev F., Sebrier M., Stephenson R., Ershov A., Chalot-Prat F. and McCann T., “The Mesozoic-Cenozoic tectonic evolution of the Greater Caucasus,” The Geological Society of London, Memoirs, Vol. 32, 2006, pp.277-289.
[26] Leonov Yu. G. (Ed.), “The Greater Caucasus in the Alpine Epoch,” Geos, 2008, Moscow (in Russian).
[27] Ricketts J. W., Takedatsu R., Mellors R. J., Sandwell D., Gok R. and Yetirmishli G., “Crustal structure of the Caucasus and Caspian region using gravity and receiver functions,” Trans. of the American Geophysical Union, 2008, Fall Meeting, abstract No. T21A-1922.
[28] Khain V. E., “Structure and main stages in the tectonic-magmatic development of the Caucasus: An attempt at geodynamic interpretation,” American Journal of Science, Vol. 275A, 1975, pp. 131-156.
[29] Khain V. E., “Tectonics of continents and oceans,” Nauchnyi Mir, Moscow (in Russian), 2000.
[30] Barton P. J., “The relationship between seismic velocity and density in the continental crust - a useful constraint? ” Geophys. J. R. Astr. Soc., Vol. 87, 1986, pp. 195-208.
[31] Nikolsky Yu. I., Milai T. A. and Kogan L. Z., “Geological-geophysical studies of the tectonics, magmatism, and metallogeny of the Caucasus,” Nedra, Leningrad (in Russian), 1975.
[32] Gongadze S. A., “Anomalous gravity field of Georgia and some problems of its geological-geophysical interpretation,” Ph. D. Thesis, Institute of Geophysics, Tbilisi, Georgia, 2006.
[33] Khesin B. E. and Eppelbaum L. V., “Development of 3-D gravity-magnetic models of Earth’s crust in complicated regions of Azerbaijan,” Proceed. of the 69th EAGE Conference, London, Great Britain, 2007, p. 343.
[34] Pilchin A. N. and Eppelbaum, L. V., Determination of the lower edges of magnetized bodies by using geothermal data, Geophysical Journal International, Vol.128, 1997, pp. 167-174. doi:10.1111/j.1365-246X.1997.tb04077.x
[35] Eppelbaum L. V. and Khesin B. E., “Advanced 3-D modelling of gravity field unmasks reserves of a pyrite-polymetallic deposit: A case study from the Greater Caucasus,” First Break, Vol. 22, No. 11, 2004, pp. 53-56.
[36] Khain V. E., “Mesozoic–Cenozoic Accretionary complexes of the Greater Caucasus,” Doklady Earth Sciences, Vol. 413A, No. 3, 2007, pp. 376-379.