Journal of Geographic Information System
Vol.09 No.01(2017), Article ID:74435,13 pages
10.4236/jgis.2017.91003
Developing a Web-Based Water Distribution Geospatial Information System for Nairobi Northern Region
Lucy Mulongo Mamai*, Moses Gachari, Godfrey Makokha
Institute of Geomatics, GIS and Remote Sensing (IGGReS), Dedan Kimathi University of Technology, Nyeri, Kenya

Copyright © 2017 by authors and Scientific Research Publishing Inc.
This work is licensed under the Creative Commons Attribution International License (CC BY 4.0).
http://creativecommons.org/licenses/by/4.0/


Received: February 6, 2017; Accepted: February 25, 2017; Published: February 28, 2017
ABSTRACT
This research aimed at developing a web system that will allow effective dissemination, extraction and analysis of water utilities information over the internet. The northern region, one of the administrative regions of the Nairobi City Water and Sewerage Company was used as a case study. The research has customized and integrated an open source WebGIS system based on Quantum GIS for spatial data creation, MapServer as a web GIS server and PostgreSQL/PostGIS as a relational database. GeoMOOSE was used for the development of an interactive and friendly geographic user interface. The developed system enables users to view and interact with the spatial data. The research focused on improving the efficiency and effectiveness of the decision making process and data sharing.
Keywords:
Geographic Information System, Open Source Software, Spatial Database, WebGIS

1. Introduction
Geographic Information System has been proven to be an effective and powerful tool in the water distribution industry. GIS allows creation and management of spatially referenced data which is useful for any field or situation that utilizes spatial information [1] . In the recent past GIS has been mainstreamed, since every conceivable field can potentially be enriched by using GIS technology to manage the location based information such as education, and water resource management [2] . The remarkable growth of the internet and increased public interests in accessing online geospatial information have led to the development of web mapping applications. Due to advantages such as platform independency, reduction in the web is considered to be very important in spatial application development [3] .
GIS supports spatial analysis and locating geographically dispersed facilities in the water distribution system. Spatial location is typically a major common aspect of all the data at a water utility. A GIS can locate the exact position of a water utilities infrastructure such as valves, hydrants, meters and pumps displaying them as a softcopy map. Location information is important for effective management as good decisions can be made relative to the surrounding area and affected assets.
The objectives of this research were to;
・ Study the existing water distribution system and identify the user requirements.
・ Create a centralized spatial database.
・ Develop a web system that will allow effective dissemination, extraction and analysis of spatial information over the internet.
The developed WebGIS system can be accessed through a number of devices like computers, mobile phones and tablets. Unlike a traditional desktop GIS which is used by only one user at a time, the developed WebGIS can be used by dozens or hundreds of users simultaneously. The developed system is easy to use unlike the desktop GIS which is intended for professional users with months of training and experience in GIS. The WebGIS is intended for a broad audience, including users who are not GIS experts. The developed system is low cost as averaged by the number of users since the vast majority of internet content is free of charge to end users, one does not need to buy software or pay to use WebGIS.
2. Study Area
The study area Figure 1 is the Northern region one of the six administrative regions of Nairobi City Water and Sewerage Company which is made up of five commercial zones [4] . These zones are; Kahawa Wendani, Kahawa west, Kasarani, Mathare and Pangani. The area extends between 36˚47' and 37˚ east and approximately between 1˚9' and 1˚16' south and encompasses an area of 138.31 km2.
The selected region serves diverse customer types and consumption patterns ranging from individual customers, learning institutions, hotels, factories, etc. The region also has the highest number of customer connections translating to highest revenue collection for the company. The region also happens to host most of the water reservoirs for the city hence benefit of water flowing naturally without having to boost its pressure.
3. Methods and Materials
3.1. Datasets
Table 1 lists the various vector layers used in the application development whereas Table 2 shows the various open source tools used in the system development.

Figure 1. Study area.
3.2. User Requirements Assessment
In order to get the anticipated WebGIS portal requirements of the users, personal interviews were conducted using structured questions. A total of 50 questionnaires were distributed to several staff ranging from the regional manager, engineers, distribution supervisors, GIS officers, meter testing supervisors, metering supervisors, customer care supervisors, credit controllers to meter readers. Out of the 50 questionnaires distributed, 42 responses were received back and were used to determine which features they desired to use in the system.
3.3. Data Collection
Spatial data used for the study (both existing digital data files and hard copy

Table 1. Datasets used for the study.
Table 2. Open source softwares used for the study.
maps) was collected from Nairobi Water and Sewerage Company. The data included; water networks, customer meters, bulk meters, region/zonal/itinerary boundaries, appurtenances and index tiles together with their accompanying attribute information. Topographical features roads, contours, rivers, railway line and buildings were captured from topographic maps from Survey of Kenya. Parcel boundaries were also captured from cadastral plans also obtained from Survey of Kenya.
3.4. Spatial Data Processing
Quantum 1.8.0 GIS software [5] was installed then used to create/import vector layers for the contours, roads, rivers, buildings and parcel boundaries. Hard copy maps were vectorised through on screen digitizing from scanned maps then saved in ESRI’s shapefile format. Quantum GIS was also used to convert tabular data in Excel for bulk meters, customer meters and appurtenances into Esri shapefile format and corresponding attribute data was added.
3.5. Spatial Database Creation
PostgreSQL 9.2.3 [6] was installed with the default directory being the program files and port 5432 and a database super password also set for use when opening the PostgreSQL database. A new database (Water resources) was created in PostgreSQL using a friendly user interface PgAdmin. PostGIS 2.0 [7] was also installed and a database connection to the installed Postgres done by specifying the username, password and Port as set while installing PostgreSQL.
Importing Shapefiles
All shapefiles created for the study were converted to their corresponding relational tables in a PostgreSQL database. This was done to ensure performance of spatial analysis on data of the geographical objects. The conversion of shapefiles to PostgreSQL database tables was achieved by importing the shapefiles using the shapefile import/export manager plugin in PostGIS.
The resultant table contained all the attributes of the shapefile including the coordinates and geometry that define each feature. This process was repeated for each vector layer created for the scope of the study. After the database was configured and designed in PostgreSQL as required it was connected to Quantum GIS.
3.6. Web Design and Development
MS4W-MapServer 4 Windows-version 3.0.6 an open source platform for publishing spatial data and interactive mapping applications to the web was used as spatial data server, because of its excellent performance of functionality and speed on processing large volume dataset [8] . The MS4W contained default installations of Apache, PHP, MapServ, MapScript and some sample applications. It was structured in such a way as to allow upgrading individual components without affecting the install.
As shown in the Figure 2, the MapServer consisted of three different components: map file, template file and the CGI program. The map file was used to set

Figure 2. Flow of requests in MapServer.
the cartographic parameters, cartographic objects, data loading, classification, displaying and querying and graphic elements definition. It was composed of several objects in which each layer object inside the mapfile starts by keyword LAYER, defines the path and connection type to load the specified data, specifies the style and other parameters, and finishes by END. The mapfile allows direct connections for the shapefiles. The following code represents a mapfile created for the roads layer with connection to PostGIS.
LAYER
NAME 'Roads'
CONNECTIONTYPE postgis
CONNECTION "dbname=water_resources host=localhost port=5432
user=postgres password=lucymam"
DATA 'geom FROM roads'
STATUS on
TYPE LINE
MAXSCALE 4000000
LABELITEM 'rdname'
LABELMAXSCALE 3000000
CLASS
STYLE
WIDTH 1
COLOR 255 0 0
END
LABEL
FONT vera_sans
TYPE truetype
SIZE 6
COLOR 255 0 0
ANGLE 0
POSITION cc
FORCE true
MINFEATURESIZE auto
ANTIALIAS true
PARTIALS true
END
The template file was a common HTML page provided with MapServer specific parameters and variables. The template files were implemented to present maps, cartographic objects, query and all other information which the web GIS designer want to offer to the user.
The CGI program was the real data processing engine which when started up by the web server reads the map file settings and returns processed spatial data as maps, cartographic objects, variable values and query results shown in the template files. Every CGI output is a temporary image or value updated at each CGI work session.
3.7. Development of the Geographic User Interface
The geographic user interface was designed to make the user’s interaction simple and efficient in terms of accomplishing user goals. It allows the users to select and input the query criteria in order to view the required data.
GeoMOOSE [9] was installed as a plugin in MapServer for purpose of making the user interface friendlier. It was packaged in a MapServer for Windows (MS4W) package in order to make it simple and possible to get MapServer installed. The figure below demonstrates the running view of user interface implemented with GeoMOOSE 2.7.1. By using the user interface the user interact with the navigation tools such as zoom in, zoom out, and zoom to full extent to view the map at different scales and identification of different map features. Figure 3 demonstrates the running view of the geographic user interface as implemented with GeoMOOSE.
3.8. System Testing and Implementation
Testing was carried out for each component of the WebGIS framework that was implemented both in the database and web application levels.
For PostGIS and PostgreSQL testing was done by loading the relational tables created in case the geometry was not created then such a table would not be drawn in MapServer. As such the shapefile would be converted again untill the geometry was created.

Figure 3. Running view of the geographic user interface.
To test the connection between the created database and QGIS a connection was made made in QGIS then data of a chosen layer loaded into QGIS directly from the database. Edditing on this shapefile was done then on saving the changes were directly done in the relational table which is inturninterconneted to the MapServer hence change was reflected when displaying the data layer in MapServer.
3.9. Hosting the Web
Once the WebGIS was satisfactorily developed it was hosted on a web server in order to post it on the internet. To view the website a user need to type the web address www.waterresources.co.ke/app/ into their web browser.
4. Results and Discussion
Table 3 illustrates important features that the system users wanted implemented. The ranking was done on a scale of 1 to 4 with 1 being the least important and 4 being the most important. The system was therefore designed to meet these needs. From the analysis, system users expected the system to be able to support querying/view and update of spatial data.
An effective geospatial database management system that allows effective storage, management and retrieval of spatial data for water networks and other accompanying infrastructure was successfully developed. This can be used for management of water utilities assets and infrastructure. The connection of the database with QGIS ensures automatic updating of spatial data in the database hence saving on time while maintaining data integrity.
The developed WebGIS portal is able to dispatch accurate information on time and consists of various useful GIS tools for spatial data visualization, analysis, querying and finally production of maps in the form of map prints/PDF’s.
The results obtained through interacting with the developed web are diagrammatically illustrated in Figure 4 and Figure 5 depicts the results of feature
Table 3. Important features that system users wanted implemented.

Figure 4. Pipe identification using the identify button.
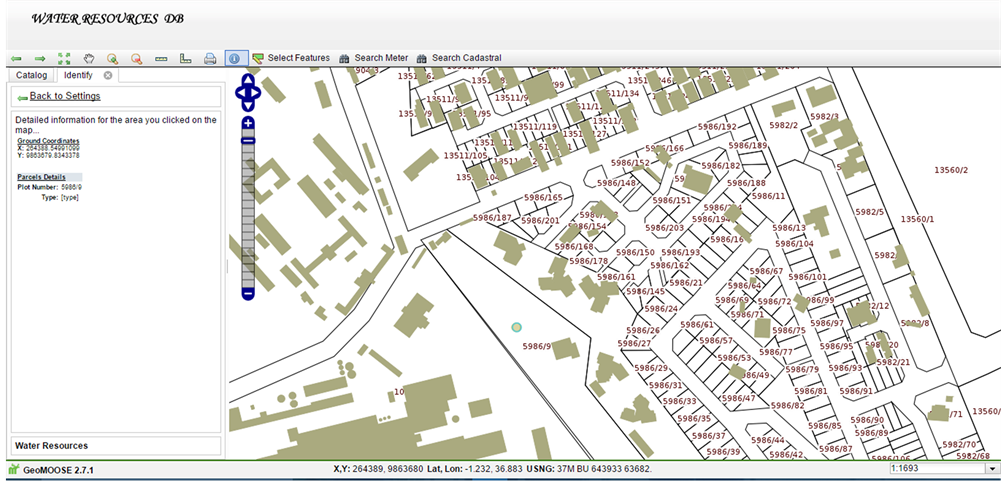
Figure 5. Parcel identification using the identify button.
Identification on the water networks and parcels layers respectively, Figure 6 depicts line measurement and the measurements units options available in the line measurement button, Figure 7 depicts area measurement and the available units of measurement, Figure 8 and Figure 9 illustrates the search results of a customer meter account and a cadastral parcel respectively.
Figure 10 illustrates the login form for the water resources database system. Upon entering the web address into the browser the user credentials are the “Username” and “Password”.
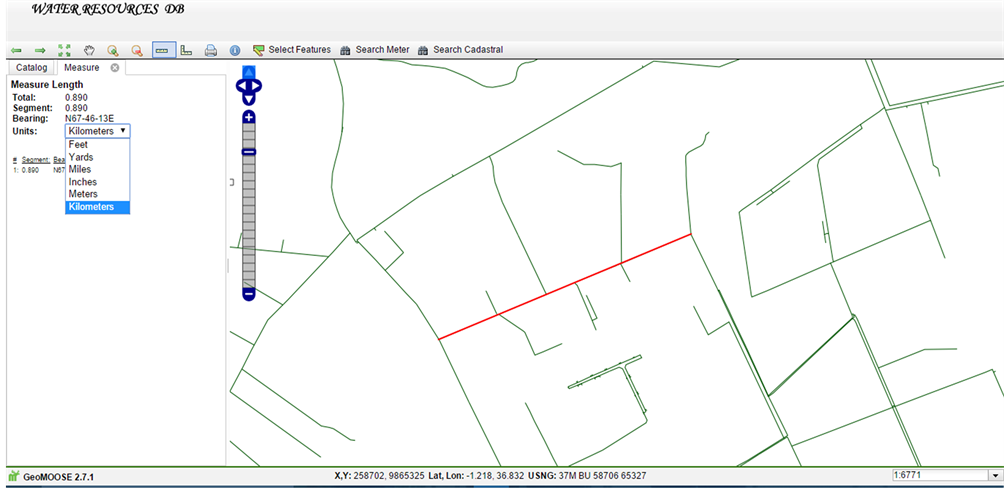
Figure 6. Length measurement using the linear measuring tool.

Figure 7. Area measurement using the area measuring tool.
5. Conclusions
From the study of the existing water distribution system it was realized that spatial data on water pipes, customer meters, bulk meters, appurtenances, topographic features and cadastral boundaries is available in digital format. The data can only be accessed by the GIS staff who are all based at the company headquarters. Therefore, those requiring to use these data must visit, call or send mails to the GIS staff who in return respond by sending back hard/soft copy maps. This is time consuming.

Figure 8. Screenshot of searching a meter.

Figure 9. Screenshot of a parcel searching.
A centralized database was created which allows effective storage, management and retrieval of spatial data. The developed WebGIS system consists of various useful GIS tools for spatial data visualization, analysis, querying and printing of maps. It can be used by people who know nothing about GIS due to its simplicity, intuition, and convenience. It also supports concurrent multi-user access. The study also shows that free open source softwares are feature rich and can help in the implementation of mapping and spatial analysis tools in both the

Figure 10. Screen shot of the water resources database login form.
public and private sectors, especially those that cannot afford proprietary softwares cost.
The developed WebGIS requires much higher performance and scalability for it to support the simultaneous access by a large number of users. The web takes time to download content from the server to the client computer, therefore the speed of downloading and displaying content with the developed system will depend on the bandwidth and content. Also different browsers will display content differently hence may not give a true reflection of the original content. Different screen sizes will also determine the clarity of the displayed content for example a 14 inch screen will display content more clearly compared to a mobile phone or personal digital assistant. Generally the security of the information is not guaranteed since the internet is very unsafe. The proposed approach did not link the geographic user interface to online services provided by Google like Google Maps and Geocoding.
Acknowledgements
The authors wish to thank the Nairobi City Water and Sewerage Company of Kenya, for providing data for this research work.
Cite this paper
Mamai, L.M., Gachari, M. and Makokha, G. (2017) Developing a Web-Based Water Distribution Geospatial Information System for Nairobi Northern Region. Journal of Geographic Information System, 9, 34-46. https://doi.org/10.4236/jgis.2017.91003
References
- 1. Longley, P.A., Goodchild, M.F., Maguire, D.J. and Rhind, D.W. (2005) Geographic Information Systems and Science. John Wiley & Sons Ltd., Chichester.
- 2. Kuria, D.N., Gachari, M.K., Macharia, M.W. and Mungai, E. (2012) Mapping Ground Water Potential in Kitui District Using Geospatial Technologies. International Journal of Water Resources and Environmental Engineering, 4, 15-22.
- 3. Singh, S.P. and Singh, P. (2014) Mapping Spatial Data on the Web Using Free and Open-Source Tools: A Prototype Implementation. Journal of Geographic Information System, 6, 30-39.
https://doi.org/10.4236/jgis.2014.61004 - 4. https://www.nairobiwater.co.ke
- 5. QGIS.
http://www.qgis.org/ - 6. PostgreSQL.
http://www.postgresql.org/ - 7. PostGIS.
http://postgis.net/ - 8. Mapserver.
http://Mapserver.org/ - 9. GeoMOOSE.
http://www.geomoose.org/