Journal of Geographic Information System
Vol.6 No.3(2014), Article
ID:46693,11
pages
DOI:10.4236/jgis.2014.63020
Use of Rough Sets Theory in Point Cluster and River Network Selection
Jia Qiu1, Ruisheng Wang1, Wenjing Li2,3
1Department of Geomatics Engineering, University of Calgary, Calgary, Canada
2School of Resource and Environmental Engineering, Wuhan University of Science and Technology, Wuhan, China
3Department of Geography, University of California at Santa Barbara, Santa Barbara, USA
Email: jiqiu@ucalgary.ca, ruiswang@ucalgary.ca, liwenjing@wust.edu.cn
Copyright © 2014 by authors and Scientific Research Publishing Inc.
This work is licensed under the Creative Commons Attribution International License (CC BY).
http://creativecommons.org/licenses/by/4.0/


Received 25 April 2014; revised 20 May 2014; accepted 30 May 2014
ABSTRACT
In this paper, we applied the rough sets to the point cluster and river network selection. In order to meet the requirements of rough sets, first, we structuralize and quantify the spatial information of objects by convex hull, triangulated irregular network (TIN), Voronoi diagram, etc.; second, we manually assign decisional attributes to the information table according to conditional attributes. In doing so, the spatial information and attribute information are integrated together to evaluate the importance of points and rivers by rough sets theory. Finally, we select the point cluster and the river network in a progressive manner. The experimental results show that our method is valid and effective. In comparison with previous work, our method has the advantage to adaptively consider the spatial and attribute information at the same time without any a priori knowledge.
Keywords:Rough Sets Theory, Map Generalization, Point Cluster, River Network, Progressive Selection

1. Introduction
Point and line are the two most common objects to represent the spatial features and phenomena on the map, e.g. we use points to denote the village on small scale map, the point of interests (POIs) of the searching results in web or mobile mapping, we also employ lines to represent the road, river, as well as the region border on nearly all the maps. Generally, maps are generated to different scales for specific purposes. One of the most important techniques for scale transformation is selection, which can be used to reduce the complexity of map contents, emphasize the interesting phenomena, and delete the unimportant details while maintaining the geometrical and topological relations between objects. Acquiring geodata is much easier than it once was; especially as the attribute information becomes increasingly available. This change gives the object selection an even wider implication—we should take into account not only the spatial characteristics of the objects, but also the attribute information during the process. Currently, most of the methods for object selection merely consider the attribute information. In considering of this, we proposed a novel method of using Rough Sets to combine the spatial and the attribute information together to evaluate the importance of spatial objects for progressive selection.
Rough sets is proposed by Z. Pawlak in 1990s, which can handle the incomplete and inaccurate data without relying on any a priori knowledge. In recent years, some researchers have tried to apply rough sets to cartographic generalization. Song et al. [1] employed the attribute reduction to mine the knowledge of river network selection. Li et al. [2] -[4] proposed a method based on rough set to generalize the point cluster as well as the river network. However, there are some limitations of their method, especially for applying the rough set to the non-decisional attribute information table. Our work is different from these two, we propose a strategy to assign decisional attribute for the information table, and use the dependency of attributes in rough sets to evaluate the importance of spatial objects for progressive selection.
The remainder of the paper is organized as follows: Section 2 surveys the related work. Section 3 outlines the main idea of object selection based on rough sets theory. Section 4 presents the experiments of the point cluster and river network selection. And Section 5 discusses the future application of our method.
2. Related Work
Research of point and line object selection in map generalization has a long history ranging from the traditional paper map to the electronic map on mobile device and web. Yan and Weibel [5] employ the Voronoi diagram for the point cluster selection. In their method, they constructed an equation taking into account the thematic importance as well as the local density to evaluate selection possibility. Unfortunately, this method lacks the ability to determine the weight of these two kinds of factors. Cai and Guo [6] introduced the Kohonen net to implement the selection of point set. The method can maintain the distribution feature of pointsbut doesn’t take the attribute information into account. De Berg et al. [7] proposed a method for the simplification of dot maps. They formalized the problem—derive coarse dot map from the fine one—by employing the concept of “ -approximations.” And they can then compute good approximations of the derived and source maps by a heuristic method. The approach could be applied to the map with large amount of points while only consider the geometric information. Bereuter et al. [8] [9] proposed the concept of Real-time generalization for the points on the mobile device. They use the quadtree to manage the points with its “hierarchical subdivision structure” and “progressive levels of detail”. By employing the indices of the quadtree as auxiliary data, they refined the algorithms of selection, simplification, aggregation and displacement for the points. Their method focuses mainly on the efficiency and the distribution character of the points; merely taking into account the attribute information.
There are also many approaches have been developed regarding river selection. Ai et al. [10] [11] implemented an algorithm by employing the Voronoi diagram to calculate the catchment of the hydrographic network, and use the area of the catchment as a main factor to evaluate the importance of rivers, but the experimental results is not satisfying. Buttenfield et al. [12] -[14] proposed a series methods for the generalization of National Hydrographic Dataset (NHD). Their approaches classify the hydrographic data by considering geographic factors—terrain and the climate, which include mountainous, hilly or flat, and dry or humid. Then, according to the characteristic of different types of hydrographic data, a researcher can set the processing sequence as well as the parameters of algorithms to generate coarse version of the fine hydrographic data. Hydrographic generalization results based on this method turn out to be quite effective. Sen et al. [15] [16] presented a method based on k-means clustering and Self Organizing Maps (SOM) to implement the generalization of the hydrographic data. This method enjoys the advantage that takes account of semantic information directly.
In addition to mainly focus on the geometrical information and the topological information, some researches about the generalization of river network address the thematic information. Dahinden and Sester [17] developed a method for the river network selection based on its importance. But the importance of the rivers is not determined by geometric or topologic features. It is in fact linked with “the fact and the frequency of their use”. The generalization result of this method is not stable, which highly related to the crowd sourcing information—the data in public repositories, and parameters of the assessment approach. Tinker et al. [18] also implement a hydrographic generalization based on the thematic information—the local mean annual precipitation.
Since the thematic information is acquired far more easily nowadays, we need to develop tools for the map generalization that can handle the spatial information (the geometrical, topological characteristic) and the attribute information (the thematic, semantic data) at the same time. In this paper, we propose a selection method based on the rough sets. Our method can integrate the spatial information and attribute information together to evaluate the importance of the spatial object, which is the criterion for the object selection. In addition, we carry out the selection process in a progressive manner to maintain the distribution consistency of spatial objects.
3. Objects Selection Based on Rough Sets Theory
The selection of point and line objects is based on their importance that evaluated by the spatial information and attribute information. The basic idea of employing rough sets theory to calculate the importance of geospatial objects is to find the dependency between attributes. Thus, we will introduce the concepts of rough sets theory, then, outline the method for information table construction, and propose the progressive selection algorithm.
3.1. Basic Concepts of Rough Sets
According to [19] , “the starting point of the rough sets theory is the indiscernibility relation, generated by information about objects of interest”. The indiscernibility relation is defined as an information table (also called an information system or an attribute-value table) in rough sets theory. A model of the information table can be defined as: . Where
  is a finite set of objects named as universe;
  is a finite set of attributes, where
  and
and  are conditional attribute subset and decisional attribute subset; for each attribute
 ,
,  is the function for designating the value for
 . An indiscernibility relation
 , where
 , is
, is .
.  in short
 , is the family of all indiscernibility of
 . “Another important issue in data analysis is discovering dependencies between attributes”
[19] . For subsets  and
and , if
, if , then
  depends on
  in degree k0
  k
k  1. POSC(D) is the positive region of U/D with respect to C, which consists of all the elements of U that can be uniquely classified to blocks of U/D by subset C.
Take Table 1 as illustration, six entities  are included. The conditional attributes and decisional attribute are
  and
and  separately. According to the above mentioned definitionsU/C = {{e1}, {e2}, {e3}, {e4}, {e5}, {e6}}, and U/D = {{e1, e4, e5}, {e2, e3, e6}}. Let subset P = {c1, c2}, then U/P = {{e1, e2, e3}, {e4, e6}, {e5}}. In this case, we could conclude that the POSC(D) = 6, and POSP(D) = 1, which can be interpreted that all elements of U can be uniquely classified to the partition U/D by means of C, while only 1 can be classified by means of P. Then the decisional attribute d totally depends on attribute set C, and 1/6 depends on attribute set P. For each attribute
 , the importance of ci for the decisional attribute D can be defined as
 , therefore, the importance of c3 is 1 - 1/6 = 5/6. That means without attribute c3, only 1/6 elements in U can be correctly classified, then the importance of attribute c3is 5/6.
By employing the dependency of attributes, we can calculate the importance of each conditional attribute if we can construct an information table for the spatial objects which are to be selected.

Table 1. Information table of rough sets.
3.2. Information Table Construction
Attribute information always can be easily transformed to quantitative indexes. While the spatial information sometimes cannot be obtained directly, we need use structuralization to extract it. Structuralizing spatial objects means to recognize and quantify the topological relations between objects and the spatial distribution features of objects. There are many methods for the structuralization of map objects, such as convex hull [20] , constrained TIN [21] , Voronoi diagram [22] and so on.
3.2.1. Structuralization of Point Cluster
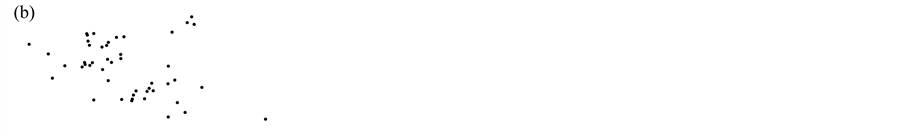
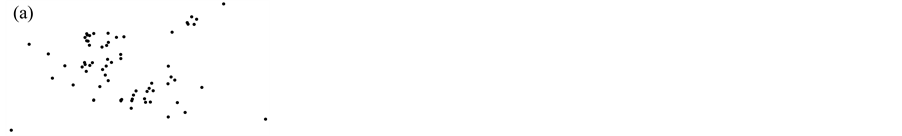
Take the hotel distribution of a city in Figure 1(a) as example. All the data in our experiment is vector data that can be displayed at any scale. First, the nesting level of the convex hull is constructed, which is shown in Figure 1(b). This information can represent the boundary structure of points since points on border have a greater impact on general structure than the inner points. Second, the Voronoi diagram, shown as Figure 1(c), is employed to represent the affection domain of each point. The larger the area is, the more important the point tends to be. Third, the local density, shown as the gray area of Figure 1(c) and Equation (1), can be derived from the Voronoi diagram. The smaller the local density is, the more opportunities the point to be retained during selection.
 . (1)
. (1)
where Di is the local density of point i, Si is the Voronoi area of point i, m is the count of the nighbours of point i, and Sk is the Voronoi area of point i’s neighbour point k.
In addition, we take into account the relation between the road and the point, shown as Figure 1(d). It is more convenient for the travellers to stay the hotel near by the main road; then we prefer to retain the point near to the main road.By employing these methods, we can quantify the spatial information of the point cluster—represent the border and inner of points by the level of convex hull, affection domain and local density by Voronoi area, and the location by distance to the road.
3.2.2. Structuralization of River Network
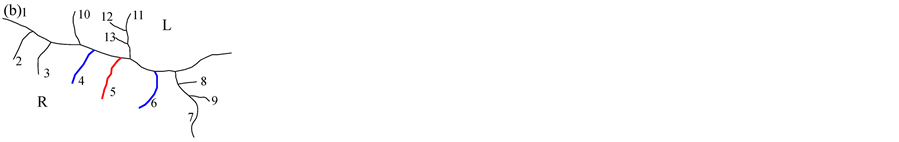
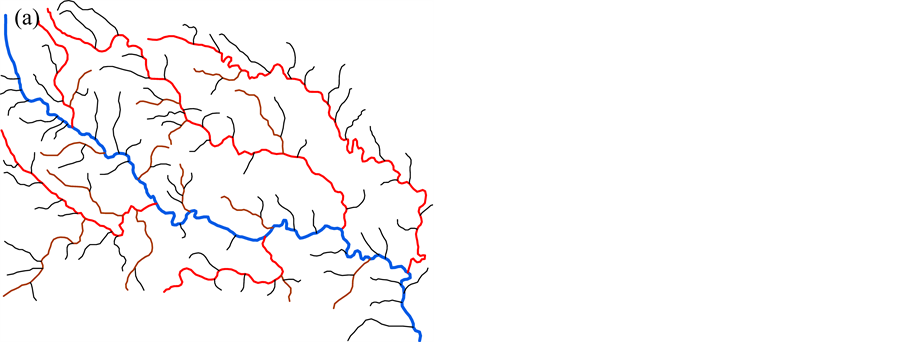
The pattern of the river network is more complicated than the point cluster. In this paper, we focus on the tree-like river network, which consists of a trunk river and some tributaries. Figure 2(a) is an example of the river network which consists of 14 rivers. The blue river 1 is the main stream and others import into it.
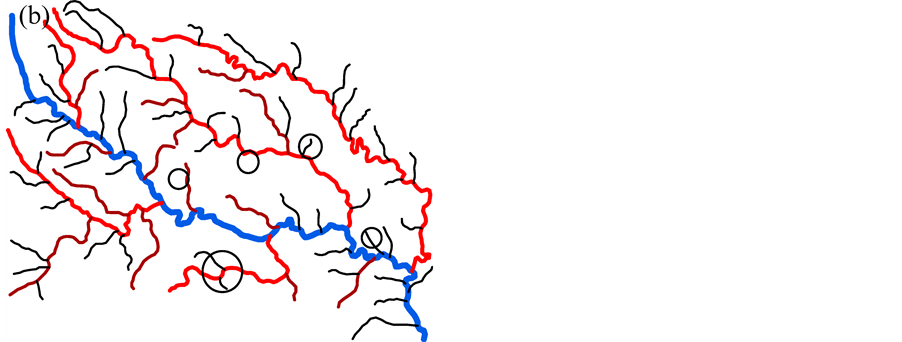
First, the length of each river should be taken into account to evaluate the importance of the rivers. Long rivers are always regarded as the geometrical skeleton of the network. Second, we use Horton code [23] as the grade to represent the hierarchy relationship between the rivers, which shown as Figure 2(a). No rivers import into rivers with grade 1. The red rivers, with grade 2, have the rivers with grade 1 directly imported into. And the blue river with the largest grade has many rivers with grade 2 directly imported into. We couldn’t remove the river before those rivers directly import into it are removed. Third, the level of the rivers showing in Figure 2(c) is employed to denote the tree-like structure of the rivers in this paper. The level is much like the binary tree, each node has at most two child nodes, distinguished as “left” and “right”, and nodes with children are parent nodes. In the river network, for each river the left tributaries are regarded as its left node, and right tributaries are the right node. Rivers in the same node are siblings to each other. For example, in this river network, river 4, 9, 12 are siblings to each other, river 1 is the common parent of these rivers, and river 4 has the left child river 5, the right child river 6. Deletion of the river with a higher level is more likely to destroy the tree-like structure than the deletion of a river with lower level. Then we prefer to select rivers with a high level. Fourth, the catchment of the rivers [11] , showing in Figure 2(b), is employed as an index as well. We use the Voronoi diagram of the rivers, which generated by TIN, to partition the space, and regard the Voronoi area as the catchment of the river. Furthermore, the catchment of the parent river owns all its children’s catchment. This index is a synthetical index which could represent not only the hierarchy relation between rivers, but also their intervals and local density. In addition, we introduce another index—a location metric—to reflect the location of rivers related to their parents in the tree-like structure. The index is shown as Equation (2).
 . (2)
. (2)
where Li is the location metric of river i, L is the length of river i’s parent, and n is the amount of river i’s sib-
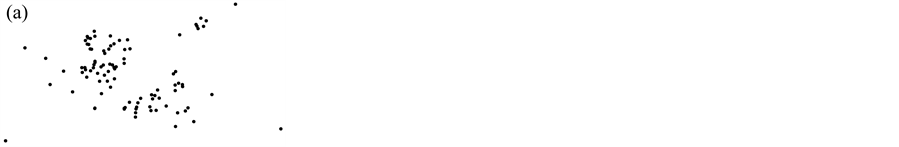
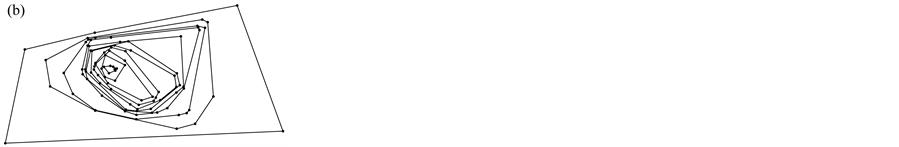

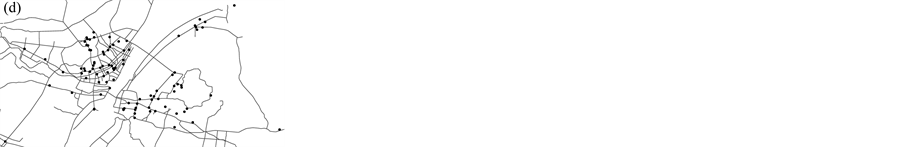
Figure 1. Structuralization of point cluster. (a) The hotel distribution. (b) the illustration of convex hull. (c) the Voronoi diagram and local density. And (d) the distance to the nearby road.
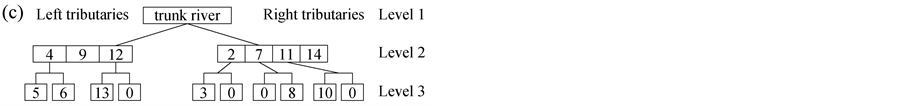
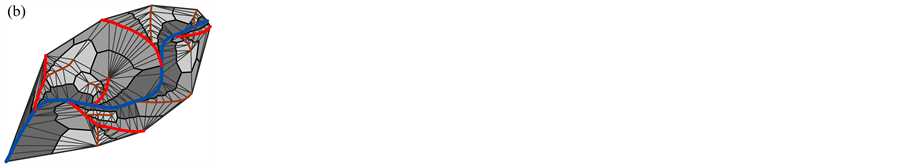
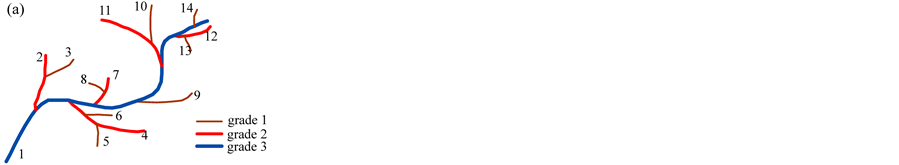
Figure 2. Structuralization of river network. (a) the illustration of the grade of the rivers. (b) the catchment area of the rivers. And (c) the level of the rivers.
lings in the tree. According to this definition, rivers that are siblings to each have the same location metric. The index is interpreted as follow: if two rivers import the same parent from the different sides, then the river with fewer siblings tends to be more important than the other river with more siblings regardless of all other indexes.
By the structuralization of river network, we can quantify the spatial information of the river network into several parameters—describe the tree-like structure by the Horton code (grade) and tree level, the catchment (or affection domain) by Voronoi area, and the location by location metric.
3.2.3. Information Table of Points and Rivers
After structuralization, we can construct the information table as Table 2 and Table 3 by adding the attribute information. In Table 2, the “Grade” and the “Number of Rooms” are attribute information of hotels. Grade represents the star-level of the hotel. This is also a synthetical index that manually generated according to the facilities, services, management, and et al. we can get this index via the internet. In addition, the number of the rooms can reflex the scale of the hotel immediately. In Table 3, we didn’t add any additional attribute information to this table. That is because the attribute information of the rivers is not easily obtainable. But we could add that kind of information to the table if it is available, such as the precipitation of the catchment.
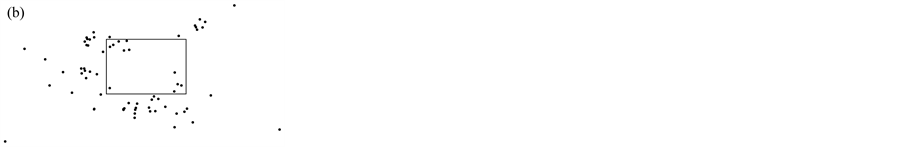
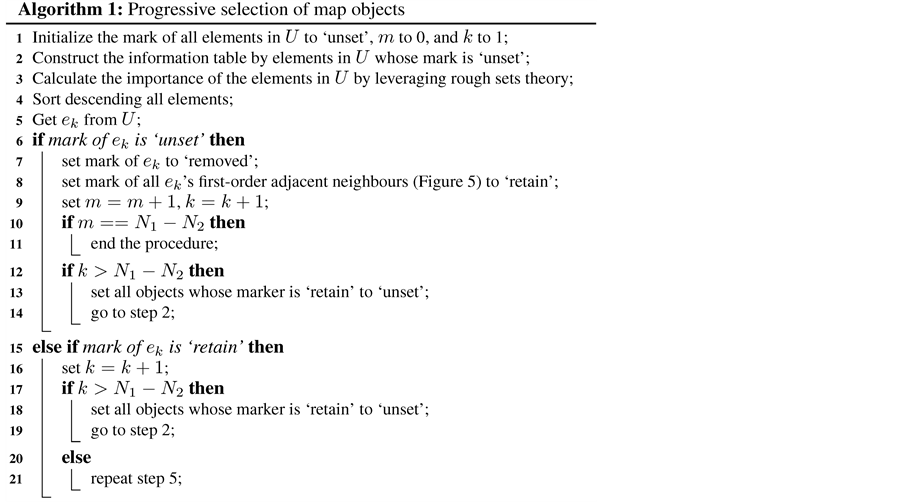
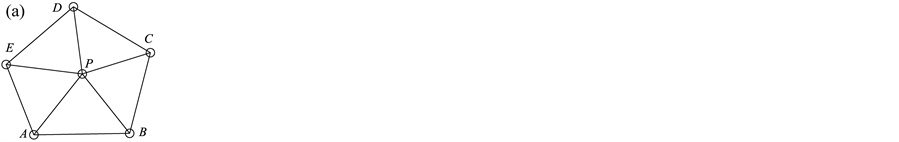
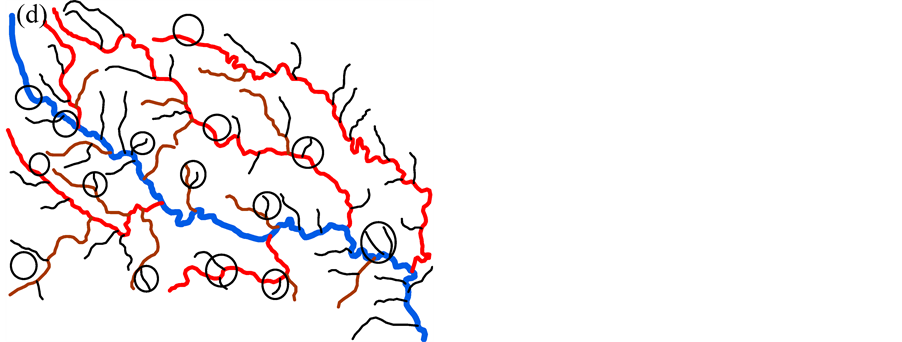
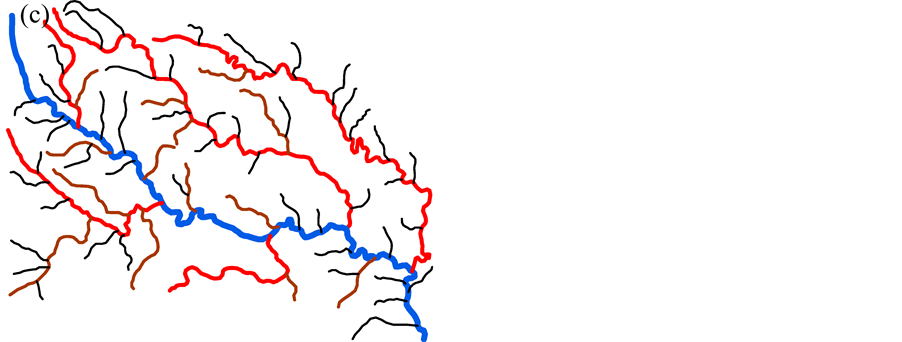
According to rough sets, to calculate the importance of conditional attributes, a decisional attribute should be contained. In the case of spatial object selection, the decision is to decide which objects should be deleted and which should be selected. But in Table 2 and Table 3, all attributes are conditional attribute—we cannot decide which object should be retained according only one of them. Therefore, we must assign the decisional attribute manually in order to conduct the selection operation. In general, we assign a fuzzy decisional attribute to each record by the value of all conditional attributes. The procedure is shown as below. First, discretize all continuous attributes since the rough sets is designed to handle the discretized data. Second, normalize all values to positive kind—the large the better—by Equation (3) if they are negative ones. Third, multiply all values of conditional attributes to deduct a fuzzy importance (Equation (4)) of spatial objects. And last, assign a decisional attribute for all objects. The details will be presented in section 4. Table 2. Information table for hotel selection. Table 3. Information table for river network selection. where vik is the discretized value of the attribute k of object i. where Wf,i is the fuzzy importance of object i, m is the amount of the conditional attribute. After we add the decisional attribute to the table according to the fuzzy importance of objects, we will get the information table with decisional attribute for objects selection. Then we can apply the rough sets theory to the information table for evaluating the importance of the spatial objects. 4. Experiment In this section, we use a hotel distribution of a city and a tree-like river network as the data set to test our algorithm. In order to maintain the distribution features of the objects, we proposed a progressive selection method. This turns out to be effective when comparing the selection results of automatic and manual. 4.1. Importance Evaluation of Map Objects Take Figure 1(a) as illustration to explain the general procedure of importance evaluation. There are 96 points represent 96 hotels in total. According to section 3, the information table of the hotel selection can be constructed as Table 4, the unit of local density, Voronoi area, and distance to road are km−1, km2, and kmseparately. First, we employ k-means algorithm to discretize the continuous attributes. In this process, the continuous attributes are classified into 4 categories, which approximate to the category of the grade of hotels. After normalizing the attribute to positive index according to Equation (3), the fuzzy importance of hotels can be calculated by Equation (4). Now, we can manually assign the decisional attribute of hotels by their fuzzy importance: sort descending all objects by their fuzzy importance; take the selection amount as boundary to set the decisional attribute as 3 to part of objects within this boundary, and 1 to part of objects outside the boundary, and 2 to the rest. This operation is rough due to the fact that we only need to know which objects have more opportunities to be selected. The selection amount is calculated by the “Radical Law” [24] shown as Equation (5). where N1 is the number of objects on the source map, N2 is the number of objects on the derived map, M1 is the scale denominator of the source map, and M2 is the scale denominator of the derived map. Now, we can obtain an information table with decisional attribute. And the rough sets theory can be applied to calculate the weight of each conditional attribute according to Part 1 of section 3.The importance of objects will be evaluated by Equation (6). where Wi is the importance of object i, Table 4. Information table of the hotel selection. represents the importance of the hotel and can be regarded as the inference to conduct the selection operation. 4.2. Procedure of Progressive Selection As the importance of each object has calculated, the information about which objects have greater opportunities to be retained during selection can be clearly obtained. But we cannot simply remove all objects with a relatively low importance. The removal of objects can change the local distribution where these objects are located, i.e. the Voronoi area, the local density, as well as their convex hull level. For example, we generalize the scale of the hotel to half of its source by deleting all points whose order is outside the selection amount (objects are sorted descending by their importance), and the result is shown as Figure 3(b). We can observe that this operation has destroyed the distribution feature of the hotel—most of hotels located in the center of the map have removed. Therefore, we proposed a progressive method for the selection of point clusters and river networks. To conduct the selection, first we set a mark for all the objects: “unset”denotes the object has not considered currently; “removed” denotes the objects should be removed after selection; and “retain” denotes not remove temporarily. The general procedure of the progressive selection is presented as Figure 4. The first-order adjacent neighbours of points and rivers are shown as Figure 5. The neighbour of the point is derived from the TIN: those points directly connected with the point by the edge of a triangle. For the point P in Figure 5(a), its neighbours are A, B, C, D, and E. The neighbour of the river is derived from the level of the river network: those siblings directly adjacent to the river without any other rivers import to their parent between their influxes. For the river 5 in Figure 5(b), its neighbours are river 4 and 6. Due to the hierarchy structure, the progressive selection of river networks is slightly different from the process of the point cluster. We only use rivers in the leaf node of the tree to construct information table in terms of we cannot remove a river before all its tributaries are removed. The progressive selection procedure iteratively constructs the information table to calculate the importance of the spatial objects. In addition to taking into account the spatial information and the attribute information of spatial objects, it considers the dynamic characteristic of the selection process. 4.3. Point Cluster and River Network Selection There are 96 points in the source map shown as Figure 1(a). Then we generalize the map scale to a half and a quarter of the source scale, 68 and 48 points will be retained after generalization according to the Equation (6). The results are shown as Figure 6. In comparison with a selection strategy that removes points at one time, the progressive approach can retain the distribution characteristic of the point cluster properly. For the river network, the experimental data is shown as Figure 7(a) [25] 5. Conclusion and Future Work In this research project, we applied the rough sets theory to the map objects selection directly. We extracted and quantified the spatial information of objects, and manually assigned a decisional attribute for the objects according to their spatial and attribute information. By doing so, we constructed a complete information table for Figure 3. Result of select at one time. (a) the source map of hotel distribution. And (b) the hotel distribution with half of its source scale by selecting at one time. Figure 4. Procedure of the progressive selection of map objects. Figure 5. Illustration of neighbours of object. (a) the first-order adjacent neighbours of point. And (b) first-order adjacent neighbours of river. Figure 6. Hotel selection results. (a) The hotel map with half of the source scale. (b) The hotel map with quarter of the source scale. the rough sets application—evaluating the importance of spatial objects. In addition, we proposed a progressive selection procedure based on the importance. The method has the capacity to take into account the spatial information as well as the attribute information in the meantime without any a priori knowledge. And the use of Figure 7. River network selection results. (a) the original map. (b) the map with half of the original scale selected by our method. (c) the map with the same scale as (b) selected manually. And (d) the automatic selection result by Ai et al. progressive selection techniques can take into full consideration the change of the spatial information during selection process and maintain the distribution pattern of objects after selection. In our method, the most important process is to quantify the spatial information of the objects. In other word, if we can quantify the spatial information of a kind of spatial entities, we then could evaluate the entities via the rough sets theory to perform a progressive selection. On the map, the road network and the contour cluster are also represented as lines. But their spatial characteristics are quite different from the tree-like river network. Many methods have been developed forrecognizing the structured spatial information of these objects, e.g. the “stroke” [22] [26] or the “block” [27] of the road network, the “curve set” [28] of the map. How to apply our method to these two kind of spatial features is a topic for further research. Acknowledgements This work was supported by the National Science Foundation of China under Grant No. 41271449. References . (3)
. (3) is the value after normalization, n is the amount of objects, and
  is the maximum value of attribute k among all objectsbefore normalization.
 . (4)
. (4) . (5)
. (5) . (6)
. (6) is the weight of the conditional attributek, vik is the value of attribute k of object i after discretization and normalization, m is the amount of conditional attributes. The value of Wi