Journal of Geographic Information System
Vol. 5 No. 1 (2013) , Article ID: 27921 , 9 pages DOI:10.4236/jgis.2013.51003
Modelling of Environment Vulnerability to Forests Fires and Assessment by GIS Application on the Forests of Djelfa (Algeria)
Laboratory of Geography and Territory Planning (LGAT), University of Sciences and Technology Houari Boumediene (USTHB), Algiers, Algeria
Email: msguettouche61@yahoo.fr, mguettouche@usthb.dz
Received April 27, 2012; revised June 1, 2012; accepted July 5, 2012
Keywords: Forest; Fire; Vulnerability; Model; Djelfa; GIS
ABSTRACT
Risk management of forest fires starts from its assessment. This assessment has been subject of several research works and many models of fire risk have been developed. One of them has been developed by ourselves, for the Mediterranean areas. However environmental vulnerability to forest fires is an important part of risk; it represents, in fact, the exposed challenge to this scourge and therefore it worths particular attention by decision makers. Thus and due to the importance of socio-economic potential of forest and the negative influence of fire on this one, we propose in this work, a model for vulnerability assessment to forest fires based on the principle of the weighted sum. Application of the proposed model suggested to use of geomatics technologies to the spatialize level of vulnerability. Within this framework, a GIS was developed and applied to the forests of Djelfa in the Saharian Atlas, as originality, it will allow the understanding of the concept of vulnerability and risk associated the steppes area scale to reach a good space control.
1. Introduction
It’s true that forest fires are difficult to identify and/or approach, the reality of the phenomenon is not easy. As many parameters are involved, especially ecological and socio-economical. The causes, frequency phenomenon and extension, of the must be searched for the vegetation structure and its environment.
Indeed, the mountainous regions of Maghreb represent high potential forest areas and are almost always in areas with high or very high density of rural population. This induces a higher risk of fire, whether in terms of hazard or in terms of vulnerability. Burnings are, increasingly, potentially important, because of the different human activities sources of ignition (barbecue, cigarette butts ...) in contact with a flammable vegetation and fuel, especially in the Algerian steppes area.
The fire risk assessment, based on historical and current data, and restitution of the results under a map form can be a remarkable contribution to forest managers in decision aid, so they can make on logical basis, all prevention policies. Cartographic degrees of risk, thus established, highlight sensitive areas at high fire risk (red areas), in which a concentration of effort and especially contingency plans are to provide objectively. Finally, we shall not forget that the fundamental purpose of the assessment of fire risk is to reduce their frequency and burned areas size, through preventive measures and ensure optimal use of limited resources available to fight against fires.
In this context fire risk approach that includes our theme, as it intended to present how we assess the vulnerability to the forest fires hazard and to show the contribution of the GIS approach in that Spatialization.
2. Methodology
Risk assessment of forest fires has been subject of several research works [1-17] and many fire risk indices were established. The index that is the subject of this work is vulnerability; we have established [13] and which deserves an improvement to make it applicable in the Mediterranean areas. Also, information must be completed concerning the method and the technique used in GIS to evaluate parameters.
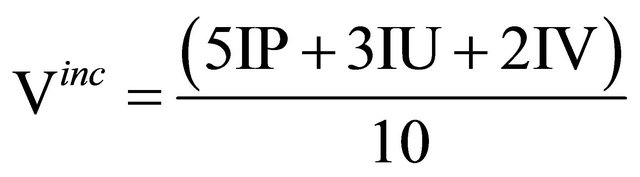
Based on the principle of weighted sum method, vulnerability index is designed as a model assigning each parameter a weight, depending on its socio-economic issue. It is given by the formula [13]:
 (1)
(1)
where:
IP: expresses the degree of human presence within or near the forest.
IU: expresses the degree of urbanization within or near the forest.
IV: expresses the degree of agricultural use within or near the forest.
Moreover, discussion with forestry experts of the Directorate of Forestry has found that several vulnerability criteria are omitted from this index. Indeed, this index (Equation 1), lack of parameters determining the pastoral and infrastructural potential which are characteristics of the Mediterranean forests. Then the technical evaluation of these parameters is not explicit.
Thus, and due to the importance and the degree of influence of these two issues in determining environmental vulnerability to forest fires, we propose in this work, to improve this model by adding other sub characteristic index of raised challenges and balancing the weighting. Next, we explain the method and assessment technique of various parameters by GIS.
2.1. Vulnerability Modeling to Forests Fires
To assess environmental vulnerability to forest fires, it is necessary to model each of the elements determining the vulnerability. This step is to select the parameters for each element and then using a representation model to assess vulnerability.
Parameters are the natural and socio-economic criteria of environment that will be affected by the outbreak, spread and fire intensity. These criteria are highly correlated and their combination defines vulnerability.
Based on the principle of multi-criteria analysis and adopting the method of weighted sum. This definition of vulnerability can be formalized by the following equation:
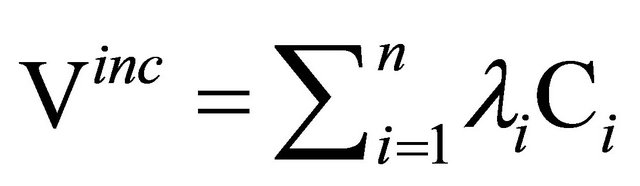 ; with
 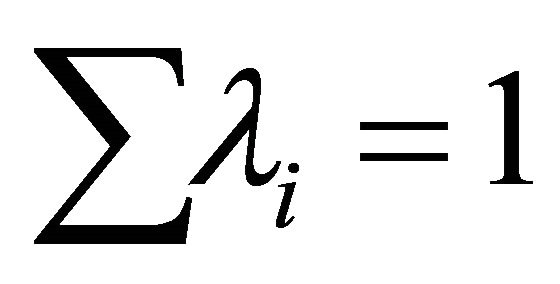 (2)
(2)
where:
Vinc: the environment vulnerability to a forests fires; Ci: the evaluation criteria and l the weight of the criterion i (i = 1,···,n).
The weighting depends on the issue exposed by the criteria which is more important to human life as biological life or the economic aspect.
The modeling and evaluation process can be diagrammed in Figure 1.
2.2. Criteria Identification for Vulnerability and Development Equation
The notion of vulnerability is difficult to define because it includes many economic and social parameters. A distinction between economic vulnerability and human vulnerability can be established:
• Economic vulnerability is structural (damage to proprty, damage to houses, collective works, communications channels, etc.).
• Human vulnerability estimates of harm to those on the physical and moral (deceased, injured, missing, etc.).
Thus, vulnerability defines a degree of loss within an area affected by hazard and the environment vulnerabilty, a property or person is his ability to receive damage following an accident. This leads us to consider the vulnerability to a feared event is an estimation of what will be the seriousness of this event if occurred.
The presence of humans and their agricultural activi ties, animals, houses and basic infrastructure (road networks and electricity) within or near the forests are the issue whose importance determines the degree of environment vulnerability: it is the protection of human life, and agro-forestry potential, and facilities. Thus, the soo-conomic parameter is the main term in the vulnerability model.
This can be formulated mathematically by the following weighted sum equation:
 (3)
(3)
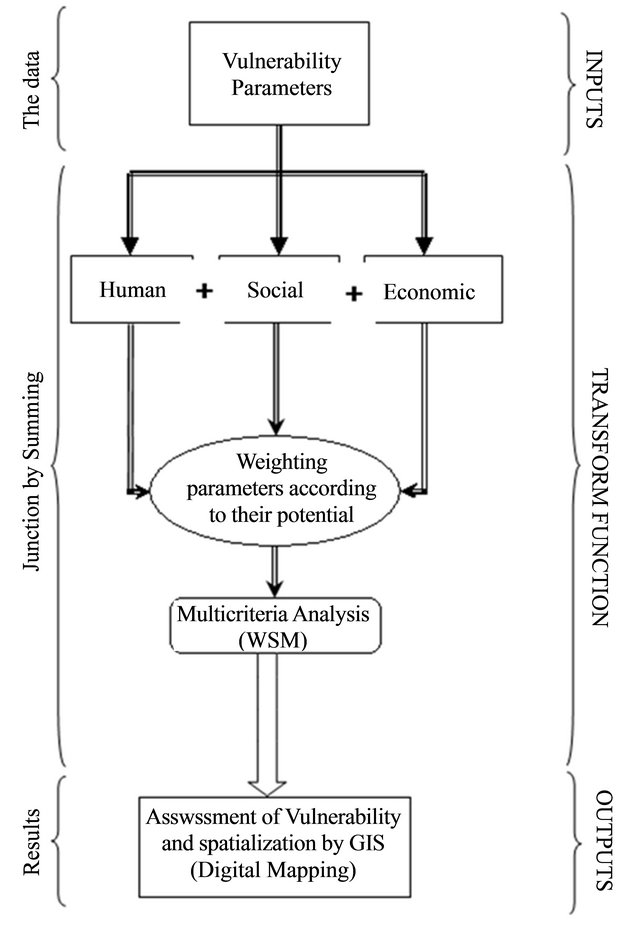
Figure 1. Process modeling and vulnerability assessment.
where:
 (4)
(4)
 (5)
(5)
 (6)
(6)
 (7)
(7)
with:
 (8)
(8)
 (9)
(9)
and
 (10)
(10)
 (11)
(11)
where:
PH: expresses the degree of human presence, it can be assessed by the number of people (Np) in a forest area of influence (Equation (4)), either within or immediately Neighborhood the forest.
PF: expresses the forestry potential is expressed here by the rate of vegetation cover. The latter is defined by the ratio of the number of trees (nA) to a unit area of 3 meters radius (Equation (5)).
PA: represents the presence of the crop activity in the influence forest area. It is defined as the ratio of the cultivated area (Sag) to the influence forest area (Equation (6)). The cultivated area is that which exists within a forest area or close it.
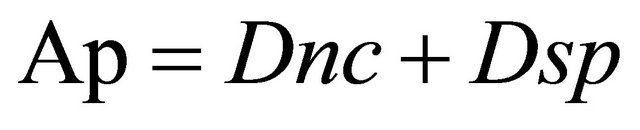
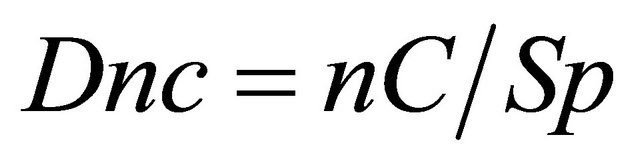
PP: represents the degree of pastoral activity in the influence forest area. It is defined as the ratio of the pastoral activity to the influence forest area (Equation (7)). Pastoral activity (denoted Ap) is determined by the sum of the normalized density of livestock and that of the pastoral area (Equation (8)). The normalized density of livestock is defined as the ratio of the number of head of livestock in pastoral area (Equation (9)). The normalized density of the pastoral area is the ratio of the pastoral area to forest area of influence (Equation (10)).
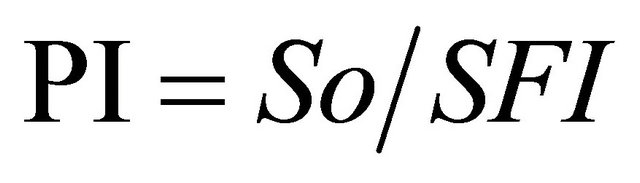
PI: Represents the potential for urban installations and infrastructures. It is defined by the ratio of the area occupied by these installations in the influence forest area (Equation (11)). The area occupied is defined by the sum of the areas occupied by habitations and by the networks (road, electric, other). The distance occupied by the network is referenced to a surface by taking an influence width of 25 m of both sides of the line center.
The influence forest area (denoted SFI) is defined by the forest plot and its close area. The neighborhood is defined by the distance of influence is which in maximum 300 meters and beginning from the boundaries of the forest plot [4]. Beyond this distance, we believe that intervention is possible for protection.
2.3. Notation Criteria and Vulnerability Assessment
Notation of the different vulnerability index and level are shown in the following Table 1.
2.4. Combination Matrixes
The combination between the different classes of weighted criteria (Equation (3)), one by one, indicates the level of environmental vulnerability to forest fires that we have presented under tables form (2, 3, 4 and 5).
Indeed, the weighted sum of the two classes of criteria, human potential and forestry potential, gives the degree of environmental vulnerability to forest fires (Table 2). This vulnerability is associated with the partial criterion, agricultural potential weighted 0.2, gives a second partial environmental vulnerability to forest fires (Table 3).
Table 1. Notation of vulnerability index and level.

Table 2. Combination matrix (PH + PF = 1 er pV).
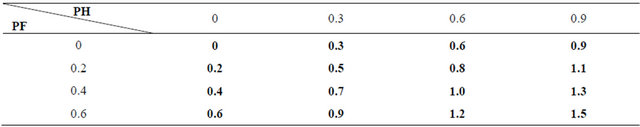
pV: partial vulnerability.
The third level of partial vulnerability (Table 4) is the result of 2 pV associated with the criterion, pastoral potential weighted at 0.2. This result, combined with the criterion potential infrastructure, weighted 0.1, given the level of environmental vulnerability to forest fires (Table 5).
Modeling of this method using a GIS will spatialize the degree of vulnerability and create maps of synthesis.
3. Model Spatialization by GIS: Application on the Djelfa Region
The approach we have adopted, for the spatialization of environmental vulnerability to forest fires, is based on GIS [2,11-13,17].
Before giving details, it makes sense to define the area in which our spatialization will be established.
3.1. Delimitation of the Study Area
The choice of investigation area is concentrated on the district of Djelfa, in the Saharian Atlas, part of Algerian agro-sylvo-pastoral areas (Figure 2). This choice is based on forest landscapes diversity, and also by its central situation related to the Algerian steppe area it’s different and contrasted natural and human data.
Geographically, Djelfa is a forest area in the Saharian Atlas. It is bordered in the north by the Zahrez Chott and in the south by the Saharian platform.
3.2. GIS Establishment
The satellite images, which allowed us to recognize the forest areas and to define the limits and expansions of map features necessary for the development of GIS, are those recorded by the Algerian satellite ALSAT1 in 2003, with 32 m resolution.
These images, acquired in three spectral bands (Green: 0.50 to 0.59, Red: 0.61 to 0.68 and Near Infrared: 0.79 to 0.89), were processed and analyzed by different remote sensing technical’s (vegetation indices, supervised classification, etc.) to land use map in the investigation area (Figure 3).
The field investigation also allowed us to collect data on the forests, agricultural and pastoral potential as well as basic infrastructures and urban development. These field data were used to correct the land use map and to assess the different criteria.
On this surface based map, we digitized the road net
Table 3. Combination Matrix (1 pV + PA = 2 pV).
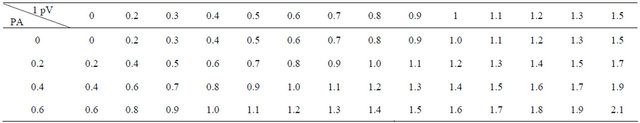
Table 4. Combination matrix (2 pV + PP = 3 pV).
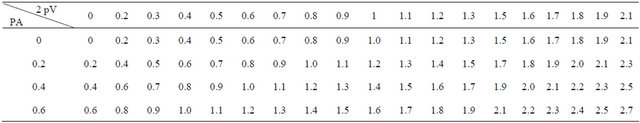
Table 5. Vulnerability matrix (3 pV + PI = Vinc).
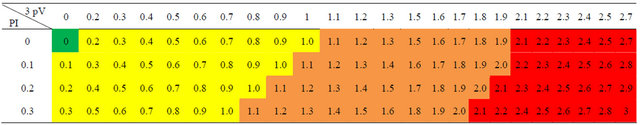
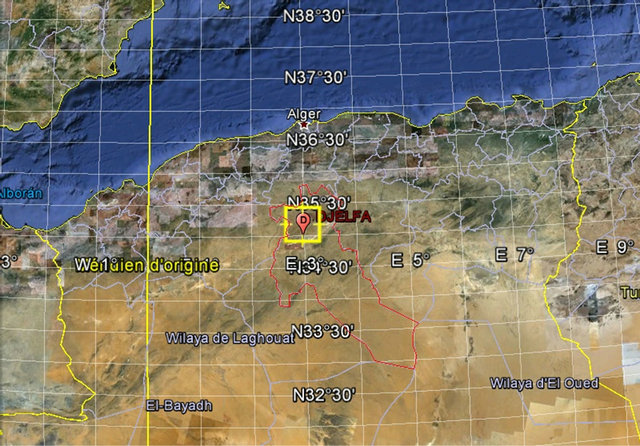
Figure 2. Location of the study area.
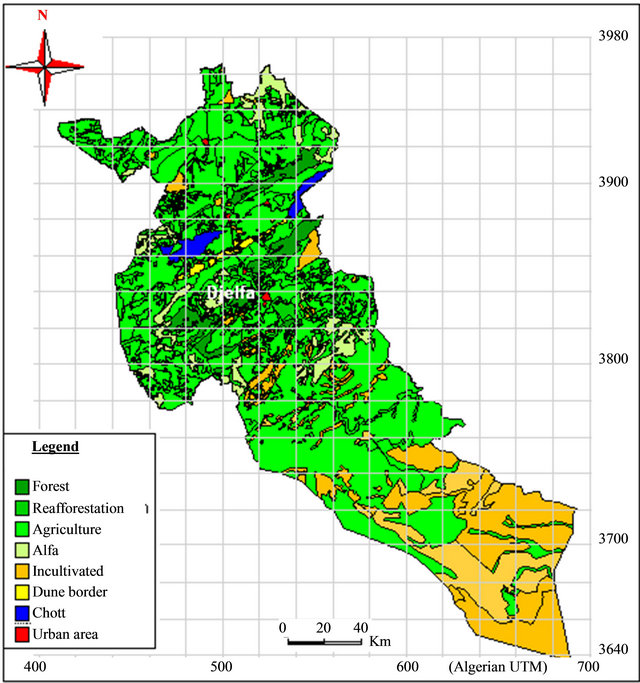
Figure 3. Land use map of Djelfa region.
work for which the influence surfaces corresponding to a radius of 50 meters have been established.
The whole data obtained by image processing or from the field investigation were compiled and implemented in GIS software (MapInfo 8) to define a model of mapping information. Indeed, a georeferenced database, organized and structured using the software, was carried out to better spatialization vulnerability to forest fires (Figure 4).
4. Results and Discussion
Digitalizing surface units of land use allowed us to establish the geographic database (entities) of the study area. It is used as a background graphic which we combined with the tributaries data (criteria).
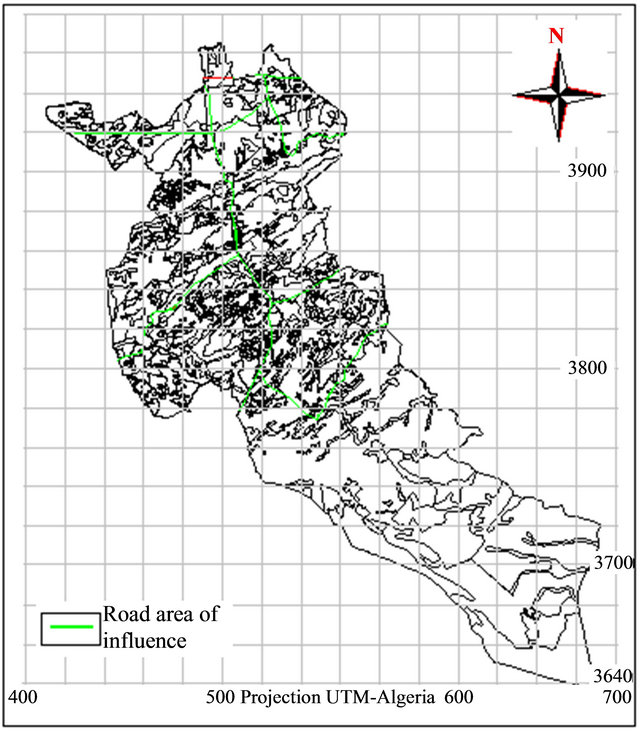
Digitizing the road network has been established from
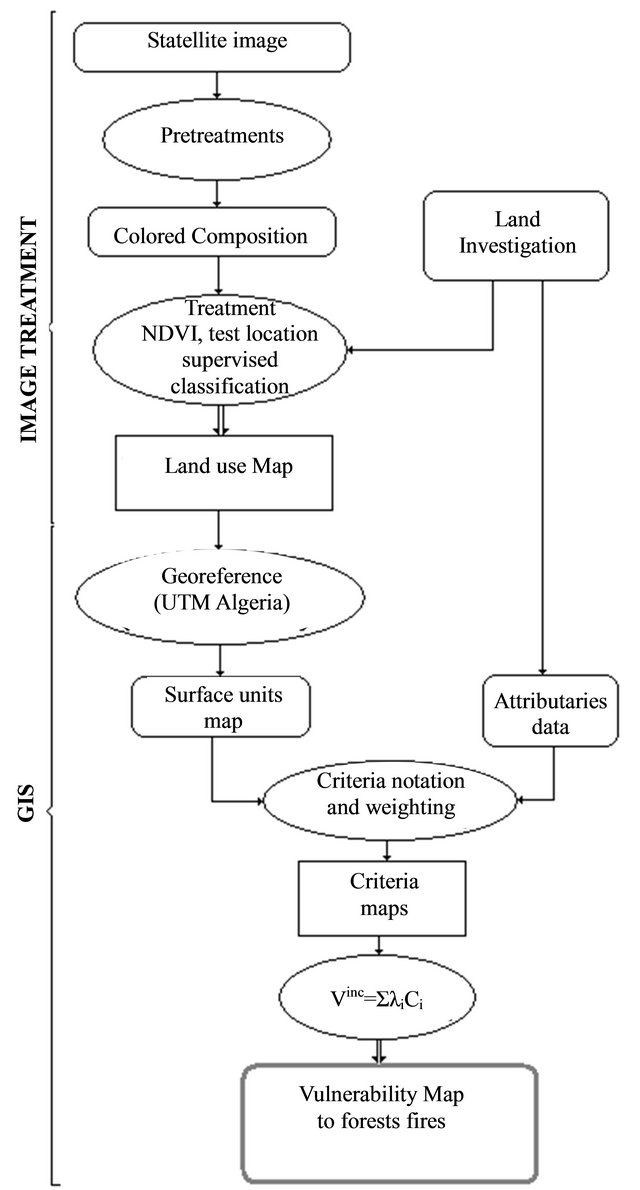
Figure 4. Diagram of vulnerability assessment and mapping process.
the image and using the road network map of Algeria. The lines were converted to the surface by creating buffers (Figure 5(a)).
The buffer function was also used to create forest area of influence (Figure 5(b)).
 (a)
(a)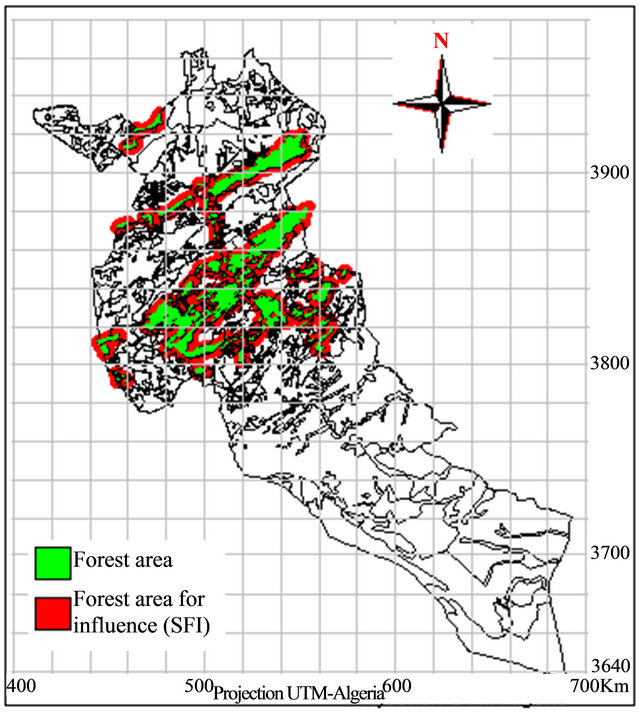 (b)
(b)
Figure 5. Creation process of influence area. (a) Map of road network and influence area; (b) Map of forest influence area.
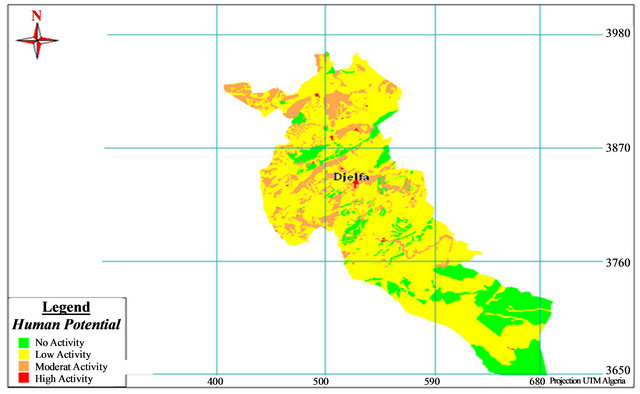
The criteria were assessed and weighted according to their socioeconomic and environmental issues and potential maps of the different criteria were established (Figures 6).
The combination by summing the five resulting layers, (Equation (3)), were used to determine the level of environmental vulnerability to forest fires in the Djelfa region (Figure 7).
The map highlights the dominance of low to medium vulnerability class with an area of over 290,000 ha, (rate of 69.6%) defining a medium to low vulnerability. All these areas are occupied by not cultivate area or by Alfa. The high vulnerability class has only 7% of the total surface area; it individualizes forests and their adjacent areas. This is very logical and consistent with the starting points of fires in Djelfa.
Class “not vulnerable” is less important, but well represented with an average of 14% of the area, they are in wetlands, in areas with rocky outcrops and dunes.
To validate our model, comparison between vulnerability map to forest fires was obtained, and the fires already recorded in the study area was established, helped to corroborate in most cases the results of this analysis. This comparison was used to assess the benefit limit of our model.
The superposition of vulnerability map with the sites
 (a)
(a)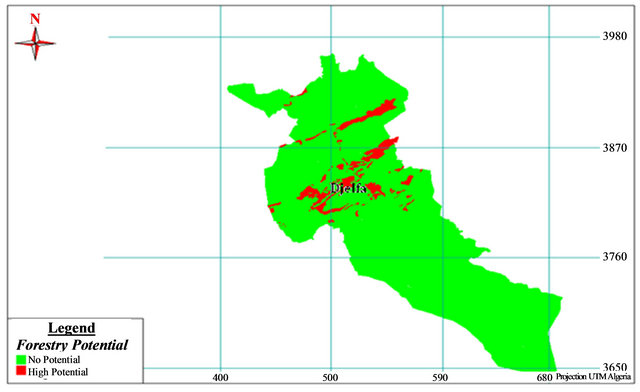 (b)
(b)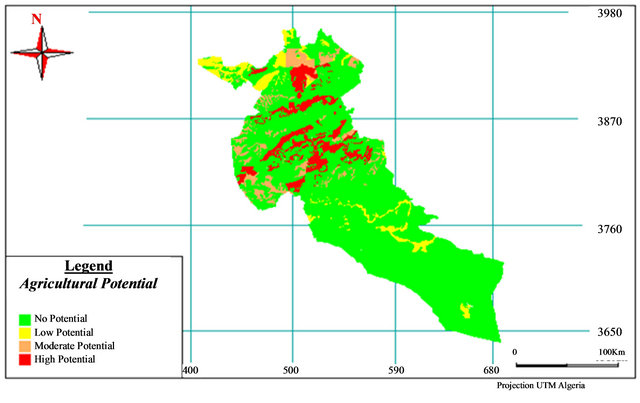 (c)
(c)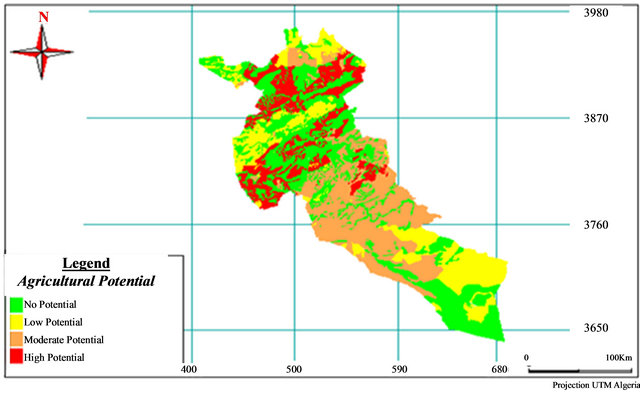 (d)
(d)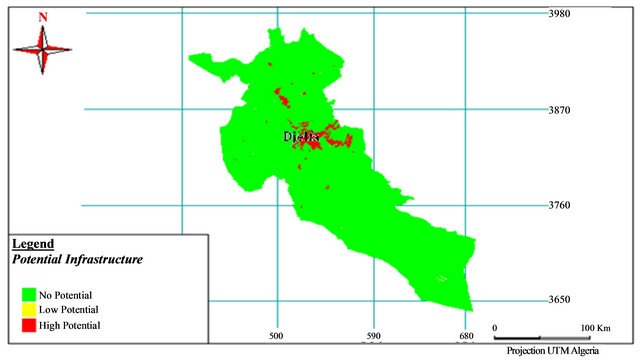 (e)
(e)
Figure 6. Results of different spatial vulnerability criteria. (a) Human potential of Djelfa region; (b) Forestry potential of Djelfa region; (c) Agricultural potential of Djelfa region; (d) Pastoral potential of Djelfa region; (e) Potential Infrastructure of Djelfa region.
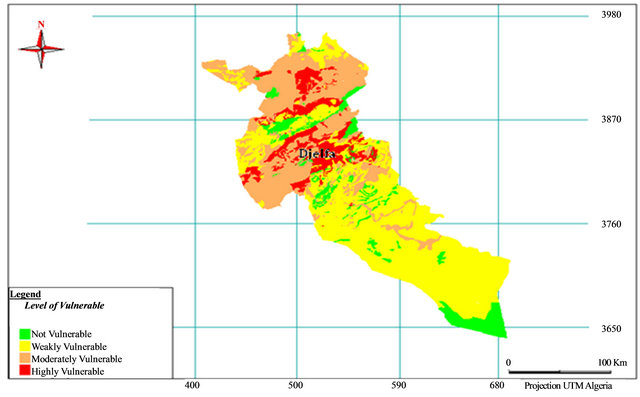
Figure 7. Map of environmental vulnerability to forests fires in Djelfa region.
already burned in the past, we allowed us to demonstrate the adequacy of the vulnerability level distribution and that of the reported fires. Therefore, the mapping model allows to highlight the areas most sensitive and to better identify and clarify priority protection areas. This map can be used for equipment installation, firewall trenching and trails establishment.
5. Conclusions
In this work, we proposed an improvement of our environmental vulnerability assessment model to forest fires, adding the issue of pastoral and human vulnerability.
Spatialization of vulnerability was established using a GIS approach. The application of the proposed model on the forest land of Djelfa region, using geomatics technologies (Remote Sensing and GIS), allows to make a map of environmental vulnerability to forest fires by combining multiple information layers took from maps and land. The operation of layers combination is used to set a map of human and socioeconomic potential of study area.
Vulnerability map is not a fight mean, but it helps foresters to make a plan and an adequate control. In addition, to manage the problem of hazardous urbanization in areas becomes possible and controllable.
6. Acknowledgements
This study comes within the framework of a national research project on modeling and the use of geomatics tools in earth sciences. We wish to thank the Forests General Directorate of Djelfa for their support, information and discussion with experts in this field.
In addition, we should be grateful to Mr. Yacine ZERARTI, translator-interpreter in University of Boumerdes, for his help to prepare this paper in technical English language.
REFERENCES
- D. Alexandrian, F. Esnault and G. Calabri, “Feux de Forêt dans la Région Méditerranéenne,” Unasylva, Vol. 50, No. 197,1999.
- M. Belhadj-Aissa and Y. Smara, “Application du SIG et de la Télédétection dans la Gestion des Feux de Forets en Algérie,” 2nd FIG Regional Conference, Marrakech, 2-5 December 2003.
- G. Carbonell, et al., “Embrasement Généralisé Eclair en Feu de Forêt,” European Medicines Agency, London, 2004.
- P. Carrega, “Le Risque d’Incendies de Forêt en Région Méditerranéenne: Compréhension et Evolution,” Institut des Risques Majeurs, Montpellier, 2008.
- P. Carrega and N. Jeronimo, “Risque Météorologique d’Incendie de Foret et Méthodes de Spatialisation pour une Cartographie a Fine Echelle,” Actes du XXème Colloque International de l’AIC, Tunis, 2007.
- P. Carrega, “A Meteorological Index of Forest Fire Hazard in Mediterranean France,” International Journal of Wildland Fire, Vol. 1, No. 2, 1991, pp. 79-86.
- P. Carrega, “Une Formule Améliorée pour l’Estimation des Risques d’Incendie de Forêt dans les Alpes Maritimes,” Revue d’Analyse Spatiale, Quantitative et Appliquée, No. 24, 1988, pp. 165-171
- E. Chuvieco, A. De Santis, D. Riaño and K. Halligan, “Simulation Approaches for Burn Severity Estimation Using Remotely Sensed Images,” Fire Ecology Special Issue, Vol. 3, No. 1, 2007, pp. 129-152 doi:10.4996/fireecology.0301129
- D. Tàbara, D. Saurí and R. Cerdan, “Forest Fire Risk Management and Public Participation in Changing Socioenvironmental Conditions: A Case Study in a Mediterranean Region,” Risk Analysis, Vol.23, No. 2, 2003, pp. 249-260. doi:10.1111/1539-6924.00305
- D. Spano, T. Georgiadis, P. Duce, F. Rossi, A. Delitala, C. Dessy and G. Bianco, “A Fire Index for Mediterranean Vegetation, Based on Micrometeorological and Ecophysiological Measurements,” 2003. http://natural-hazards.jrc.it(www.docstoc.com/docs/46516849/A-fire-risk-index-for-mediterranean-vegetation-based-on)
- G. Faour, R. B. Kheir and A. Darwish, “Méthode Globale d’Evaluation du Risque d’Incendies de Foret Utilisant la Télédétection et les SIG: Cas du Liban,” Revue d’Télé- détection, 2006, Vol. 5, No. 4, pp. 359-377
- C. F. Peigneux, “Utilisation des Systèmes d’Information Géoréférée dans l’Analyse du Risque.,” Université de Genève, Genève, 2003.
- M. S. Guettouche, A. Derias, M. Boutiba, M. A. Bounif, M. Guendouz and A. Boudella, “A Fire Risk Modelling and Spatialization by GIS. Application on the Forest of Bouzareah Clump, Algiers (Algeria),” Journal of Geographic Information System, Vol. 3, No. 3, 2011, pp. 247- 258. doi:10.4236/jgis.2011.33022
- M. Khader, et al., “Etude du Risque Incendie a l’Aide de la Géomatique: Cas de la Forêt de Nesmoth (Algérie),” Universitat d’Alacant, Alacant, 2009.
- A. Mariel, “Cartographie du Niveau de Risque d’Incendie, Exemple du Massif des Maures,” Centre of Agricultural Machinery, Agricultural Engineering, Water and Forests (CEMAGREF), Lyon, 1995.
- O. Meddour-Sahar, R. Meddour and A. Derridj, “Analyse des Feux de Forets en AlgErie sur le Temps Long 1876- 2007,” 2008. www.ciheam.org
- A. Missoumi and K. Tadjerouni, “SIG et Imagerie Alsat1 pour la Cartographie du Risque d’Incendie de Forêt,” 2nd FIG Regional Conference, Marrakech, 2-5 December 2003, p. 14.