Journal of Geographic Information System
Vol.4 No.3(2012), Article ID:19594,10 pages DOI:10.4236/jgis.2012.43026
Climate Change Induced Land Degradation and Socio-Economic Deterioration: A Remote Sensing and GIS Based Case Study from Rajasthan, India
1Department of Geology, Aligarh Muslim University, Aligarh, India
2Geological Survey of India, Western Region, Jhalana Dungri, Jaipur, India
Email: sayema.alig@gmail.com
Received February 27, 2012; revised March 16, 2012; accepted April 1, 2012
Keywords: Climate Change; Remote Sensing; Land Use/Land Cover; Socio-Economic
ABSTRACT
The present study attempts to identify and quantify climate change induced land degradation at watershed and village level in Jaggar Watershed of Eastern Rajasthan using remote sensing and GIS technique. The study utilizes Standard Geocoded FCC LISS II data of 1989, and LISS III data of 1998 and 2009 on 1:50,000 scale for Land use/land cover mapping. Maps were digitized, edited and analyzed in GIS to ascertain land use/land cover changes. Comparative analysis of the Land use/land cover statistics and village level household survey reveals that climate change has severely affected land use/land cover especially agriculture land. Agricultural land in the watershed has decreased from 12,026 ha (34%) to 10,400 ha (29.65%) from 1998 to 2009. The area occupied by surface water resources of the major water body has decreased by 207 ha owing to decline in rainfall over the years. Climate data analysis suggests that average maximum and minimum temperatures during the period 1977-2007 have increased by 1.2˚C and 0.4˚C respectively. Increasing trends of temperature suggests warming up of the area. Decline of ground water table by 1 - 2 m on annual basis coupled with significant drawdown has led to water scarcity in many parts of the watershed. The water table has gone down to a depth of 240 feet, which was reported at 60 - 70 feet 20 years back. The area has shown sharp decline of rainfall by 269 mm from 1977 to 2007. The survey results show that there has been shift in the cropping pattern during the last 20 years due to change in climate as well as decline in availability of water for irrigation. Climate change seems to have played a key role in Jaggar watershed resulting in land degradation and making rainfed agriculture more vulnerable.
1. Introduction
The definition of land degradation in the United Nations Convention to Combat Desertification (UNCCD) gives explicit recognition to climatic variations as one of the major factors contributing to land degradation. Concerns about land-use/cover change emerged in the research agenda on global environmental change several decades ago with the realization that land surface processes influence climate [1]. Land-use and land-cover changes are so pervasive that, when aggregated globally, they significantly affect key aspects of Earth System functioning. They directly impact biotic diversity worldwide [2]; contribute to local and regional climate change [3] as well as to global climate warming [4]; are the primary source of soil degradation [5]; and, by altering ecosystem services, affect the ability of biological systems to support human needs [6]. Land use is a dynamic phenomenon, and both its value and pattern change from one particular point of time to another and also from one geographical unit to another, with varying efficiencies, abilities, priorities and needs [7]. Land degradation will remain an important global issue for the 21st century because of its adverse impact on agronomic productivity, the environment, and its effect on food security and the quality of life [8].
In order to accurately assess sustainable land management practices, the climate resources and the risk of climate-related or induced natural disasters in a region must be known. Climate exerts a strong influence over dry land vegetation type, biomass and diversity. The generally high temperatures and low precipitation in the dry lands lead to poor organic matter production and rapid oxidation. Low organic matter leads to poor aggregation and low aggregate stability leading to a high potential for wind and water erosion [9].
In the context of productivity, land degradation results from a mismatch between land quality and land use [10]. Mechanisms that initiate land degradation include physical, chemical, and biological processes [11]. In an arid environment, where the ecosystem is always considered to be fragile, land cover changes often reflect the most significant impact on the environment due to human activities or natural forces [12]. Land degradation in arid and semiarid areas results from various factors, including climate variations and human activity, and can lead to desertification [13,14]. Principal processes of land degradation [15] include erosion by water and wind, chemical degradation (comprising acidification, salinization, fertility depletion, and decrease in cation retention capacity), physical degradation (comprising crusting, compaction, hard-setting etc.) and biological degradation (reduction in total and biomass carbon, and decline in land biodiversity). Data related to LC types and distributions are widely used to assess landscape condition and to monitor status and trends of ecosystem change over a specific time period [16]. Inventory and monitoring of the types and locations of land use and land cover (LULC) change provide valuable information to better understand change mechanisms and to model impacts on the environment and associated ecosystems [17-20].
Remote sensing and GIS has emerged as important tools in assessing natural resource degradation by providing timely, accurate and up to date information obtained remotely sensed data on a cost effective basis. Among the recent studies in India, one of the study has been done to analyse the land cover change of Garur Ganga watershed, Uttaranchal, revealed the decrease in forest cover and increase in agriculture/built up area for 1963-1996 period [21]. Another research was on land use/land cover change detection through remote sensing and its climatic implications in the Godavari Delta region, India which showed increase in wetland which influenced the climate of the area [22]. A case study was carried out in land use/land cover analysis of Guna district in Madhya Pradesh, India and found that forest cover has considerably reduced over 12 years period from 1989 to 2001 [23].
Present study makes an attempt to correlate the climatic changes vis-à-vis land use/land cover (natural resource), at watershed and village level as well. The study intends to decipher the impact of climate change on land use/land cover at watershed level besides assessing the climate change impact on socio-economic condition of the people of it will be this watershed, since majority of the people are dependent on rainfed agriculture. The satellite data analysis of 1989, 1998, and 2009 clearly demonstrates the LU/LC changes, which have taken place as a result of climatic changes and anthropogenic activities. The rainfed agriculture seems to be the worst hit, resulting in poor socio-economic conditions of the local people.
2. Study Site: Jaggar Watershed, Karauli District (Eastern Rajasthan)
The study area has been chosen keeping in view the scarcity of natural resource in terms of water biomass which has eventually affected the productivity of land. Development of ravines because of water erosion has further degraded the land resulting in reduced cultivation. The percentage of people involved in agricultural activities are 75%, who is the worst affected, socio-economically because of scarcity of water and degradation of land.
Jaggar watershed forms part of the Gambhir river basin, and is situated in Hindaun tehsil of Karauli district in eastern Rajasthan. It covers a geographical area of about 352.82 Km2, and is located between 77˚00'33"E and 77˚17'33"E longitudes and 26˚36'08"N and 26˚51'23"N latitudes. The area is mainly drained by Jaggar stream which almost flows from south to north (Figure 1). A small check dam (called Jaggar bandh) is built in the central part of the watershed which primarily serves as source of irrigation through canal locally. Apart from this there is no other source of irrigation and agriculture is mainly rainfed. Irregular and insufficient water supply to the canals and erratic power supply to the tube wells even at crucial stages of production remains a major problem of this watershed.
The elevation information derived from Advanced Spaceborne Thermal Emission and Reflection Radiome-
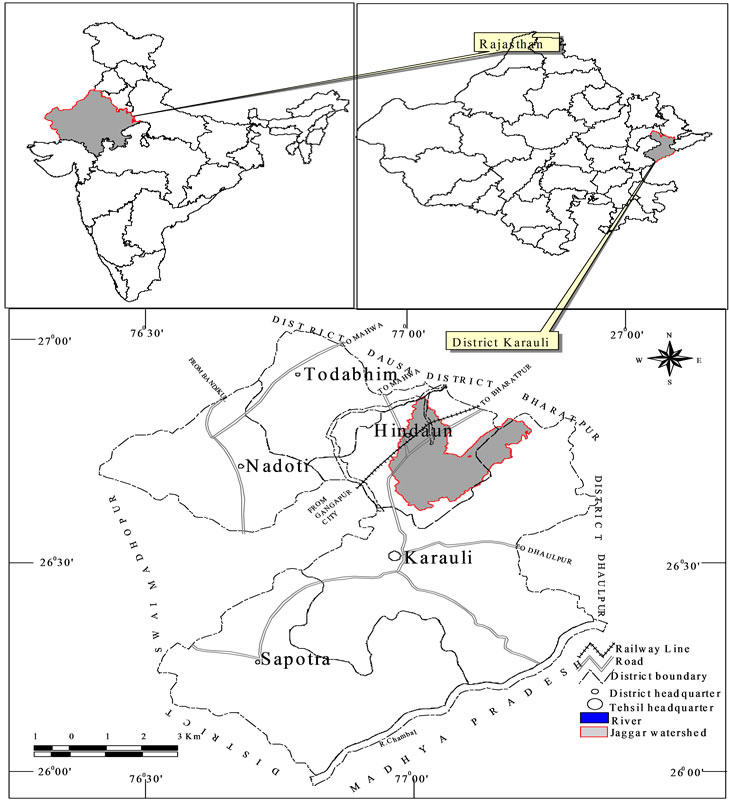
Figure 1. Location map of the study area.
ter (ASTER) indicates that the maximum and minimum elevations encountered in the watershed are 388 and 202 meter above mean sea level (MSL) respectively. The slope ranges from 0 degree to 22 degrees. Jaggar watershed is represented by alluvial plain and badland (ravines), in north and north-central part, and is traversed by structural plateau and hills and valleys in the south and southwest.
3. Methodology
Data sets used for the present study were derived from multiple sources and agencies such as Survey of India Topographical maps, Satellite Imagery from NRSC, Hyderabad. Meteorological data from India Meteorological Department, Pune, Ground data/GPS data obtained through field visits and secondary data collected from various government and non-governmental agencies.
Survey of India (SOI) topographic map numbers 54 F/1 & 54 F/2, 54 F/5 for Jaggar watershed, Karauli district surveyed in 1968-1969 & 1983-1984 on 1:50,000 scale, were obtained from Survey of India, New Delhi. Toposheets were used for demarcation of watershed boundaries taking slope, elevation and drainage flow directions as the basic inputs. Base map and drainage map were prepared for both the watersheds using relevant information on villages/town; elevation, contour lines, drainage network, major road and rail network were also extracted from the toposheets.
Geocoded Standard False Colour Composites (FCCs) of Indian Remote Sensing satellite (IRS) 1A Data Linear Imaging Self Scanning (LISS II), (Path-Row: 29:49) of 30th May, 1989 having a resolution of 36.25 meter; IRS- 1C Linear Image Self Scanning (LISS III), (Path-Row: 96-52) of 13th May 1998, of spatial resolution 23.5 meter; and IRS-P6 (LISS III), (Path-Row: 98-52) of 27th May, 2009 having a spatial resolution of 23.5 meter were procured from National Remote Sensing Centre (NRSC), Hyderabad, and was utilized for generating primary information on various parameters of the Jaggar watershed.
Satellite data were interpreted using the geotechnical and photographic elements such as tone, texture, pattern, association, drainage etc. for delineating various land use/land cover categories. Land use/land cover maps were imported in Arc GIS 10 software for digitization, editing and spatial analysis, area computation and output generation for Jaggar watershed. Change detection in land cover for the period 1989-1998, 1998-2009 & 1989- 2009 for Jaggar watershed was computed both, in hectares as well as in percentage.
Meteorological data obtained from IMD, Pune was used for the computation of annual average maximum and minimum temperatures and annual average rainfall for the period 1977-2007, where average rise in temperature (1977-2007) was computed in R-software. The secondary information/data were collected and utilized wherever required for the subsisting the current study, which includes published research papers, technical reports, special volumes and memoirs of Geological Society of India, and information from other government and non-government sources were consulted for the present study Structured questionnaire based household surveys were carried out in ten villages of Jaggar watershed to assess the impact of climate change on agriculture at landscape level. The villages selected for the survey were well spread across the watershed. In all 240 households were surveyed and information were recorded on variety of aspects related to socio-economic status, drinking water and fuel wood supply, crops grown and their output, source of irrigation, change in ground water level, shifts in crops, signs of land degradation and measures to control soil/water erosion and overall deterioration in natural resources.
4. Results and Discussion
The temperature data (1977-2007) of Karauli district obtained from Indian Meteorological Department (IMD), Pune, was divided into three seasons viz., winter (November, December, January & February), summer (March, April, May & October) and monsoon (June, July, August & September). The trends computed for annual average maximum and minimum temperatures show an increasing trend from 1977 to 2007, for all three seasons, except for maximum winter temperatures which show a declining trend (Figure 2). Analysis of temperature data in R-software reveals that during 1977-2007 period the maximum daytime temperature in winter season has decreased by –0.06˚C, whereas temperatures in summer
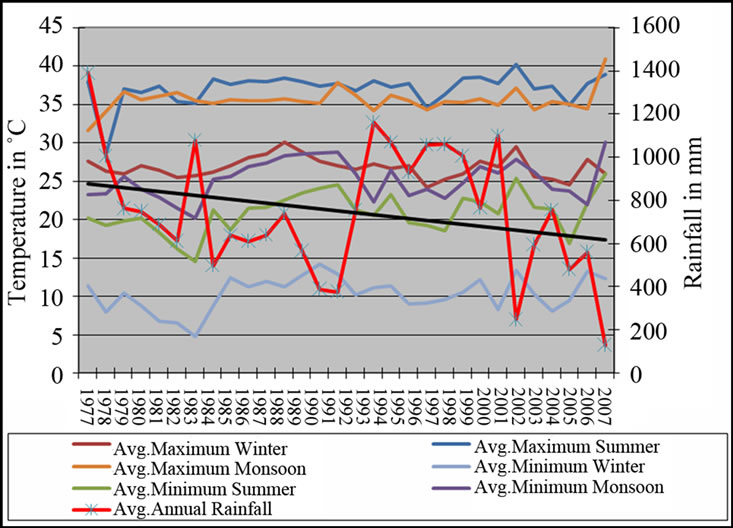
Figure 2. Trends in average annual maximum and minimum temperatures and average annual rainfall (1977- 2007).
and monsoon seasons have increased by 0.03˚C and 0.32˚C respectively. Minimum night time temperature also exhibits increasing trend by 0.03˚C, 0.20˚C and 0.23˚C during winter, summer and monsoon seasons respectively.
The study area experiences generally dry weather except during the southwest monsoon season. i.e. June to September. The rains are erratic and so is the distribution of the rainfall. The average annual rainfall is 689.2 mm, with approximately 35 rainy days on average in a year. The rainfall data analysis indicates a significant variation in average annual rainfall as shown by zig-zag trend of 1977-2007 period. The maximum and minimum rainfall recorded is 1390 mm in 1977 and 247 mm in 2002. The standard deviation of annual rainfall is about 288 mm with a coefficient of variation of 37.062% with a total decline of 269 mm.
4.1. Land use/Land Cover Analysis (1989-1998-2009)
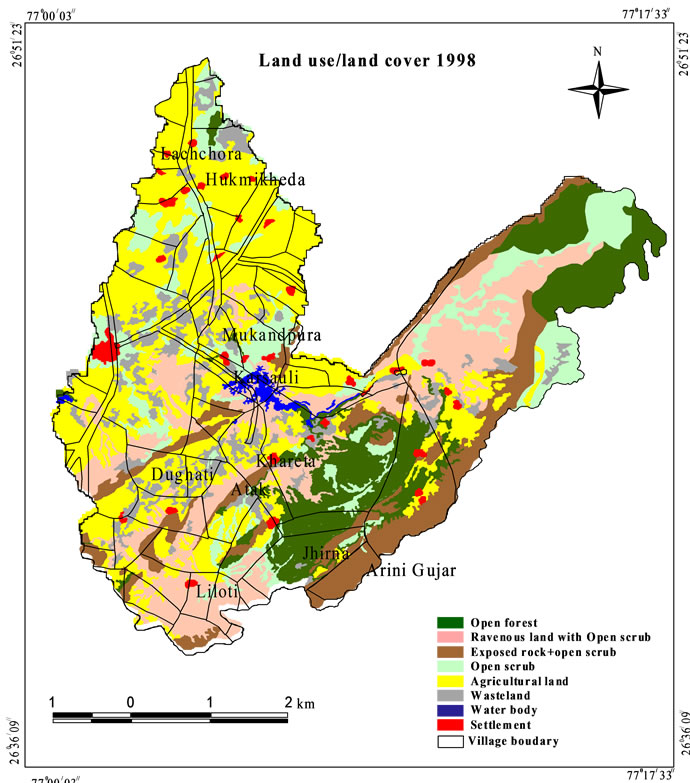
Eight major classes of land use/land cover were identified and delineated on the satellite data on the basis of photographic and geotechnical elements, which includes open forest, ravenous land with open scrub, open scrub, agricultural land, wasteland, exposed rock, water body and built-up land. Area statistic of major land-cover categories have been calculated for the year 1989, 1998 and 2009 (Table 1). Comparative analysis has shown significant changes in land-cover during 1989 to 1998 and 1998 to 2009 period.
Comparative analysis of Land use/land cover for the years 1989, 1998 & 2009 results show decrease of agricultural land as the most prominent change signifying land degradation. Besides reduction in areal extent, open forests also exhibits progressive degradation and depletion of vegetative cover. Rill erosion and gully erosion is active in the area, a principle forms of water erosion, suggesting a gradual increase in the efficiency of the fluvial process. This has led to the development pf ravenous land. Jaggar watershed has lost 5% of its forest cover in two decades. In the year1989 area under open forest was 5290 ha (14.99%) which decreased to 4998 ha (14.19%) in1998 and further shrunk to 3360 ha (9.52%) by the year 2009. Area under open scrub has increased from 2460 ha (6.97%) in 1989 to 4655 ha (13%) in 1998 to 6778 ha (19%) in 2009. Agricultural land in the watershed has decreased from 18050 ha (51%) in 1989 to 12026 ha (34.2%) in 1998 which has further gone down to 10468 ha (29.65%) 2009. Water body has considerably shrunk from the 411 ha (1.16 %) in 1989, 302 (0.85%) in the year 1998 to 095 ha (0.2%) in 2009.
4.2. Village Level Household Survey
The ten villages which were selected for conducting household surveys includes Khareta, Lachchoda, Hukmikheda, Karsauli, Liloti, Jhirna, Atak, Arini Gujjar, Dughati and Mukandpura. Through the questionnaires details on the socio-economic status of the family, agriculture land owned, sources of income, crops grown and change in cropping pattern, if any, availability of water and fuel wood, source of irrigation, signs of land becoming unproductive etc. were recorded in all of the villages.
Apart from household surveys, Group discussion and Participatory rural appraisal (PRA) techniques were also
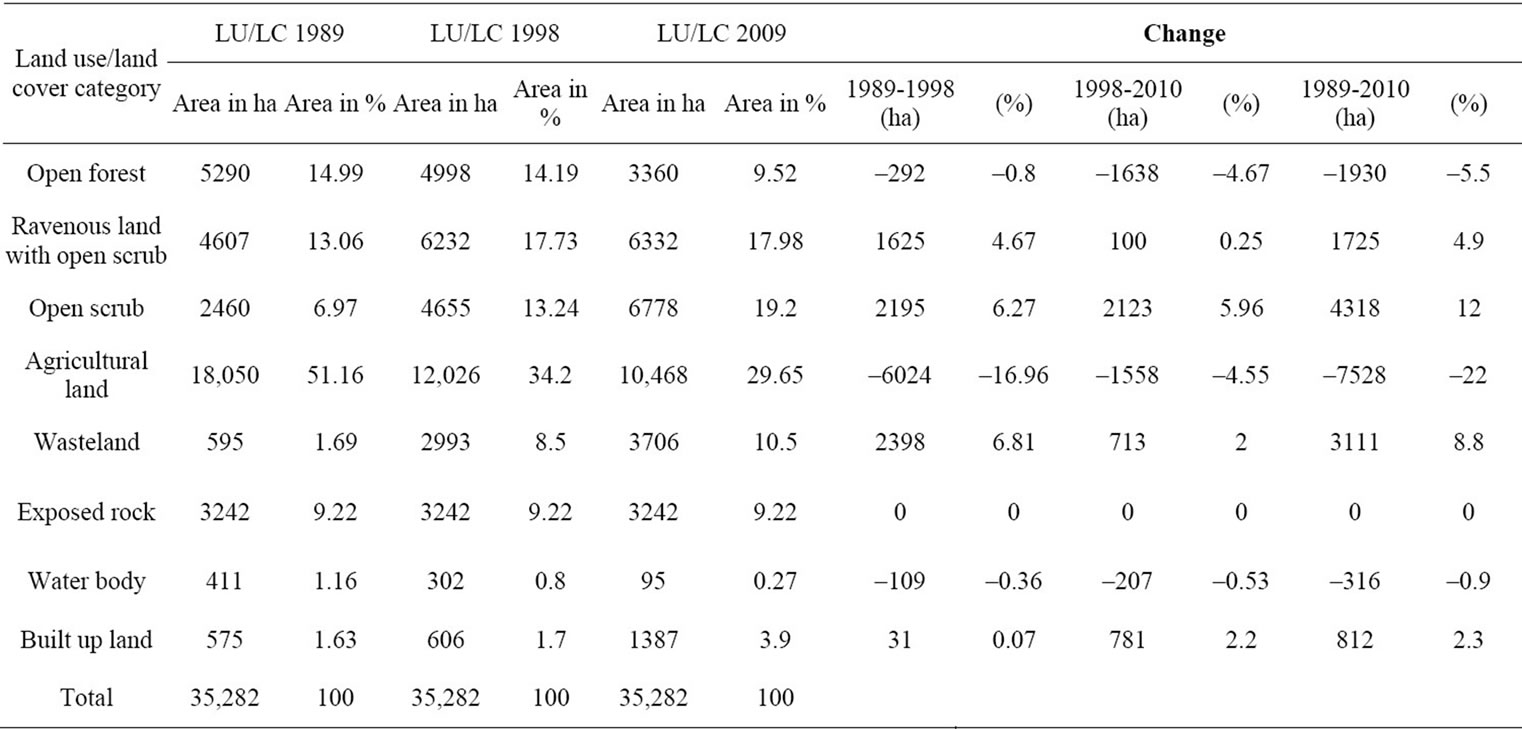
Table 1. Land use/land cover changes in the Jaggar Watershed during 1989-1998-2010.
adopted at village level to record the people’s perceptions and their experiences in terms of the climatic trends and weather changes during the last 2 - 3 decades, crops grown and shift in cropping pattern, availability of groundwater over the years etc.
Information related to their socio-economic status and agriculture was collected to correlate it with the changing climate. As far their economic condition is concerned, survey reveals that about half the population have annual income of less than 35,000 (740.66 USD) to 45,000 (952.27 USD). Only 54% of population annual has got income of greater than 45,000 (952.27 USD). Fuel wood (75%) is the major source for cooking which people collect from jungle on an average walking distance of about 2 - 5 km away from their villages. 15% - 20% of people use fuel wood as well dung cake whereas only 5% - 9% people use LPG and stove. Average land holing size is 6.5 bighas (4.40 ha).
4.3. Agriculture: Facts and Figures
The common crops grown in the area comprise sesame, mustard seeds, wheat and pearl millet which require less water. However, wheat is grown where sufficient water is available for irrigation. Agriculture production in the villages has declined by approximately 35% due to frequently occurring drought, decreased rainfall and gradually falling water table. Farmers having even large land holdings i.e. 33 - 54 ha of land are unable to produce good output due to scarcity of water for irrigation. People have stopped growing pigeon pea, lentils (pulses), sugarcane-water intensive crop and have switched to sesame seeds, pearl millet, mustard, gram and wheat (Table 2).
Various sources of irrigation include canals (37.66%), Tube wells (Electrified as well as non electrified) accounts for 26.47%, and Wells which accounts for 35.87%. Percentage of irrigated land is very much high against the rain fed land (Figure 3). The rate of expansion of irrigated land is the most important determinant of water stress, at least the stress related to quantity [24]. This is leading to over exploitation & over consumption of ground water, without the ground water being recharged by rain water harvesting or any other technique. Increase in irrigated land because of less of rainfall is evident from the declined water table over the years (Figure 4).
4.4. Participatory Rural Appraisal (PRA) and Group Discussion
PRA and Group discussion at village level are necessary field methods to assess the ground realities that has actually influenced the living conditions of the villagers. Villages that are far off from the Jaggar dam, like Dughati, Atak and Liloti face acute shortage of water for drinking as well as for irrigation purpose.
Acute water shortage has been observed in four villages in recent past namely Atak, Dughati, Hukmikheda and Liloti. A number of deaths have been reported from
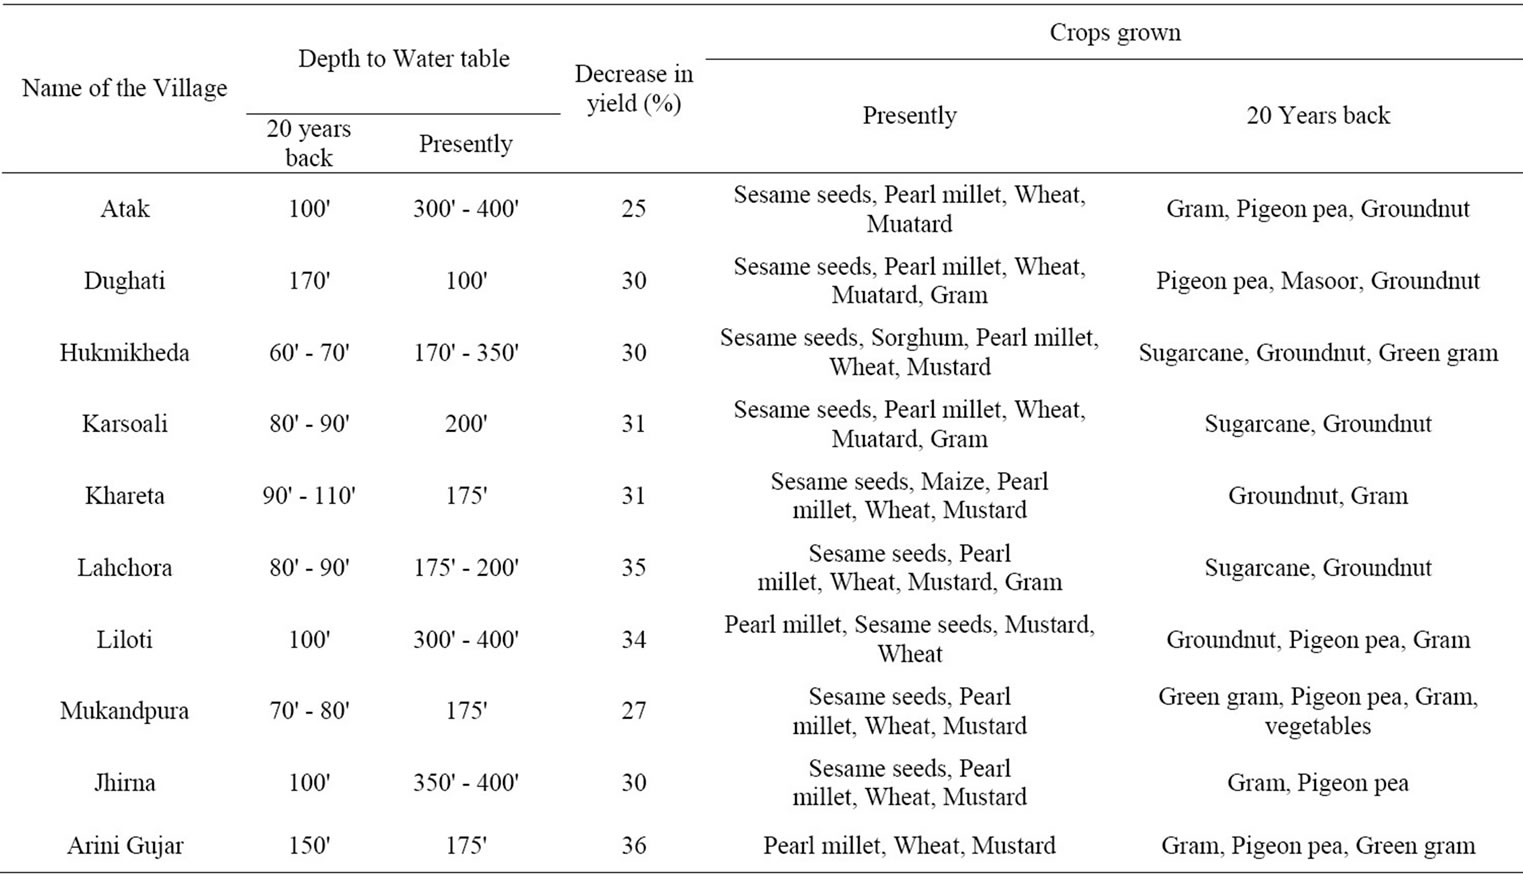
Table 2. Status of water table, change in crop yield and crop pattern.
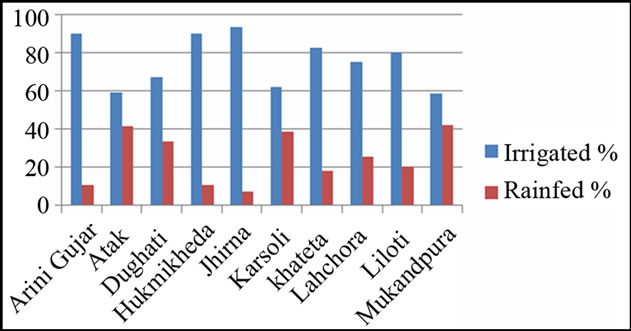
Figure 3. Percentage of irrigated and rain-fed land in surveyed village.
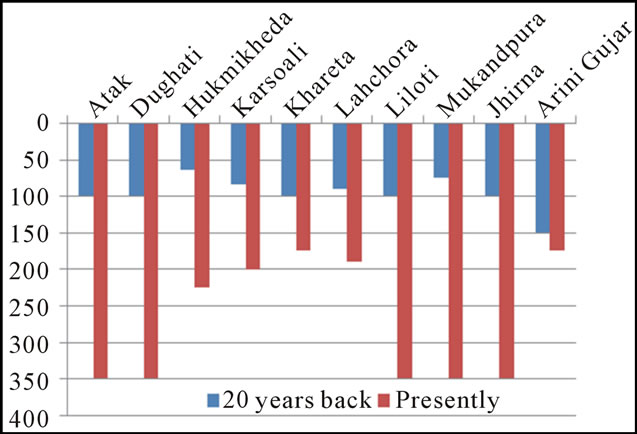
Figure 4. Decline in depth of water table in last 20 years last 20 yea (feet below ground level).
Atak because of thirst and contminated water. In Dughati village, agriculture yield has decreased by 30% due to unavailability of water for irrigation. In Hukmikheda, water tankers reach village for general supply but here casteism and favouritism prevails which restrain lower caste people from availing the facility.
The water table in the watershed has continuously declined by 1 - 2 m on annual basis coupled with significant drawdown condition. Groundwater is tapped for both drinking water supply and irrigation purposes by means of dug wells, tube-wells and dug-cum-bore (DCB) wells. Another important issue that hampers cultivation is that area is prone to water logging. Water seepages from canal aggravate the condition. It has been reported by the local people that Jaggar dam was last filled to its capacity 1997 after that it has never seen its capacity even half full.
The permissible works under National Rural Employment Guarantee Act, (NAREGA) includewater conservation and water harvesting; drought proofing; micro irrigation; provision of irrigation facility to land owned by private owners; renovation of traditional water bodies; land development; flood control and protection; rural connectivity and any other activity approved by Ministry of Rural Development (MRD). Largely complaints have been lodged about the discrepancies in the payment of wages, people in Jaggar watershed of Hindaun tehsil are getting wages as low as  35 (0.70 USD) and highest is
  75(1.5 USD) as against
  100 fixed by the government. Many farmers also reported that they got their name registered in muster roll, but they never get the opportunity to work as Gram sarpanch (head of the village appointed by State government) favours upper caste people making poor people poorer. It is largely the Jatavs followed by the Minas and Gujjar community who predominantly own job cards. Since agriculture produce is decreasing because of less rainfall and lack of irrigation facility, people are forced rather willing to work under NAREGA.
4.5. Land Use/Land Cover Change (1998-2009) at Village Level
In addition to the village level survey, land use/land cover changes at the village level were analysed using 1998 and 2009 satellite data. Attempt has been made to correlate the climatic changes taken place in the study area with the LU/LC changes at village level. The satellite data analysis of 1998 and 2009 has been given in Table 3, where a change under each LU/LC category has been computed, and the details are presented in the next section. Figure 5 presents Land use/land cover maps of 1989, 1998 and 2009.
4.5.1. Agricultural Land
Agricultural land has decreased from 47.90 ha to 33.12 ha in Lahchoda, 862.90 ha to 793.88 ha in Hukmikheda, 124.33 ha to 99.68 ha in Mukandpura, 278.71 ha to 140.50 ha in Khareta, 101.64 to 77.12 ha in Karsauli, 154.03 ha to 100 ha in Dughati, 105.90 ha to 89.05 ha in Liloti, 189.38 ha to 76.05 ha in Atak, 10.59 ha to 6.08 ha in Arini Gujjar, 37.70 to 25.96 ha in Jhirna. Decrease in agricultural lnd has been observed in every village due to decline in rainfall making agriculture land unproductive. Increased gully erosion is also responsible for conversion of patches of agricultural land into wasteland. Decline in water table is another reason which has affected agriculture land leading to shrinkage in its area.
4.5.2. Open Forest
The area under open forest has decreased by 7.51 ha in Karsauli and by 52 ha in Jhirna villages. The other villages do not have open forest. The decrease in area under open forest can be attributed to anthropogenic activities, livestock pressure and change in climate. The generally high temperatures and low precipitation has led to the depletion of vegetation cover. Open forest has progressively become thinner and less continuous in the last decade because of anthropogenic activities including population pressure.
Villagers generally uses fuel wood for cooking purpose,
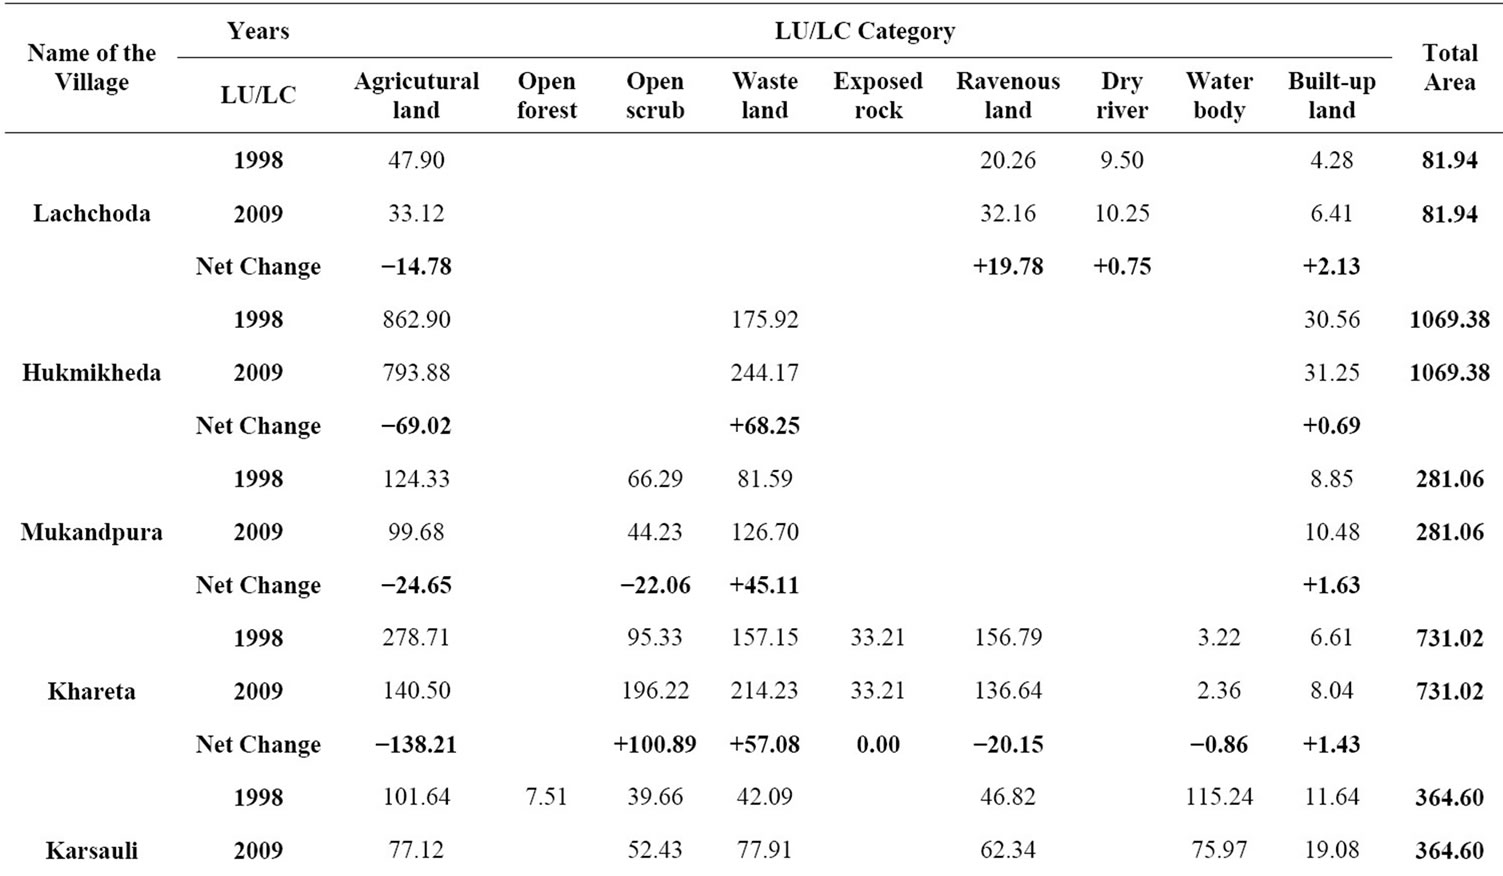
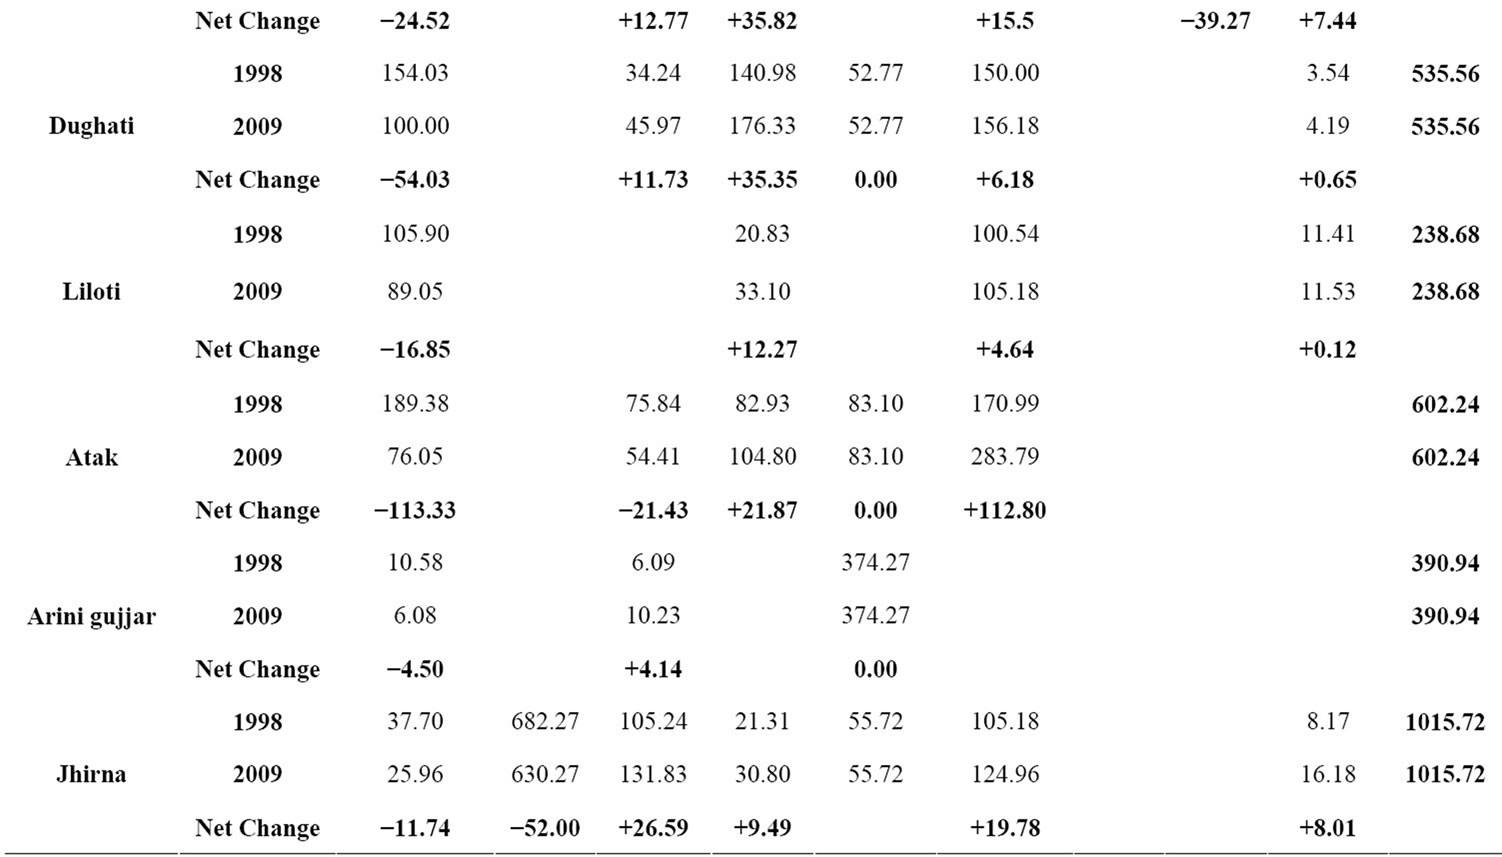
Table 3. Village level land use/land cover changes (1998-2009).
and unrestricted cutting of wood is also responsible for forest depletion and degradation.
4.5.3. Open Scrub
Area under open scrub shows an increase by 26.59 ha in Jhirna, 4.14 ha in Arini Gujjar, 11.73 in Dughati, 12.77 ha in Karsauli, 100.89 in Khareta. Increase in area under open scrub is primarily due to the plantation activities and natural growth of vegetation on ravenous land. Open scrub is mostly reported from ravenous land.
 (a)
(a)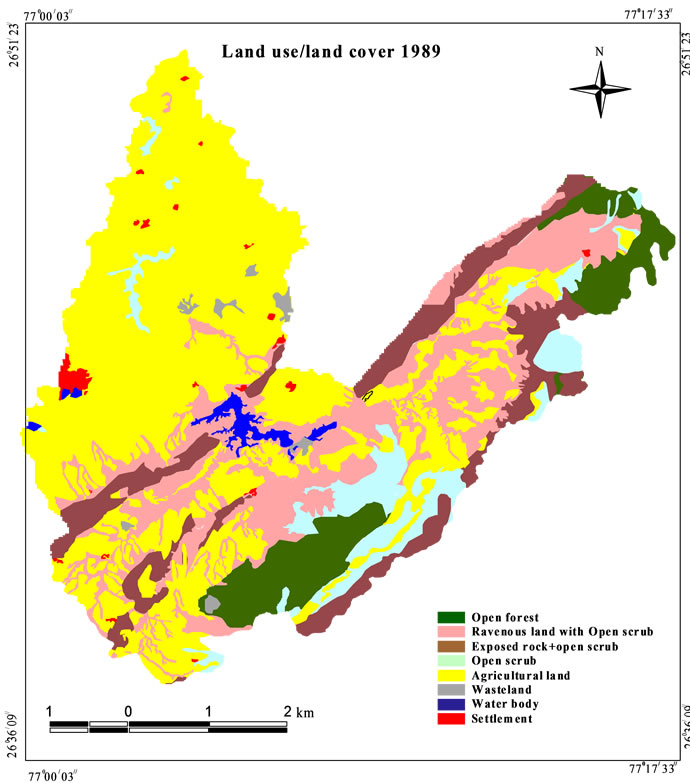 (b)
(b)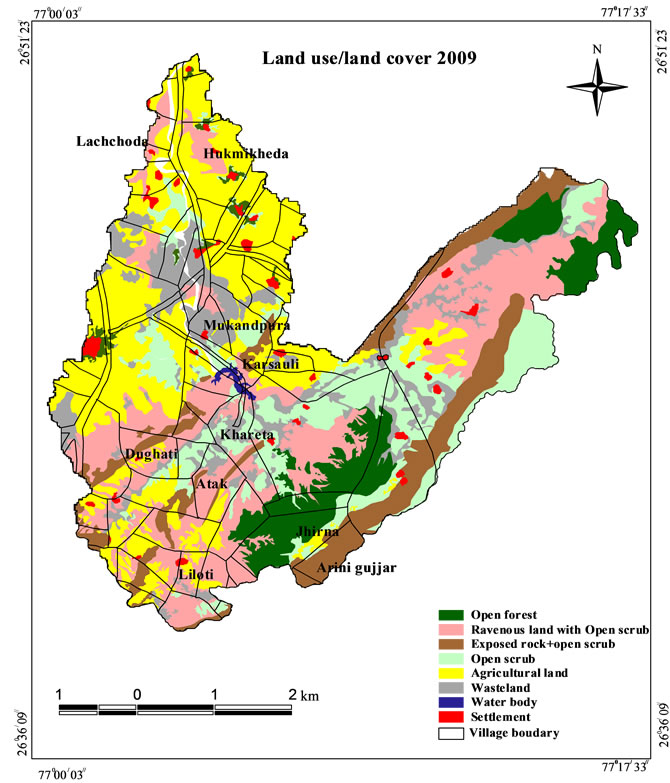 (c)
(c)
Figure 5. Land use/land cover map of the Jaggar Watershed of (a) 1989 (b) 1998 and (c) 2009 with village boundaries.
Decrease in open scrub has been observed in Mukandpura by 22.06 ha, 21.03 ha in Atak, because of overgrazing leading to formation of wasteland.
4.5.4. Wasteland
The area under wasteland has seen an increase in almost all the villages. It has increased by 68.25 ha in Hukmikheda, 45.11 ha in Mukandpura, 57.05 ha in Khareta, 35.82 ha in Karsauli, 35.35 ha in Dughati, 12.27 ha in Liloti, 21.85 ha in Atak, 9.49 ha in Jhirna due to combination of natural and anthropogenic factors. Natural factors such as decline in rainfall, loss of vegetation, top soil erosion have contributed to increase in wasteland area. Human induced activities such as overgrazing, land becoming fallow for years, clearing of vegetation for fuel wood also contributed increase in the wasteland area.
Satellite data also reveals that wasteland has generally developed in adjoining area of ravenous land where slope is moderately steep to steep which probably triggered the erosion of sandy upland.
4.5.5. Ravenous Land
Area under ravenous land has increased by 11.90 ha in Lachchoda, 20.15 ha in Khareta, 15.52 ha in Karsauli, 6.18 ha in Dughati, 4.64 ha in Liloti, 111.28 ha in Atak and 19.78 ha in Jhirna.
It is characterized by undulating topography, loose and sandy-to-sandy loam soil type which makes it vulnerable to formation of deep ravines. The ravines present along the streams/river make inroads into the nearby lands with every monsoon. Excessive soil erosion has led to the extension of ravenous land in nearby areas.
4.5.6. Water Body
Area under surface water body decreased by 3.22 ha in Khareta and 39.27 ha in Kasrauli due to general decline in annual rainfall which results in small water bodies such as ponds getting dried up, besides the reservoir of Jaggar dam has also been dried up in 2009.
5. Conclusions
The results of the study presented here clearly suggest significant role of climate change impacting availability of natural resources at watershed level, in the state of Rajasthan. The satellite data analysis further proves that land that land use/land cover changes that have taken place in the watershed are the result of climatic changes and anthropogenic activities. The major land cover changes in ten villages of the watershed a short period of 12 years suggest the rapid climatic conditions.
Out of ten villages, Atak and Dughati villages have been found the most water stressed and vulnerable. Depth to water table in both the villages has gone down to 350 feet. People of Dughati village also have no drinking water facility and has to fetch water from far off places. Losses in agriculture produces have worsened the socio-economic condition of the people. Water has become a rare commodity in these two villages and the most affected are women and children who generally spend 4 - 6 hours daily on collection of water.
The study also assessed the vulnerability of the local communities due to climate change. The field village level surveys suggest that people especially farmers are the most vulnerable groups who face extreme difficulties for their livelihood. Due to decline in water level, ever rising temperatures and declining soil fertility, the crop production has been affected considerably. Moreover shift in cropping pattern is reported from almost all the villages of the watershed, which clearly suggest rapid climatic changes not suitable for the crops which were grown 20 - 30 years back, as a result farmers are forced to shift to new crops which fetch less market value resulting in economic losses to the farmers.
6. Acknowledgements
The financial support received from University Grants Commission (UGC), New Delhi under Major Research Project 33-49/2007 (SR) to the senior author is thankfully acknowledged. Thanks are also due to the Chairman, Department of Geology, A.M.U, Aligarh for providing necessary infrastructure facilities. Sincere thanks to Society for Sustainable development, Karauli, for assisting in household surveys in the study area. Thanks are also due to Subha Rais and Sana Iftekhar for their help in data generation and analysis.
REFERENCES
- E. F. Lambin, H. J. Geist and E. Lepers, “Dynamics of Land-Use and Land-Cover Change in Tropical Regions,” Annual Review of Environment and Resources, Vol. 28, 2003, pp. 205-241. doi:10.1146/annurev.energy.28.050302.105459
- O. E. Sala, F. S. Chapin, J. J. Armesto, E. Berlow, J. Bloomfield, R. Dirzo, E. Huber-Sanwald, L. F. Huenneke, R. B. Jackson, A. Kinzig, R. Leemans, D. M. Lodge, H. A. Mooney, M. Oesterheld, N. L. Poff, M. T. Sykes, B. H. Walker, M. Walker and D. H. Wall, “Biodiversity: Global Biodiversity Scenarios for the Year 2100,” Science, Vol. 287, No. 5459, 2000, pp. 1770-1774. doi:10.1126/science.287.5459.1770
- T. N. Chase, R. A. Pielke, T. G. F. Kittel, R. R. Nemani and S. W. Running, “Simulated Impacts of Historical Land Cover Changes on Global Climate in Northern Winter,” Climate Dynamics, Vol. 16, No. 2-3, 1999, pp. 93- 105. doi:10.1007/s003820050007
- R. A. Houghton, J. L. Hackler and K. T. Lawrence, “The US Carbon Budget: Contribution from Land-Use Change,” Science, Vol. 285, No. 5427, 1999, pp. 574-578. doi:10.1126/science.285.5427.574
- M. K. Tolba and O. A. El-Kholy, (Eds.), “The World Environment 1972-1992,” Two Decades of Challenge, Chapman & Hall, London, 1992.
- P. M. Vitousek, H. A. Mooney, J. Lubchenco and J. M. Melillo, “Human Domination of Earth’s Ecosystems,” Science, Vol. 277, No. 5325, 1997, pp. 494-499. doi:10.1126/science.277.5325.494
- B. S. Bisht and P. C. Tiwari, “Land-Use Planning for Sustainable Resource Development in Kumaun Lesser Himalaya—A Study of the Gomti Watershed,” International Journal of Sustainable Development and World Ecology, Vol. 3, No. 4, 1996, pp. 23-34. doi:10.1080/13504509609469932
- H. Eswaran, R. Lal and P. F. Reich, “Responses to Land Degradation,” Proceedings of 2nd International Conference on Land Degradation and Desertification, Khon Kaen, Thailand, Oxford Press, New Delhi, 2001, pp. 1-6.
- M. V. K. Sivakumar and R. Stefanski, “Climate and Land Degradation—An Overview,” In: Climate and Land Degradation, Springer-Verlag Berlin Heidelberg, 2007, pp. 105-135. doi:10.1007/978-3-540-72438-4_6
- F. H. Beinroth, H. Eswaran, P. F. Reich and E. Van Den Berg, “Land Related Stresses,” In: S. M. Virmani, J. C. Katyal, H. Eswaran and I. P. Abrol, Eds., Stressed Ecosystems and Sustainable Agriculture, Oxford and IBH, New Delhi, 1994.
- R. Lal, “Tillage Effects on Soil Degradation, Soil Resilience, Soil Quality, and Sustainability,” Soil Tillage Research, Vol. 27, No. 1-4, 1994, pp. 1-8. doi:10.1016/0167-1987(93)90059-X
- Q. Zhou, B. Li and A. Kurban, “Trajectory Analysis of Land Covers Change in arid Environment of China,” International Journal of Remote Sensing, Vol. 29, No. 4, 2008, pp. 1093-1107. doi:10.1080/01431160701355256
- S. Archer, D. Schimel and E. Holland, “Mechanisms of Shrubland Expansion: Land Use, Climate, or CO2?” Climatic Change, Vol. 29, No. 1, 1995, pp. 91-99. doi:10.1007/BF01091640
- C. J. Tucker and S. E. Nicholson, “Variations in the Size of the Sahara Desert from 1980 to 1997,” Ambio, Vol. 28, 1999, pp. 587-591.
- R. Lal, G. F. Hall and P. Miller, “Soil Degradation: I. Basic Processes,” Land Degradation & Rehabilitation, Vol. 1, No. 1, 1989, pp. 51-69. doi:10.1002/ldr.3400010106
- P. Coppin, I. Jonckheere, K. Nackerts and B. Muys, “Digital Change Detection Methods in Ecosystem Monitoring: A Review,” International Journal of Remote Sensing, Vol. 10, 2004, pp. 1565-1596. doi:10.1080/0143116031000101675
- T. R. Loveland, T. L. Sohl, S. L. V. Stehman, A. L. Gallant, K. L. Sayler and D. E. Napton, “A Strategy for Estimating the Rates of Recent United States Land-Cover Changes,” Photogrammetric Engineering & Remote Sensing, Vol. 68, 2002, pp. 1091-1099.
- R. S. Lunetta, R. Alvarez, C. M. Edmonds, J. G. Lyon, C. D. Elvidge and R. Bonifaz, “An Assessment of NALC/ Mexico Land-Cover Mapping Results: Implications for Assessing Landscape Change,” International Journal of Remote Sensing, Vol. 23, No. 16, 2002, p. 3129. doi:10.1080/01431160110071888
- C. Homer, C. Huang, L. Yang, B. Wylie and M. Coan, “Development of a National Land Cover Database for the United States,” Photogrammetric Engineering & Remote Sensing, Vol. 70, 2001, pp. 829-840.
- G. Xian and M. Crane, “Assessments of Urban Growth in the Tampa Bay Watershed Using Remote Sensing Data,” Remote Sensing of Environment, Vol. 97, No. 2, 2005, pp. 203-215. doi:10.1016/j.rse.2005.04.017
- B. S. Bisht and B. P. Kothiyari, “Land-Cover Change Analysis of Garur-Ganga Watershed Using GIS/Remote Sensing Technique,” Journal of the Indian Society of Remote Sensing, Vol. 29, No. 3, 2001, pp. 137-141. doi:10.1007/BF02989925
- Sharma, et al., “Land Use/Land Cover Change through Remote Sensing and Its Climatatic Implications in the Godavari Delta Region,” Journal of Indian Society of Remote Sensing, Vol. 29, No. 1-2, 2001, pp. 85-91.
- J. Akram, M. Y. Khanday and A. Rizwan, “Prioritization of Sub-Watersheds Based on Morphometric and Land Use Analysis Using Remote Sensing and GIS Techniques,” Journal of Indian Society of Remote Sensing, Vol. 37, No. 2, 2009, pp. 261-274. doi:10.1007/s12524-009-0016-8
- W. J. Cosgrove and F. R. Rijsberman, “World Water Vision: Making Water Everybody’s Business,” World Water Council, Earthscan Publications Ltd., London, 2000.