Natural Science
Vol.06 No.16(2014), Article ID:51270,5 pages
10.4236/ns.2014.616114
A New 3D Surface Profile Measuring System Based on the Telescope and Webcam
Ming-Hung Chiu*, Yen-Hsin Chen, Jian-Ming Su
Department of Electro-Optical Engineering, National Formosa University, Taiwan
Email: *mhchiu@nfu.edu.tw
Copyright © 2014 by authors and Scientific Research Publishing Inc.
This work is licensed under the Creative Commons Attribution International License (CC BY).
http://creativecommons.org/licenses/by/4.0/


Received 17 September 2014; revised 28 September 2014; accepted 12 October 2014
ABSTRACT
We propose a simple telescope with three-dimensional image capability for surface profile measurements. Our method based on the algorithm of reflectivity-height transformation is applied to a traditional commercial telescope with a webcam for determining the third dimension of the test object. It is also useful for thickness, deformation, and surface profile measurements.
Keywords:
Telescope, Three-Dimensional Measurement, Reflectivity, CCD, Webcam, Surface Profile

1. Introduction
In recent decades, telescopes have not undergone any major variations in their structures or applications. A picture from a telescope can be taken by a camera. We can take a picture in two-dimensional (2D) but not in three- dimensional (3D) format. In this paper, we propose a new telescope that has the ability to show and plot a 3D image for long distance surface profile measurements. The method is based on the reflectivity-height transformation, including the internal reflection effect [1] of a prism and the principles of the first-order optics. The difference of intensity or reflectance is proportional to the object distance and the deviation angle of the light. We have previously proposed 3D profilometers for both the transmission [2] and reflection [3] types, but they were applied for measuring smooth surface profiles of small areas or for use with a microscope. The method had been demonstrated and used in biological measurements [4] . The main structure of our 3D telescope combines a commercial telescope with a webcam and a parallelogram prism. These components are inexpensive and can be easily acquired. The experimental results of several coins have shown that the error percentage of thickness can be less than 4% for a telescope with a magnification of 25× and a measuring distance of 10 m. It will be applicable for remote measurements in the future.
2. Method: Reflectivity-Height Transformation
When a parallelogram prism made of BK7 with the base angle of 45˚ is used to be an angular sensor to sense the angle deviation of the object light, the light passing through it with twice internal reflections. n1 and n2 are the indices of refraction of the prism and air respectively. Assume that n2 = 1.000 and n1 = 1.517 (the average wavelength λ = 550 nm), and the range of external incident angle θ = 0˚ - 10˚. The simulation results of the reflectivities of the s- and p-polarized lights are shown in Figure 1(a), where Rs2 and Rp2 are represented the reflectivities of twice internal reflection of the s- and p-polarized lights, respectively. Apparently, the change in the reflectivity of the p-polarized light (dotted line) close to the critical angle is more sensitive than that of the s- polarized light (solid line) close to the critical angel.
Regarding objects with a large change in height, we can prefer to select the s-polarized light as the light source because of its larger angle measurement range. Convert the practical measured curve into coordinates, where the x-coordinate is converted to RS2, y-coordinate is converted to θ, and convert the angle θ to be the function of RS2, as shown in Figure 1(b).
From Figure 1(a), the change of  will result in the change of Rs2; on the contrary, we can derive the change of
  from the change of Rs2, as shown in Figure 1(b). As a result, we receive the images from the webcam to record the light intensities of the incident angles close to the critical angle and the total reflection (TIR) respectively, and then use Matlab software to overlap the two images and calculate the reflectivity Rs2. When the interval of the two points of the object is
 , the reflection lights are projected into the parallelogram prism and then passed via a telescope to form the image on the webcam; the interval of the two points of the formed image correspond to
  is
is![]() . If we take
. If we take ![]() as the interval of the adjacent two pixels of the webcam, we can derive
as the interval of the adjacent two pixels of the webcam, we can derive ![]() via the optical magnifying power. As shown in Figure 2, the two points have different heights, and the tilt angle is
via the optical magnifying power. As shown in Figure 2, the two points have different heights, and the tilt angle is![]() ; thus, the difference in the reflection angles of the two points is
; thus, the difference in the reflection angles of the two points is![]() ; if
; if ![]() is very small, the height difference between the two points can be expressed as:
is very small, the height difference between the two points can be expressed as:
![]() , (1)
, (1)
If we can acquire the reflectivity difference Rs2 of the two points after imaging and calculate ![]() via the function shown in Figure 1(b), we can derive
via the function shown in Figure 1(b), we can derive ![]() via the optical magnifying power
via the optical magnifying power![]() .
.
As  and
and , we can substitute them into Equation (1). The height difference can be rewritten as
 , (2)
, (2)
where  is a constant and if the tilt angle α is very small, i.e.
 , then
  can be written as
 ,
, we can integrate them into the Equation (2), thus the surface height could be given as
 , (3)
, (3)
where h0 is the initial height.
3. Experimental Results
The system structure of the experiment is shown in Figure 3, and the object to be tested (1) is placed right in front of the telescope. The light source used in the experiment is a fluorescent lamp (2) (the average wavelength = 550 nm). When the object is placed far away from the system, it can be considered a parallel light, which will pass through device (3) (Polarizer). The transmission axis of the polarizer should be adjusted to 90 degrees to make sure that all received lights are the s-polarized lights. Afterward, the beam passes through device (4) (filter plate) and only green lights with specific wavelengths can pass through device (4). Next, device (5) (parallelogram prism) is rotated by device (6) (rotation platform) until the angle of device (5) reaches the TIR angle and critical angle that is needed. Then, we can conduct observation using device (7) (telescope). Finally, we use device (8) (the image capturing unit, such as a webcam, or CCD) to capture images of the TIR and the critical angle, and then process and analyze them by device (9) (personal computer (PC) with Matlab software) to calculate the reflectivity Rs2 and h, where DRs2 ≒ dRs2 can be considered the reflectivity difference of the adjacent pixels and dX can be considered the interval of the adjacent pixels. According to Equation (3), the surface height of object can be calculated and the 3D surface profile can be plotted.

 (a) (b)
Figure 1. (a) A simulation of the changes of the reflectivities of the twice internal reflections of the p- and s-polarized lights to the external angle; (b) The practical measured equation and relation curve of external angle θ versus reflectivity Rs2 after the coordinates converted.
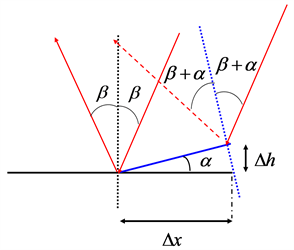
Figure 2. When the tilt angle of two adjacent points on the object is α, the change in the reflection angle will be 2α.

Figure 3. System structure diagram.
In order to measure more accurate 3D surface profiles, we need to use a green filter plate to perform the measurement. As described above, after we perform curve fitting for obtaining the external incident angle , we can finally obtain the 3D surface profile of the object. In one of our experiments, two objects to be tested together are a key and an Australian coin and they are away from the system by 10 m. First, we measure the width and thickness of the samples using a vernier caliper. The width of the key is 18.99 mm and its thickness is 1.72 mm; the width of the Australian coin is 23.6 mm and its thickness is 1.7 mm. Figure 4(a) shows the 3D surface profiles of the key and the Australian coin; the height of the higher part is about 2.09 mm and the height of the lower part (recession) is about 1.13 mm, as shown in Figure 4(b), and the length of the key is about 53.62 mm. The points marked in Figure 4(a) are the heights of the human portrait or the words protruding from the surface of the coin and the recession of the object to be tested. These show that the heights of point A, B, C, D, are 1.13, 2.22, 2.26 and 1.248 mm, respectively.
In addition to the above experiment, we also performed experiments on other coins to make sure the proposed method is feasible and to find out the average error range. We compared the average thickness with the measurement results of the vernier caliper. The measurement results of the vernier caliper serve as the reference values. The error of the thickness is about 0.07 mm and the average error percentage is 4%. According to first- order optics approximation, as the measurement distance of the structure is 10 m, the f-number is 5.346, and the diameter of telescope is 52 mm, the corresponding depth of field is 31 mm, the object range that we measured cannot exceed the limit [5] .
4. Discussions
The definition of the sensitivity S is written as
 (4)
(4)
∂RS is the reflectivity change corresponding to the micro height change. The highest sensitivity and the lowest sensitivity with a measurement range of 5.8˚ - 8.5˚ When the external angle is 5.8˚, we find that the highest sensitivity S = 0.41 (change/mm); when the external angle is 8.5˚, we find that the lowest sensitivity S = 0.07 (change/mm).
Vertical resolution means the minimal surface height which the system can discriminate. Where S is the sensitivity,  is the minimal reflectivity change which the CCD can discriminate, and the expression method of the gray level value of the CCD is 0 - 255, for 8 bits A/D converter, the vertical resolution can be defined by the following equation
 (5)
(5)
The vertical resolution of the system is shown in Figure 5; when the external angle is 7.2˚, the vertical resolution is 33.73 µm.
The light source is an indoor fluorescent lamp, so the experiment does not need to be conducted in a dark room. Thus, we not only need to consider the stability of the power of the fluorescent lamp, but we also need to consider whether the system receives light from other sources in order to be aware of any measurement errors. Regarding the stability of the light source, we use the power meter to continuously measure the stability of fluorescent lamp, as shown in Figure 6:
As shown in Figure 6, the number of the sampling points of the x-coordinate is 400, and the sampling frequency is 0.25 times per second; the power unit of the y-coordinate is μW. We can see the average optical power of the fluorescent lamp is 134.7 μW, and its swaying quantity is about ±0.06 μW. Therefore, we know that the swaying quantity of the fluorescent lamp is about 0.04%. For using the 8 bits A/D converter, the CCD’s gray level is in the region of 0 - 255, the minimal discriminable change is about 0.4%. As the light intensity change of the fluorescent lamp is lower than 0.4%, it will not influence the best light intensity resolution of the CCD; accordingly, we can let .
.
Lateral resolution means the minimal discriminable interval. According to the Rayleigh Criterion,  , where
  is the distance of the target to be measured, and
  is the aperture of the telescope (or the effective light collection of the system). Accordingly, we know that the lateral resolution is determined by the measurement distance
  and the aperture
 . When we increase the measurement distance, the minimal discriminable distance will increase; in other words, the lateral resolution will be reduced. On the other
 (a)
(a) (b)
(b)
Figure 4. (a) The 3D surface profiles of the key and the Australian coin; (b) The height diagram of the key and the Australian coin.

Figure 5. A curve diagram of the vertical resolution in response to the external angle change.
hand, if the effective light collection aperture is smaller, the minimal discriminable distance will also increase and the lateral resolution will be reduced. If we want to improve the lateral resolution, we can use a telescope with a bigger aperture; that is to say, we increase to improve the lateral resolution. With the telescope that we currently use, D = 52 mm, the measurement distance is 10 m, and the lateral resolution is 0.13 mm.
5. Conclusion
This experiment adopts the angle deviation method by using the parallelogram prism, common telescope and webcam to measure the 3D surface profiles of coins with a thickness of several millimeters at a 10 m distance. The error percentage is about 4%. According to reflectivity-height transformation, this method converts the reflectivity into the height of the object point by point, and then acquires its 3D surface profile in real time. Thus, the device can be used for remotely monitoring or detecting the change of the surface profile. Examples include measuring a change in topography with aerial photos, monitoring dangerous or inaccessible environments, ob-

Figure 6. A stability diagram of the power of the fluorescent lamp as measured by the power meter.
serving the cracks or deformation of buildings, investigating soil flows or floods, and remote testing for other purposes.
Acknowledgements
This study was supported in part by the National Science Council of Taiwan with contract number NSC 100- 2221-E-150-067-MY2.
References
- Born, M. and Wolf, E. (1999) Principles of Optics. 7th Edition, University of Cambridge, Cambridge, 38-52. http://dx.doi.org/10.1017/CBO9781139644181
- Tan, C.T., Chan, Y.S., Lin, Z.C. and Chiu, M.H. (2011) Angle-Deviation Optical Profilometer. Chinese Optics Letters, 9, Article ID: 011201. http://www.opticsinfobase.org/col/abstract.cfm?uri=col-9-1-011201
- Tan, C.T., Chan, Y.S., Chen, J.A., Liao, T.C. and Chiu, M.H. (2011) Non-Scanning, Non-Interferometric, Three-Di- mendional Optical Profilometer with Nanometer Resolution. Chinese Optics Letters, 9, Article ID: 101202. http://www.col.org.cn/abstract.aspx?id=COL201109101202-03
- Chiu, M.H., Tan, C.T., Lee, T.S. and Lee, J.C. (2013) Non-Scanning Three Dimensional Optical Microscope Based on the Reflectivity-Height Transformation for Biological Measurements. Microscopy & Microanalysis, 19, 425-432. http://dx.doi.org/10.1017/S1431927612014365
- Greivenkamp, J.E. (2004) Field Guide to Geometrical Optics. 1st Edition, SPIE Press, Bellingham, 35-36. http://dx.doi.org/10.1117/3.547461.p35
NOTES

*Corresponding author.