Natural Science
Vol.6 No.14(2014), Article
ID:49751,20
pages
DOI:10.4236/ns.2014.614104
Sea Surface Temperature Anomaly and Precipitation Distribution in the Alagoas State of the Brazilian Northeast
I. Kulikova1, N. Fedorova2, V. Levit2, E. S. Cordeiro2
1Hydrometeorological Research Centre of the Russian Federation, Moscow, Russia
2Institute of Atmospheric Science, Federal University of Alagoas, Maceió, Brazil
Email: nataliabras@gmail.com
Copyright © 2014 by authors and Scientific Research Publishing Inc.
This work is licensed under the Creative Commons Attribution International License (CC BY).
http://creativecommons.org/licenses/by/4.0/


Received 30 June 2014; revised 26 July 2014; accepted 12 August 2014
ABSTRACT
Precipitation data of 17 pluviometrical stations in the Alagoas State of the Brazilian Northeast and global spatial distribution of the Sea Surface Temperature Anomaly (SSTA) were analyzed for the period of 1981-2007. Techniques of constructing composite charts for SSTA fields are used to study the interrelation between the ocean thermal state with precipitation more than 50 mm/24 h, 20 mm/24 h or without precipitation for six ambient regions of the state. The student test is used for estimating statistical characteristics of the composites. Synoptic-scale pattern analyses of the composites reveal strikingly different spatial distribution of SSTA within each composite. The El Niño Southern Oscillation cycle refers to the coherent, large-scale fluctuation of ocean temperatures. At the highest ambient regions during heavy precipitation days, more intensive SSTA was observed. The lowest anomalies were observed for all types of precipitation in the semi-arid region. Quantile analyses of NCEP/NCAR indexes of SSTA distribution, such as NATL, SATL, TROP and RNASA were used too. Positive SSTA values in tropical regions are associated with the highest possibility of precipitation formation. The SST interhemispheric north-south gradient in equatorial regions of the North and South Atlantic has direct influence on the precipitation formation in the Alagoas State.
Keywords:Precipitation, Brazilian Northeast, Sea Surface Temperature Anomaly, SST Interhemispheric Gradient

1. Introduction
Agriculture and stock-breeding are the economic basis of the Alagoas State (Brazilian Northeast-BNE), and their productivity depends on precipitation distribution and frequency. Three regions with different types of precipitation patterns in BNE are described [1] : 1) the northern region with a humid period between February and May, 2) the southern region with a humid period between November and February and 3) the coastal region with a rainy season from April to July. The Alagoas State is in the coastal region.
There are some variations of the rainy season in the coastal region [2] [3] . The rainy season in the coastal region is generally during May-July (precipitation ≥ 150 mm per month) or April-August (precipitation ≥ 100 mm per month).
Cases of intense precipitation in the Alagoas State commonly occurred during the autumn/winter season and also in January, when half of all spring/summer intense precipitation events occurred [3] .
Precipitation spatial distribution in Alagoas showed the existence of two different regions: the semi-arid region in the west (500 - 700 mm per year) and a moist region along the coast and northeast (2000 mm per year) [3] -[5] . Precipitation variations throughout Alagoas during the rainy period (April-August) in 2003-2006 are presented in Figure 1.
Spatial and temporal precipitation characteristics make their diagnosis and forecast extremely complicated. The mechanisms of a precipitation formation and its evolution are related to the dynamic and thermodynamic aspects of atmospheric processes that interact from the large scale down to the cloud microphysics scale [6] . Hydrodynamic modeling involves the processes of convection, condensation, non-adiabaticheating, super saturation, flow humidity, etc. Quantitative precipitation forecast is one of the most formidable challenges in hydrometeorology, primarily because of their dependence on a large spectrum of time and space scales of atmospheric motions (from micro to macro).
The principal mechanisms of rain formation [1] in the northern region are the Intertropical Convergence Zone (ITCZ), breezes and also wave disturbance in the trade winds (WDTW) [7] [8] . A stationary frontal system is the principal system of precipitation formation in the southern region [9] . Precipitation in the coastal region is formed due to sea breeze circulation [5] , ITCZ, WDTW [1] [3] , the Upper Tropospheric Cyclonic Vortex (UTCV) [10] and the western edge of a frontal cloud band [3] [11] [12] .
The basic mechanisms of the precipitation formation in the coastal region will now be discussed in more detail. The influence of UTCV on precipitation formation in BNE was described in [10] . This system was mentioned as the most important mechanism of precipitation formation in BNE. An ascendant movement and precipitation formation at the UTCV periphery and descendent movement with clear skies at the UTCV center were shown. The highest UTCV frequencies were registered in the summer with the maximum being in January [10] . UTCVs were observed throughout the year, except July, and 63% of them were associated with Jet Stream in the BNE (JSBNE) [13] . UTCVs during the summer of the El Niño years (1982-1983, 1988-1989) were more intensive and deep than in La Niña years (1984-1985, 1988-1989) according to Ramirez’s information [14] . An influence during La Niña or El Niño years on UTCV variability was not observed by Ramirez [14] or Repinaldo [15] .
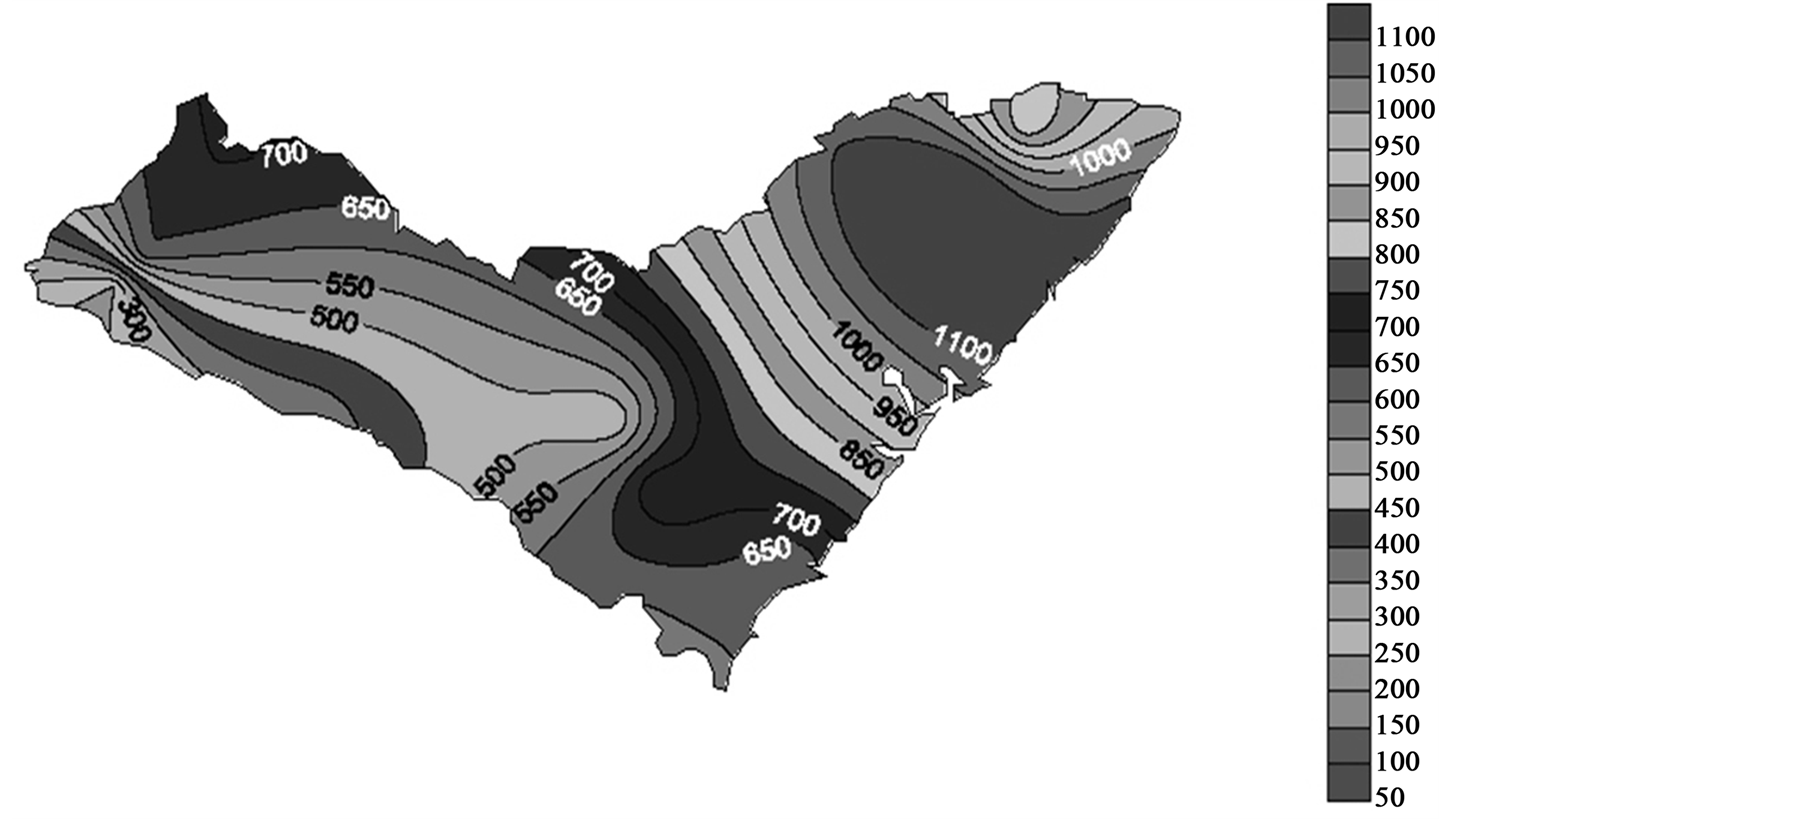
Figure 1. Precipitation distribution in Alagoas State during rainy period 2003-2006. Source: Pontes da Silva et al. 2008.
The ITCZ is localized on average between 0˚ and 10˚N near the BNE region and does not have a direct influence on precipitation in Alagoas [16] [17] . The ITCZ arrives at its southernmost position in the equatorial South Atlantic in March-April [18] . At the same time, when cloudiness moves from the ITCZ to the south and reaches Alagoas, it creates intense precipitation events. Cloudiness frequency decreases more quickly from the Equator to a latitude of 20˚S in the western part of the continent than in other regions of South America [19] . This decrease was greater in El Niño years than in La Niña ones. The quantity of cloudless days or days with little cloudiness at 20˚S latitude was identical in the La Niña and El Niño years. Negative rainfall anomalies during March, April and May are related to an early withdrawal of the ITCZ toward the warm SST anomalies over the northern tropical Atlantic [20] .
Easterly Waves (EW) or wave-like disturbances in the tropical easterlies have the structure of a warm-core barotropic low. High level jet steam is associated with EW and moves westward with the trade winds. EW reached the coastal region of BNE and provoked precipitation [21] .
Frontal zone influences are regular in the southern region of NEB [5] . The western edge of a frontal cloud band passes through Alagoas very rarely; 2 - 5 events per year were observed from 2004 to 2006 [11] and have direct influence on the weather condition. Cold front occurrences within 20˚ - 40˚S latitudes were greater during El Niño than during La Niña years (in active phases of these phenomena) [22] .
Convection development on FE was detected and described by Kousky e Ferreira [23] , Oliveira [24] over South America and was analyzed over Alagoas by Veber [12] . Frontal intensity is the principal factor for convection development. Unification of FE and thermal trough in BNE create a stable cloudy band with intensive convection development, Oliveira [24] .
New observational technology of time and space high-resolution (satellite and radar observations) has revealed an ordered meso-scale structure in the precipitation field associated with the wave disturbance in the trade wind (WDTW) and a meso-scale convective complex (MCC).
Baric troughs in the BNE region were associated with WDTW on the northwestern periphery of the subtropical South Atlantic High in 87% of events [25] . WDTW are formed due to confluence of FE and trade winds. The maximum trough frequency occurred at low levels during the wetter and colder season (June and July). These troughs were connected with meteorological phenomena in a stable (for example, fog and stratus clouds) and unstable (for example, cumulonimbus) atmosphere.
The MCC term is generally used to denote large (size > 200 km) cumulonimbus clusters of an almost circular shape and a duration of more than 6 h [26] . During the active period of their life cycle, MCC generates a lot of adverse weather phenomena such as intense rain fall, catastrophic wind gusts and thunderstorms. Meso scale Convective Complexes were also connected with the most storm activity in the Alagoas State [3] . Detail analysis of MCC events with intensive rain has been presented in many papers, for example, Alves et al. [27] . Physical and morphological characteristics of all MCC during four years were analyzed by Fedorova et al. [28] . MCC were formed in WDTV and low level trough. MCC duration was 11 h an average, diameter varieties was between 200 and 900 km and MCC area was 190,000 km2 an average.
Other examples of the meso scale processes, which are associated with rain fall in the coastal regions of BNE are the instability lines and breezes [29] .
There is a wide class of motions that can be attributed to induced oscillations in the atmosphere. This class includes the flow caused by a permanent agent, localized in space. The role of this agent in the atmosphere is mainly that of relief. The inland region of BNE (Agreste region) has some different mechanisms of precipitation formation because of relief influence. Air current from the East is raised over mountains and precipitation in the coastal region is formed. The same air current falls on the other side of the mountains and create almost desertlike conditions in the Sertao region of BNE. Also, air current from the east is colder than in the Sertao region and therefore it is drier.
Thus, atmospheric processes of a different scale, including processes of the large-scale atmospheric circulation (ITCZ), synoptic processes (Easterly Waves, Frontal zone) and meso-scaled is turbances such as WDTW, MCC, instability lines and breezes are involved in the precipitation field’s formation in the coastal regions of BNE.
Synoptic oscillations with period sofa few days have maximum kinetic energy. However, cascade energy transfer occurs in the high frequency range. In contrast, energy transfer in the reverse direction to the flows of the general atmospheric circulation appears in the low frequency range, according to the law of the quasi-twodimensional macro-turbulence. The interaction of the scales is very difficult to describe mathematically. As noted in [30] , extreme precipitation from mesoscale precipitating systems, which can often be embedded in synoptic systems, are influenced by large scale conditions and are, in turn, influenced by climate variability. The tropical and extra-tropical large scale climate variability, connected with the thermal condition of the ocean, is mentioned in a lot of research. One of the main parameters characterizing the ocean influence on the atmosphere is the sea surface temperature (SST). The anomalies of the sea surface temperature (SSTA) are indicators not only of internal ocean dynamics but also of the climatic system at large.
Rainfall in BNE exhibits annual variations related to the anomalous patterns of global atmospheric circulation associated with El Nino Southern Oscillation (ENSO) [31] . The influence of Sea Surface Temperature (SST) in the Pacific Ocean on the amount of annual precipitation in the BNE was investigated by Lima and Moura et al. [32] -[34] . The El Niño Southern Oscillation (ENSO) provoked precipitation with a lower climatological average and La Niña events are associated with rain of a higher climatological average [1] [35] [36] . According to Alves [37] , ENSO has affected precipitation accumulation only in the Northern region of NEB and this influence is more intensive during the rainy period (February-March). ENSO influence was not confirmed in the eastern coastal BNE region (Alagoas and Sergipe States) and did not provoke significant precipitation variation. A connection between Sea Surface Temperature Anomaly (SSTA) in the Pacific east and precipitation in the northern BNE (Fortaleza) on a decadal scale could be a response to Niño-3 on the annual scale [38] .
Decadal Oscillation in the Pacific (DOP) was described by Mantua et al. [39] as a variation of SSTA between the Pacific tropical and extratropical regions. A cold phase of the DOP is characterized by negative SSTA in the Pacific tropical region and positive SSTA in the Pacific extra tropical region in the both hemispheres in the Northern and Southern Pacific. The last cold phase of the DOP was observed between 1948 and 1976. A warm phase of the DOP is associated with positive SSTA in the Pacific tropical region and negative SSTA in the extra tropical region. The last warm phase of the DOP was registered between 1977 and 1998. Siqueira [40] has shown that ENOS produced different impacts in NEB during cold or warm phases of the DOP.
Annual variation of precipitation in the BNE was also modulated by SSTA in the tropical Atlantic Ocean. The dominant modes of SST on the annual variation scale feature an inter hemispheric north-south gradient mode during the austral autumn [7] [20] . SST gradient influences the ITCZ latitudinal position [20] . The southward SST gradient relates to wetter than normal conditions in NEB and the northward SST gradient is associated with drier than normal conditions [7] [20] .
Rainfall variability over the eastern Amazon and BNE in the austral autumn rainy season during twenty years (1982-2001) was examined in [41] . The combined effect of the inter hemispheric SST gradient of both the Pacific and Atlantic Oceans was studied. A simultaneous manifestation of El Niño in the Pacific Ocean and a relatively weak northward SST gradient in the inter tropical Atlantic Ocean were associated with unfavorable conditions for precipitation. La Niña in the Pacific Ocean and a southward SST gradient in the Atlantic Ocean were combined with favorable conditions. According to [42] , the sea surface temperature gradient between the northern and southern tropical Atlantic appears to be the more important influence, though El Niño can be dominant when it is strong.
Precipitation information from other states around Alagoas was used to obtain results of rainfall variability in principal investigations of precipitation in the NEB. For example, the rain-gauge stations (27 stations in the BNE) used for study by [43] were not located in the Alagoas State.
According to [44] , the strongest impact on the frequency of extreme events in the rainy season of the BNE occurs in March of El Niño and in April of La Niña episodes. That conclusion is true for the BNE region as a whole. Meanwhile, significant impact on the Alagoas region was not observed.
The Folland et al. [42] results demonstrate that northeastern Brazil is a region where two separate ocean basins influence seasonal climate to a comparable extent. Also, precipitation anomalies over the southern and northern parts of the BNE are out of phase: drought years over the northern part are commonly preceded by wetter years over the southern part, and vice versa [20] . The Alagoas state is localized between the northern and southern part of the BNE. Therefore, these conclusions did not relate to the study region in this paper.
A connection between SSTA global distribution and precipitation in the various environmental regions of the Alagoas State has not been studied until now. Therefore, the main goal of this paper was to study precipitation frequencies and distribution in environmental regions and also to link them to the SSTA global distribution. Standard techniques of constructing and estimating statistical characteristics of composite charts for SSTA fields are used to study the interrelation between the Oceans thermal state and the precipitations variations. Quantile analysis of the NCEP/NCAR indexes of SSTA distribution in the Atlantic was also used.
2. Data Source and Methodology
The study period was between January 1981 and December 2007 (26 years). A negative phase of Atlantic Multidecadal Oscillation (AMO) was observed in the study period until 1995 and in the beginning of the positive AMO phase, which was the end of the study period (http://www.aoml.noaa.gov/phod/index.php).
2.1. Precipitation
Precipitation data were obtained from all (17) pluvio metrical stations in Alagoas by the DECEA/SEMARH-AL (Departamento de Controle do Espaço Aereo-DECEA, Diretoria de Meteorologia da Secretaria de Estado do Meio Ambiente e dos Recursos Hidricos de Alagoas) for the study period 1981-2007 (Figure 3). Precipitation with more than 50 and 20 mm/24 h, and also days without precipitation, were analyzed. The Alagoas state has six different environmentalregions: the Litoral is the coastal region; the Zona da Mata and Agreste are localized in the highest regions; the Sertao is the semi-arid region most distant from all water sources (the ocean, rivers); the Baixo Sao Francisco e Sertao do Sao Francisco are the regions along the river Sao Francisco ranging from the coast to the inland areas (Figure 2).
The Litoral region is located along the ocean coast and breezes have principal influence on that region. The Agreste is the highest region of Alagoas, with elevation up to 800 m and with the Atlantic Forest (Figure 3). An orographic influence is observed in that region. Therefore, these regions were chosen for special attention in the results section.
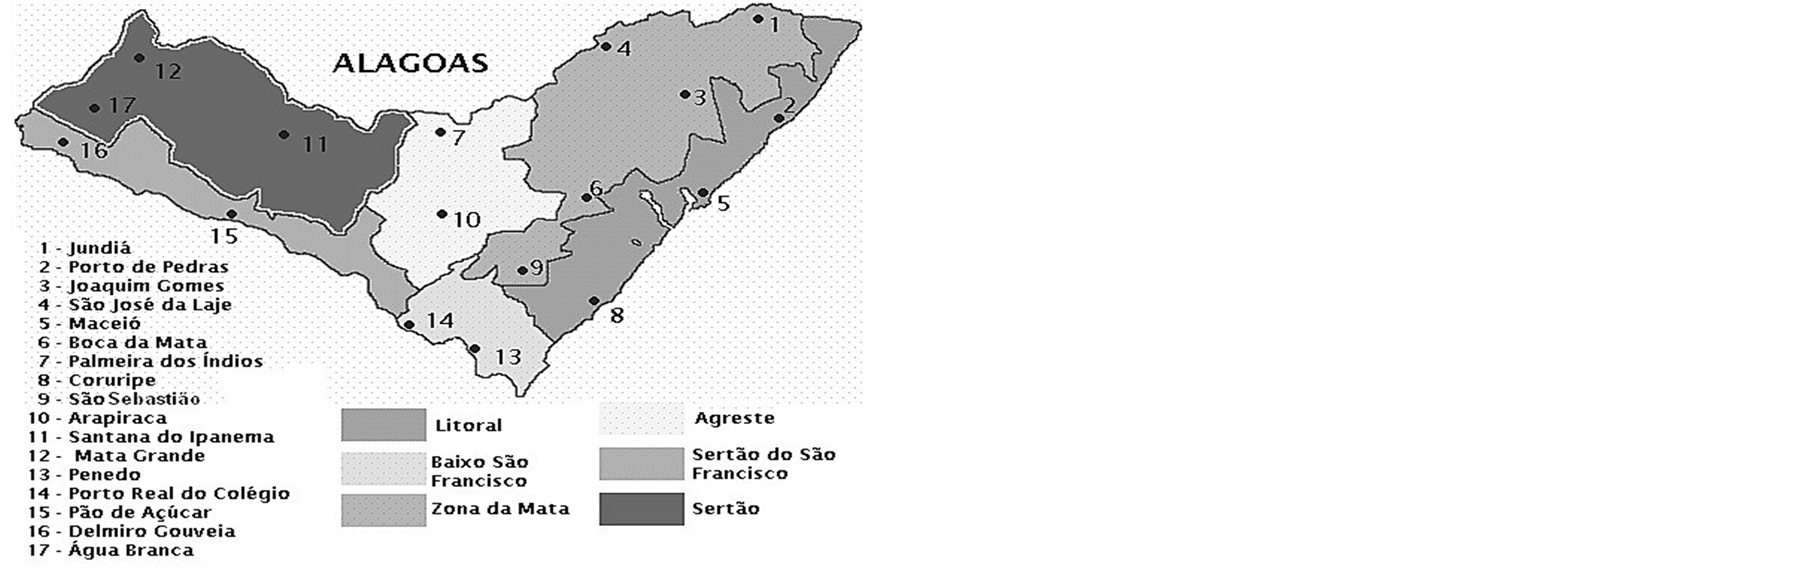
Figure 2. Alagoas State map with precipitation stations (points) and ambient regions (colour).
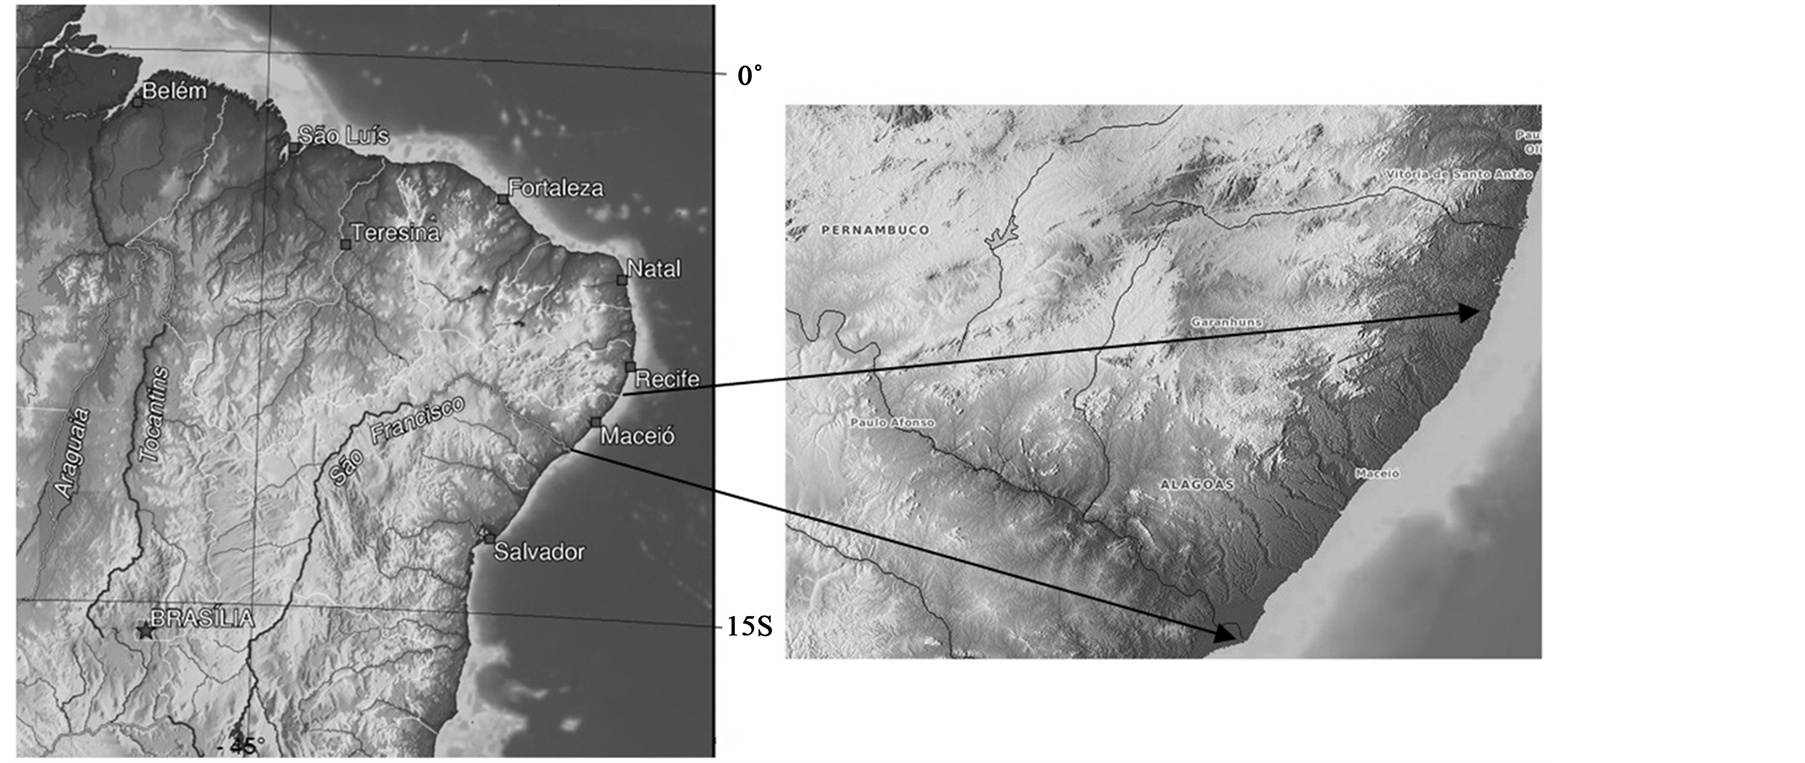 (a) (b)
Figure 3. Relief maps in BNE (a) and in the Alagoas State (b) Source: IBGE-Directory of Geoscience, Coordination of Cartography.
2.2. Sea Surface Temperature
Weekly SST fields at 1.0˚ ´ 1.0˚ on the grid as ocean thermal state characteristics were taken from the USA NCEP reanalysis archive [45] . For a convenient oceanic and atmospheric data comparison, all weekly means were interpolated to daily values by way of a procedure similar to that proposed in [46] . The SSTA are defined in relation to climatological values, calculated for every day over the period of 1981-2007. The SSTA statistical study for the global region is performed with the data stratification conditioned by definite precipitation classes that characterize anomalous or extreme precipitation in the following six regions: Litoral, Baixo Sao Francisco, Zona de Mata, Agreste, Sertao Sao Francisco and Sertao. The following comparison is made for precipitation: >50 mm/24 h, >20 mm/24 h and also without precipitation. Further analysis was focused upon the possible link between the composite anomalies of SST charts, constructed for each class and region separately, and the variability in precipitation distribution in the Alagoas State. The greatest advantage is that the results presented in a composite way contribute to the determination of the geographical influence on the SSTA distribution over the globe.
For comparing the anomaly of the thermal conditions in the tropical part of the Atlantic Ocean and the variability in precipitation distribution over the Alagoas State, SST indexes of NCEP/NOAA data were applied. See (http://www.cpc.ncep.noaa.gov/data/indices/sstoi.atl.indices). The SST indexes are: NATL—North Atlantic (5˚ - 20˚ North, 60˚ - 30˚ West), SATL—South Atlantic (0 - 20˚ South, 30˚ West - 10˚ East), TROP—Global Tropics (10˚ South - 10˚ North, 0 - 360), RNASA = NATL − SATL.
2.3. Statistical Analysis
2.3.1. SSTA Composite Significance Test
The Student test is used for the statistical analysis of the composites. It must be kept in mind that the data correspond to the period 1981-2007, and the Student test is applied to the significance estimation of a composite subsample of the volume n from the sample of the volume N for the general set, that have the means ( and
and ) and the variances (
![]() and
and ) respectively. As is known the Student Criterion is usually used for a large volume of samples (n > 30 cases) or if the distributions of the statistical ranking are close to the normal law of distribution. In this study, volume of the samples is sufficiently large, at least, for days with intensive precipitation (>20 mm) (Table 3). We examine the null hypothesis, that an observed sample mean
  has been drawn from a population centered at some previously specified mean,
 . Then the one-sample t-test [47] is:
 (1)
(1)
where ; t follows a distribution known as Student’s t, or simply the t distribution. The t distribution is controlled by a single parameter, called the number of degrees of freedom,
 ![]() , where n is the number of independent observations being averaged in the sample mean in the numerator.
, where n is the number of independent observations being averaged in the sample mean in the numerator.
Since the SSTA values are estimated, the  values equal zero (or close to zero). It is easy to obtain simplification of the formula, satisfactory for calculations, when large main sample volume N and small subsample volume n are addressed, corresponding to intensive precipitation situations:
 . The value n for various regions changes from 190 up to 1338 cases (see Table 3).
As is well known, statistical errors may be artificially underestimated due to a large time correlation (serial correlation), which in some ocean regions may remain significant for lags of a month and over [48] . Considering the serial correlations in the SSTA fields, let us take account of a variance inflation factor Willks:
 where
where —the lag-1 autocorrelation coefficient. The ratio
  acts as a variance inflation factor, adjusting the variance of the sampling distribution of the time average upward to reflect the influence of the serial correlation. Making some simple assumptions and given the fact that for lags of a day for the SSTA, autocorrelation coefficient usually exceeding the 0.8 - 0.9 values, we may assume a ten time underestimation of the sample variance.
The Student test for over 50 degrees of freedom changes only slightly. So for a double-sided test we will use the Student distribution 5%-point, which with the obtained degrees of freedom may be t = 2.0 (see Table32 in [49] ). This value as a threshold for the t-estimate given by the Formula (1) will be used.
2.3.2. Quantile Analysis of SST Indexes
One of the nonparametric methods of the determination of the degree of the value’s deviance is quantile analysis. This method of situation division, which is based on quantile analysis, is described in detail in [50] . Quantile analysis allows one to define two extreme levels “from above” and “from below”. These levels are defined with the help of 25% and 75% quantiles, which are represented as L and H, respectively, and their difference as  = H – L. The corresponding SST index values outside the interval (L, H) are identified as the lower and higher extremes. The value ∆ = H − L is called the span, which determines where 50% of the desired variation’s value is located.
3. Results
3.1. Heavy Precipitation > 50 mm/24 h
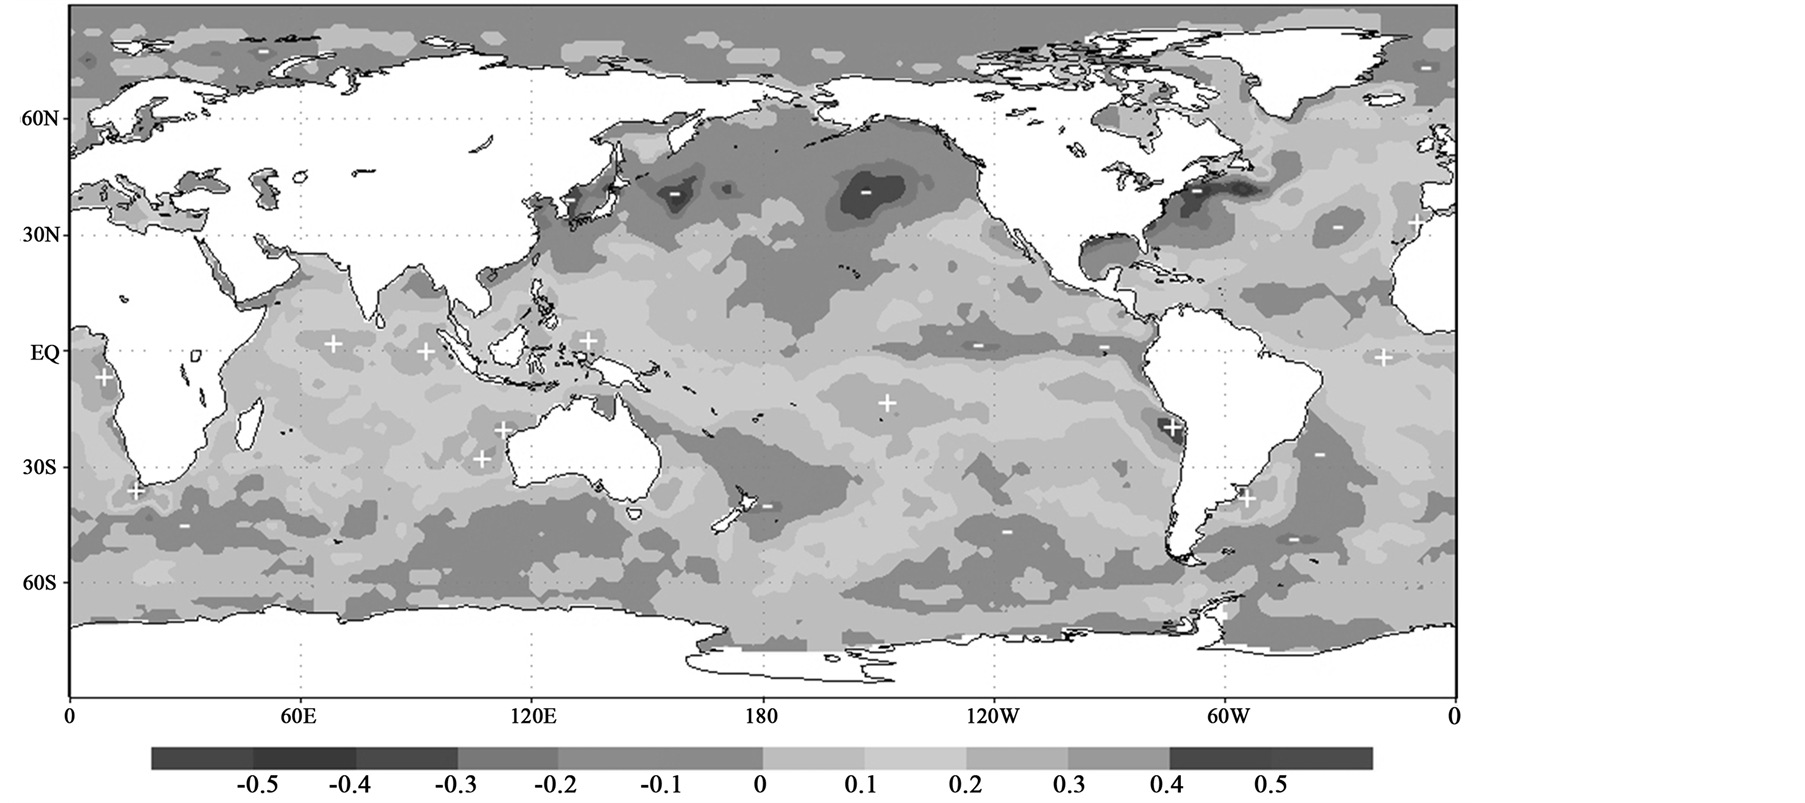
Heavy precipitation in all regions of Alagoas was accompanied by an increase in temperature contrasts between different parts of the world’s oceans (Figure 4). Sea Surface Temperature Anomaly (SSTA) maps show more intensive anomalies for days with heavy precipitation (>50 mm/24 h) in the Agreste region (Figure 4(f)). A characteristic feature is the presence of significant positive SSTA in the tropical latitudes of the western Pacific Ocean. Thus, a pronounced negative phase of the phenomenon La Niña was observed to the east of Alagoas (the regions Litoral, Baixo, Zona da Mata and Agreste).
The largest positive anomalies, up to 0.5˚C, are located over the South Atlantic, near southern Brazil and also near ocean currents on the Pacific Ocean in the Southern Hemisphere from Indonesia to South America, and in the Northern Hemisphere from the Philippines to North America. Negative anomalies up to −0.5˚C were registered in the “La Nina” region between the South American coast and 140˚W, on the extremity of the North and South Pacific, and over the South Indian Ocean. Positive anomaly over the tropical Pacific West and negative anomaly over the tropical Pacific East create the Walker Circulation intensification with more intensive vertical movements over the tropical region of the South America continent.
Similar anomalies were registered for heavy precipitation days in Zona da Mata and Baixo do Sao Francisco regions, but anomaly areas were fewer for heavy precipitation events in the Agreste region (Figure 4(d) and Figure 4(e)). For example, positive anomaly was not registered in the entire Northern Atlantic; it was concentrated near the African West coast, and between Greenland and the Canadian Northeast. Negative anomaly in “La Nina” region was less between the South American coast and 90˚ W.
Heavy precipitation in the Litoral region (Figure 4(b)) was associated with only one negative intensive (up to −0.5˚C) anomaly between the South American coast and 90˚W (Figure 4(b)). Positive anomalies were also observed near the African West coast, and between Greenland and the Canadian Northeast, with these anomaly areas being smaller than for all other regions, as described before.
Almost all heavy precipitation events were connected with Mesoscale Convective Complexes in the western region of the state (Sertao) [3] . Weak negative anomaly (up to −0.2˚C) near the South American Pacific coast was registered for the heavy precipitation events in the western Alagoan regions (Sertao and Sertao de São Francisco) (Figure 4(a) and Figure 4(c)). Other regions of negative anomaly in the North Pacific (160˚ E) and in the North Atlantic (60˚W) appeared for the Sertao events. Negative anomaly near North America in the North Pacific was similar to that of Baixo do Sao Francisco and Agreste regions.
Most of the North Atlantic waters, with the exception of the Gulf Stream, is occupied by positive SSTA. The positive SSTA were concentrated near the African West coast, and between Greenland and the Canadian Northeast. The area occupied by positive SSTA in the North Atlanticis less significant only for the Sertao region (Figure 4(a)). The negative SSTA are observed not only in the Gulf Stream, but also near 60˚N and even in the tropics for that region. Positive SSTA usually occupy tropical latitudes in the South Atlantic and negative anomalies occur in a large portion of the temperate latitudes. The zone of negative SSTA expands up to the
 (a)
(a)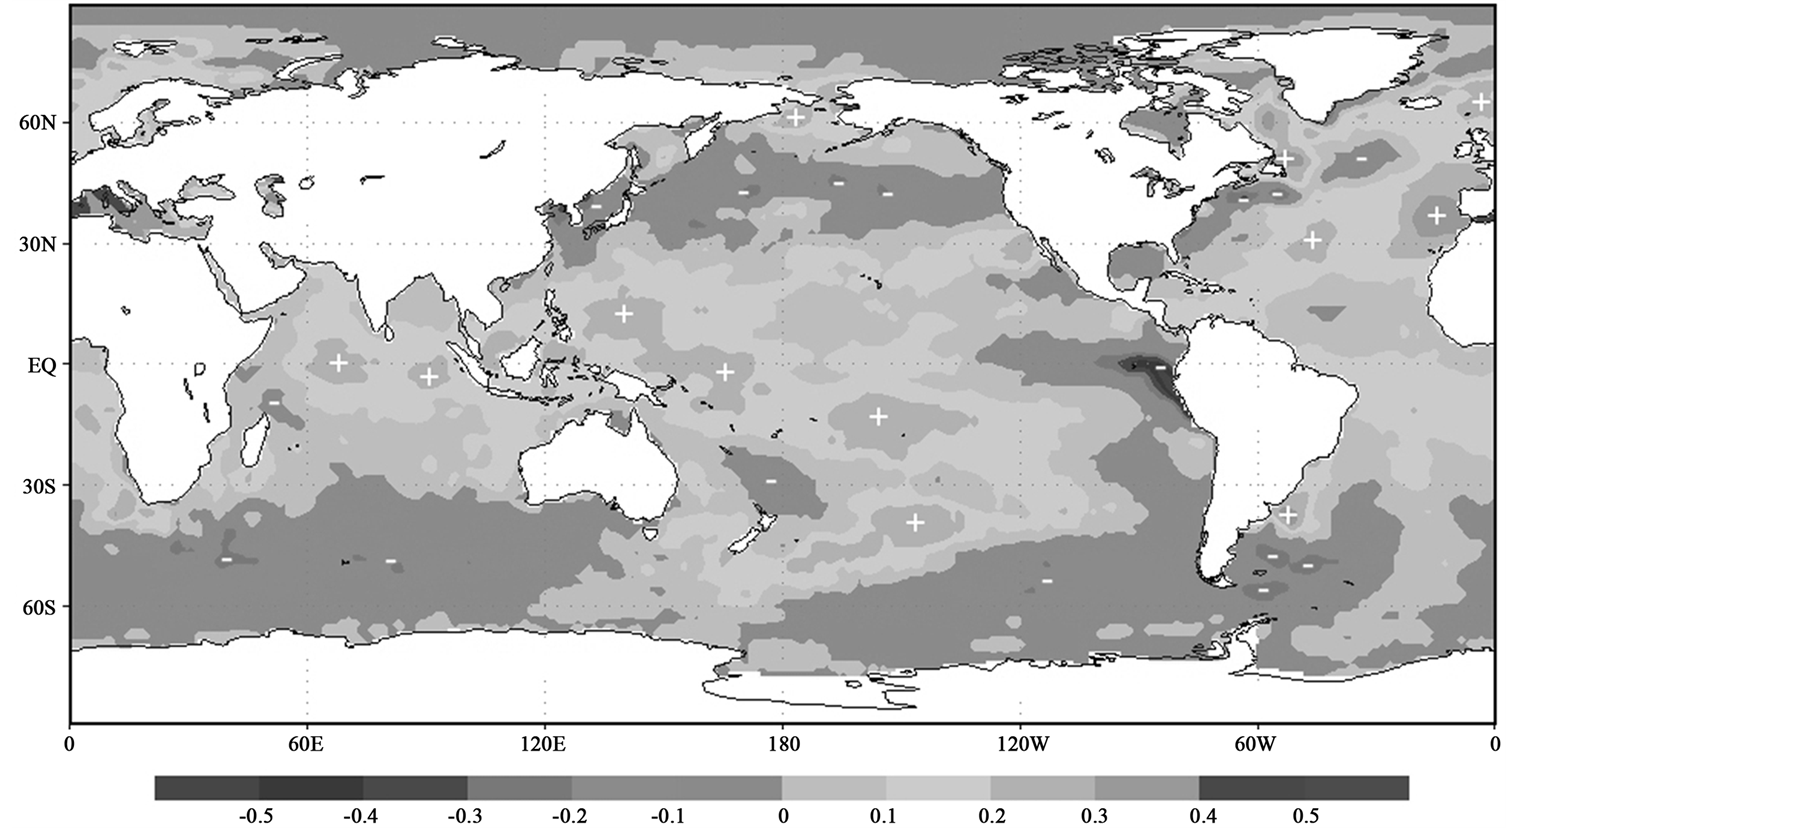 (b)
(b)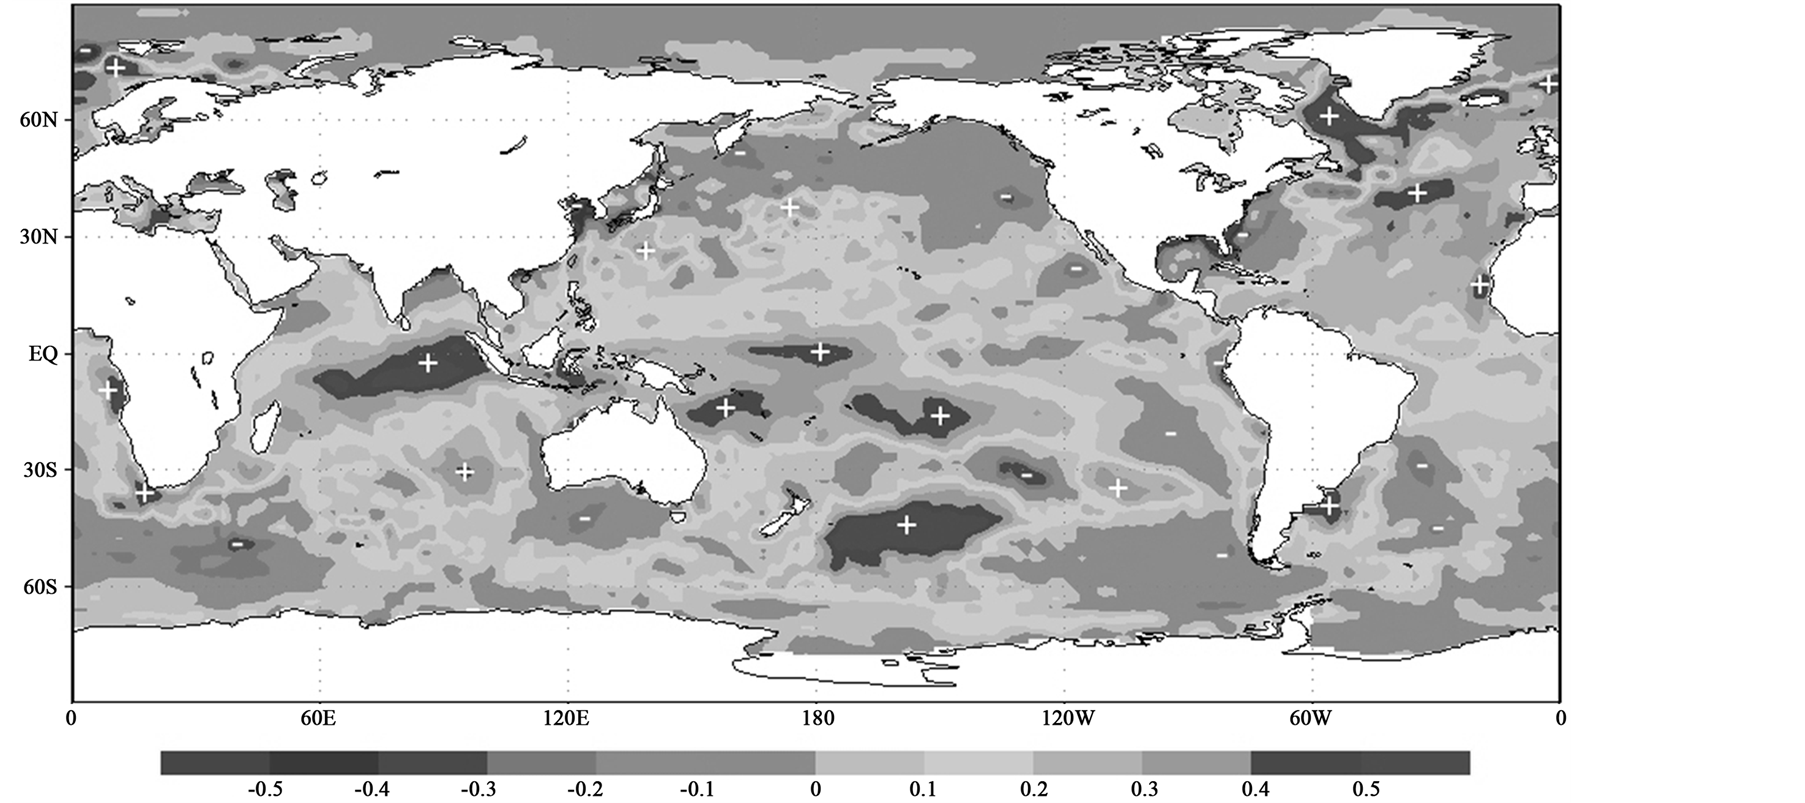 (c)
(c)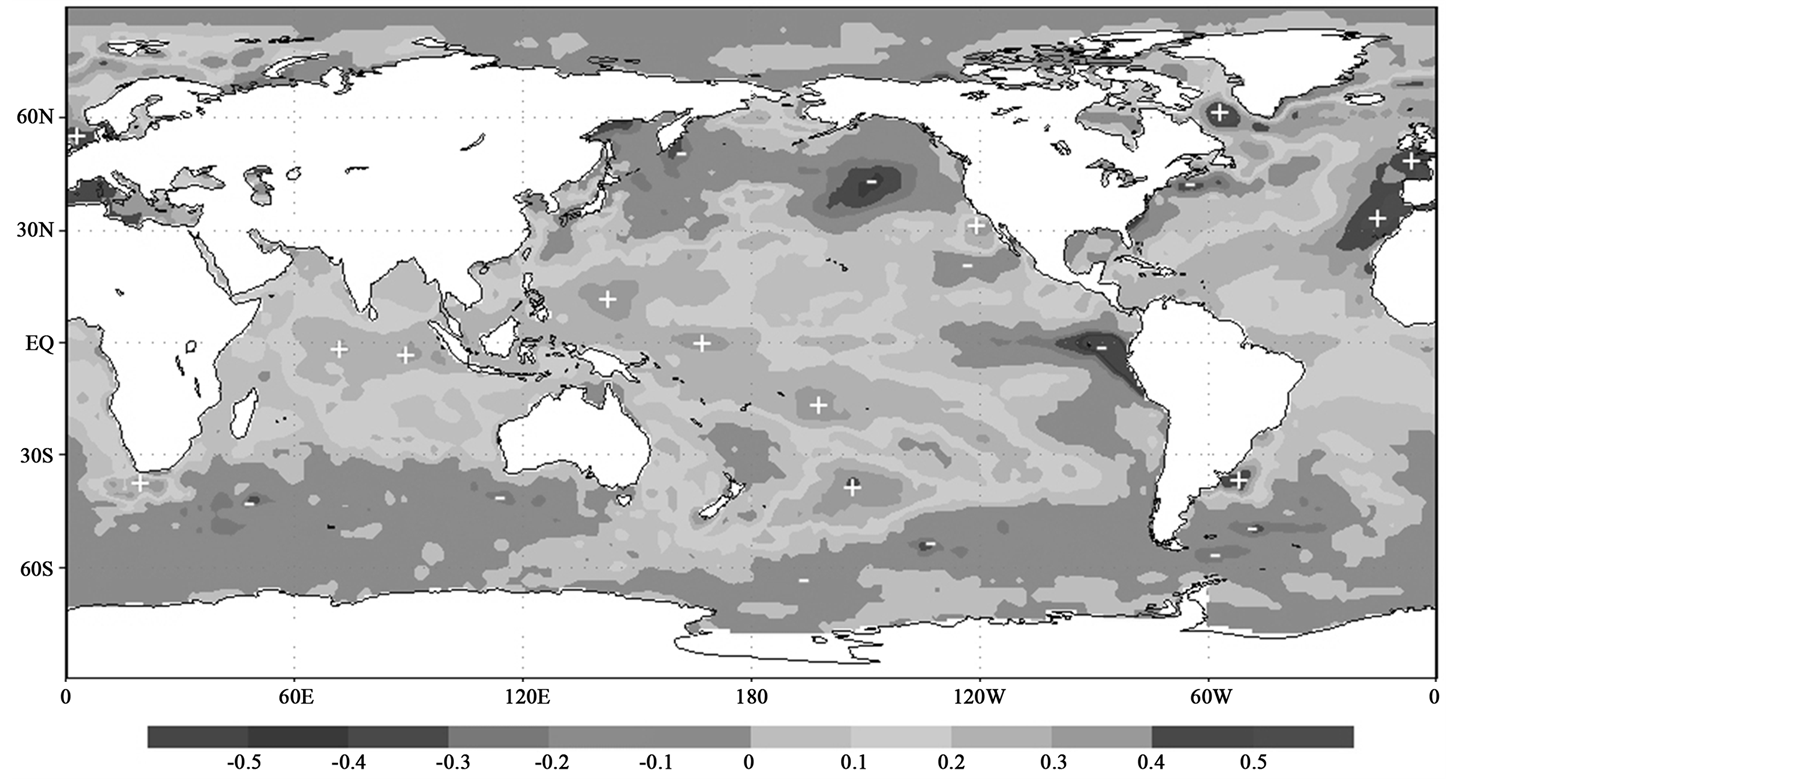 (d)
(d)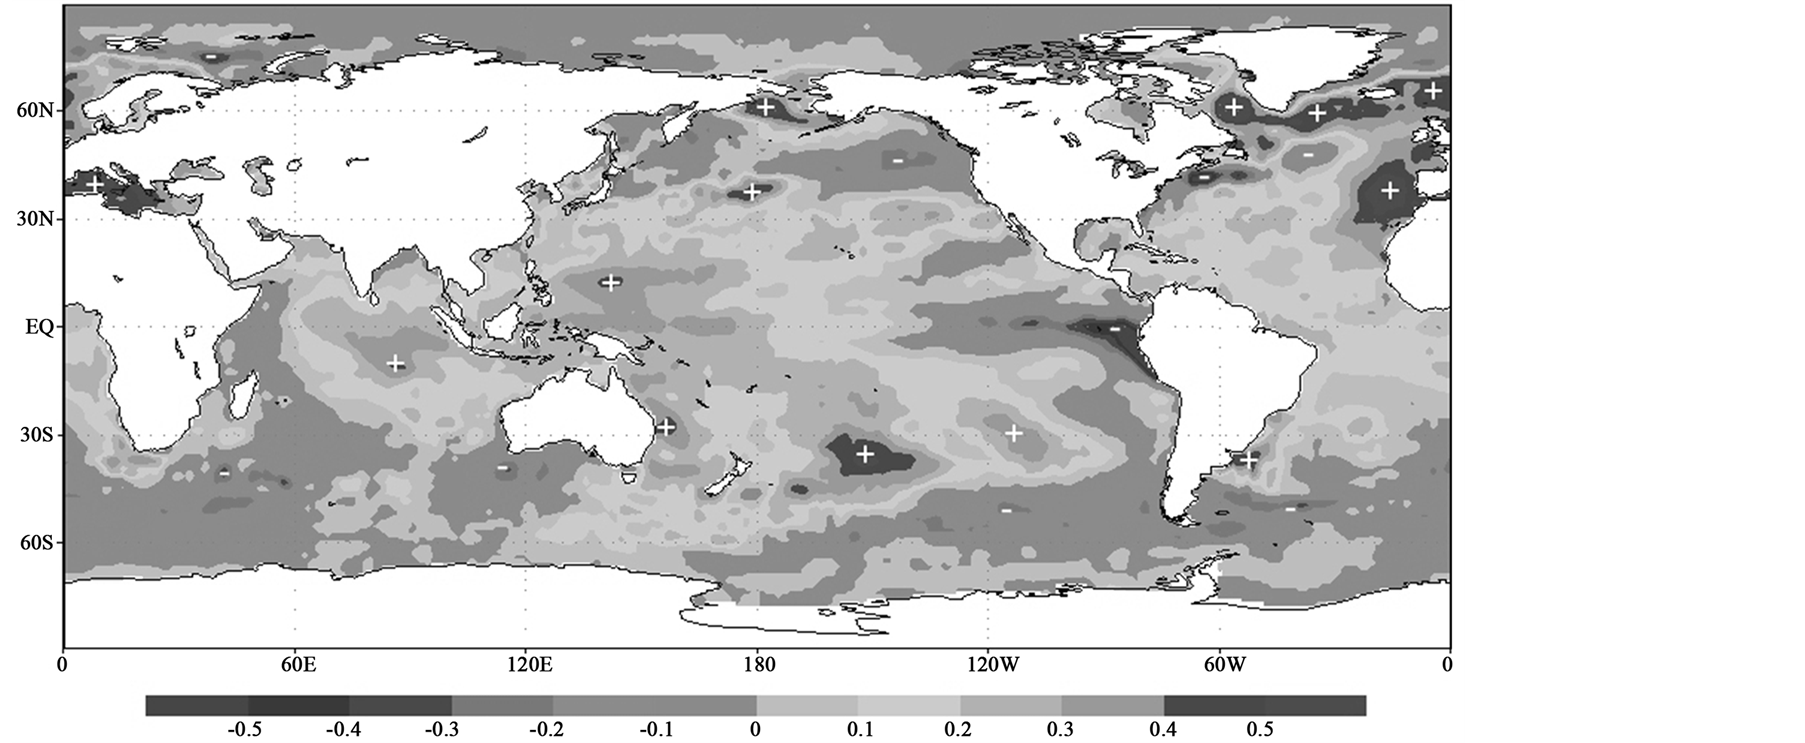 (e)
(e)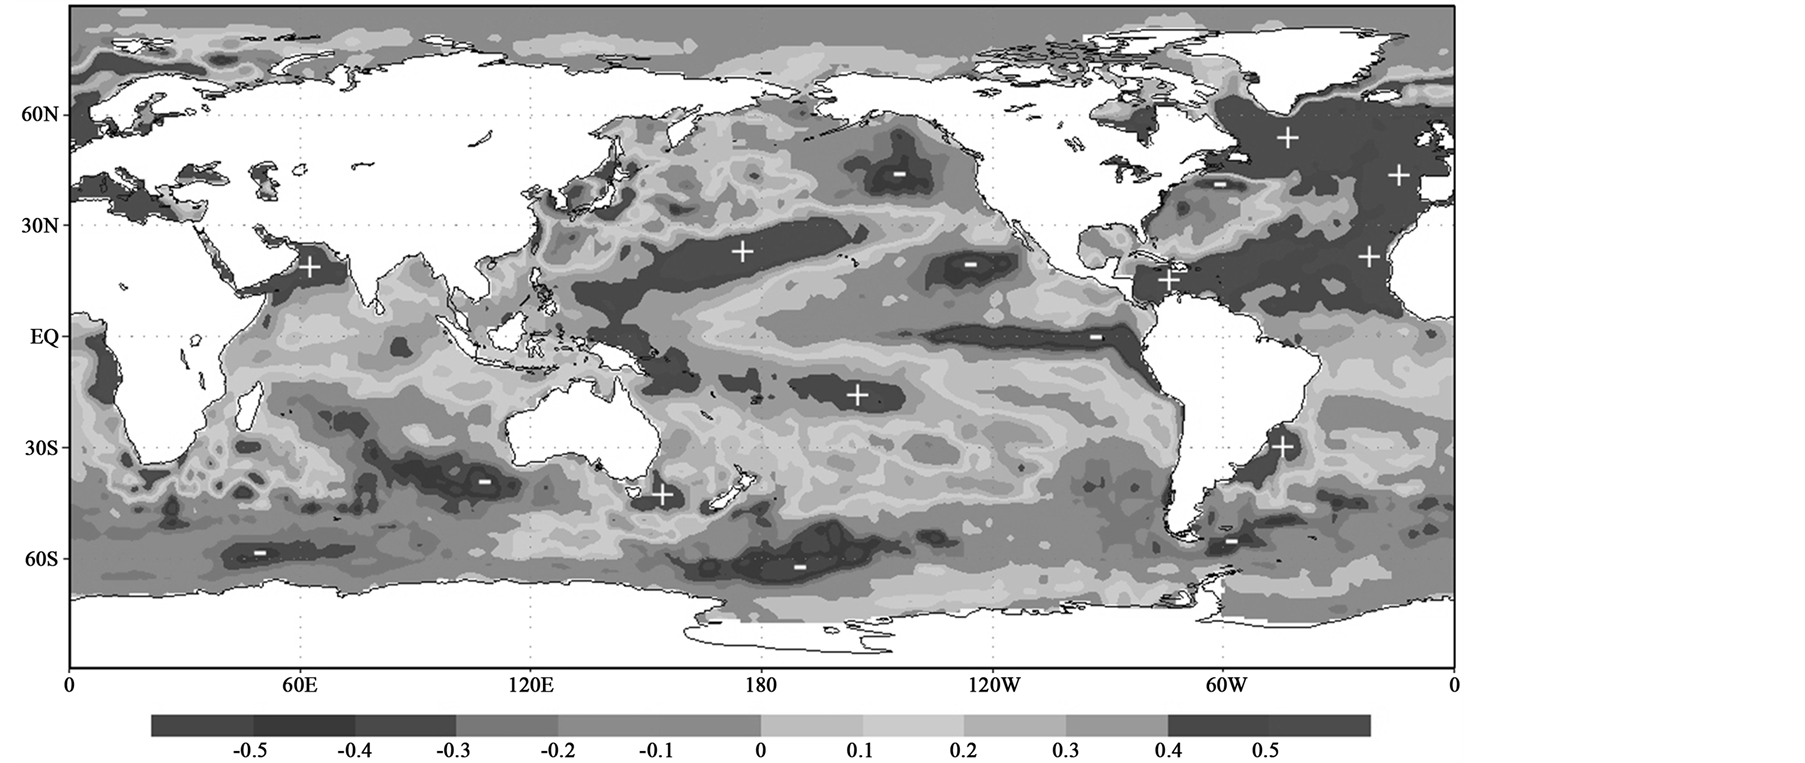 (f)
(f)
Figure 4. Sea surface temperature anomaly maps for days with heavy precipitation (>50 mm/24 h) in environmental regions: a) Sertao; b) Litoral; c) Sertao de São Francisco; d) Baixo do São Francisco; e) Zona da mata e f) Agreste.
tropical latitudes and near the coast of Brazil in events with heavy precipitation (>50 mm/24 h) in the Agreste, Sertao Sao Francisco and Sertao SF. A prevalence of positive SSTA in the northern half and negative in the southern Indian Ocean region was noted for events with heavy precipitation in the Litoral, Baixo, Zona da Mata and Agreste regions (Figure 4(b) and Figures 4(d)-(f)).The negative SSTA area is less significant for rain events in the Sertao Sao Francisco and Sertao regions (Figure 4(a) and Figure 4(c)).
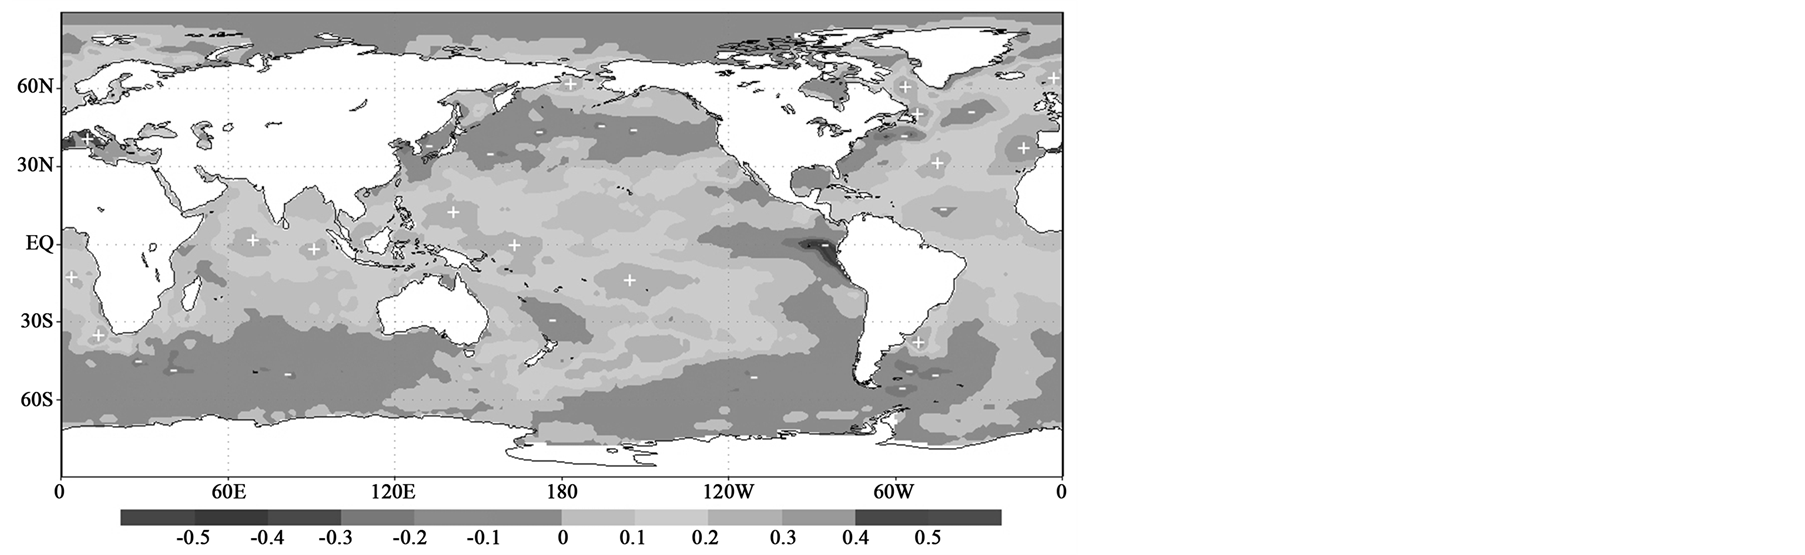
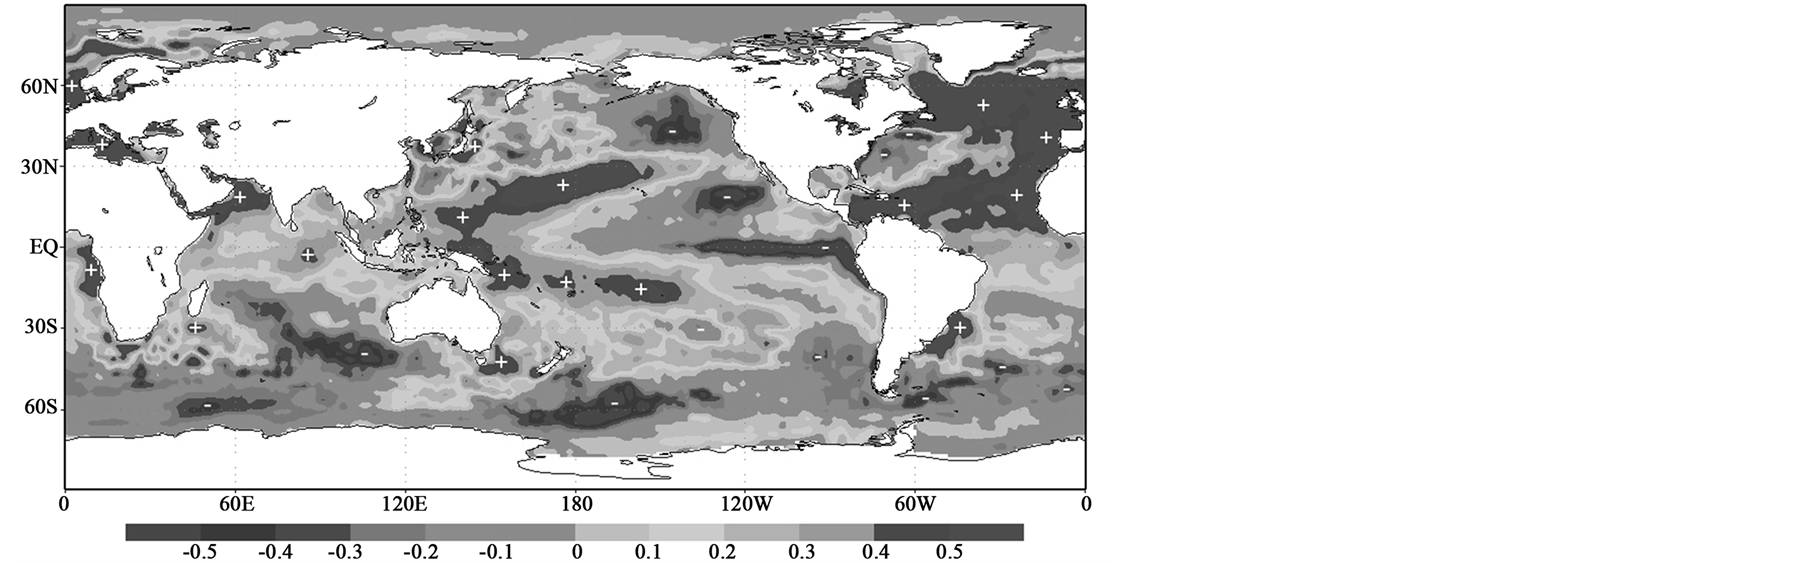
3.2. “Litoral” Region
The location of SSTA centers for days with precipitation >50 and >20 mm/24 h were very similar, but positive or negative anomaly areas were greatest for more intensive precipitation days (Figure 5). A characteristic feature of the spatial distribution of the SSTA in the Pacific Ocean for heavy rain in the Litoral region is the presence of positive anomalies in the western part of the tropical regions and negative anomalies in the east (La Nina).
Most significant climate deviations are observed in the northern half of the North Atlantic. Thus, the existence of negative anomalies in the warm Gulf Stream and positive anomalies in the cold Labrador and Canary currents leads to a homogenization of the temperature contrasts between the western and eastern areas. The result is a change in the location and intensity of the Azores High. These changes, in turn, can not affect the frequency and intensity of wave disturbance in the trade winds (WDTW). The anomalously warm surface of the South Atlantic may increase the frequency of WDTW and intensify convection on the frontal zone and is associated with heavy precipitation in the Litoral Region of Alagoas [3] [12] .
The space distribution of the SSTA in the Southern Hemisphere is characterized by the positive SSTA in the equatorial and tropical latitudes and negative SSTA in the temperate latitudes. As shown in [51] , positive SST anomalies over the tropical South Atlantic along with negative SST anomalies over the extra-tropical South Atlantic are associated with an early onset of wet summers over northeastern Brazil. The monsoon may affect the Litoral region located near the ocean.
Another important factor contributing to the intensification of the atmospheric processes and to the hemispheric exchange in the equatorial and tropical latitudes of the Atlantic Ocean is the meridional temperature gradient, which is directed from the Southern to the Northern hemisphere. In contrast, during drought years, the interhemispheric SST gradient in the tropical Atlantic is steep and the ITCZ stays far North [52] .
3.3. “Agreste” Region and Others
It is important to note that a significant difference between SSTA center locations for days with precipitation >50 and >20 mm/24 h was not observed. Only areas with positive or negative anomaly for days with precipitation >50 mm/24 h were greater than for days with precipitation >20 mm/24 h (Figure 6). The comparison of SSTA areas for the days with precipitation >20 mm/24 h, and days without precipitation, shows the principal regions with a temperature change in rain formation. Rain in Agreste is associated with an increase in temperature in the North Atlantic, and near the Uruguayan coast, and a drop in temperature along the equator between the South American western coast and 130˚W.
The map shows links between positive anomalies in the tropical and equatorial latitudes of the western Pacific Ocean and negative anomalies in the east of the El Nino. In the Atlantic, an important region of the temperature increase was observed in the Caribbean Sea, and in the ocean currents in the Northern Hemisphere.
The space distribution of SSTA, presented on the composite maps for Baixo SF and Zona da Mata regions, in general is similar to the distribution for the Agreste region. SSTA are less significant for the Sertao region.
3.4.Results of Student Criteria Analysis
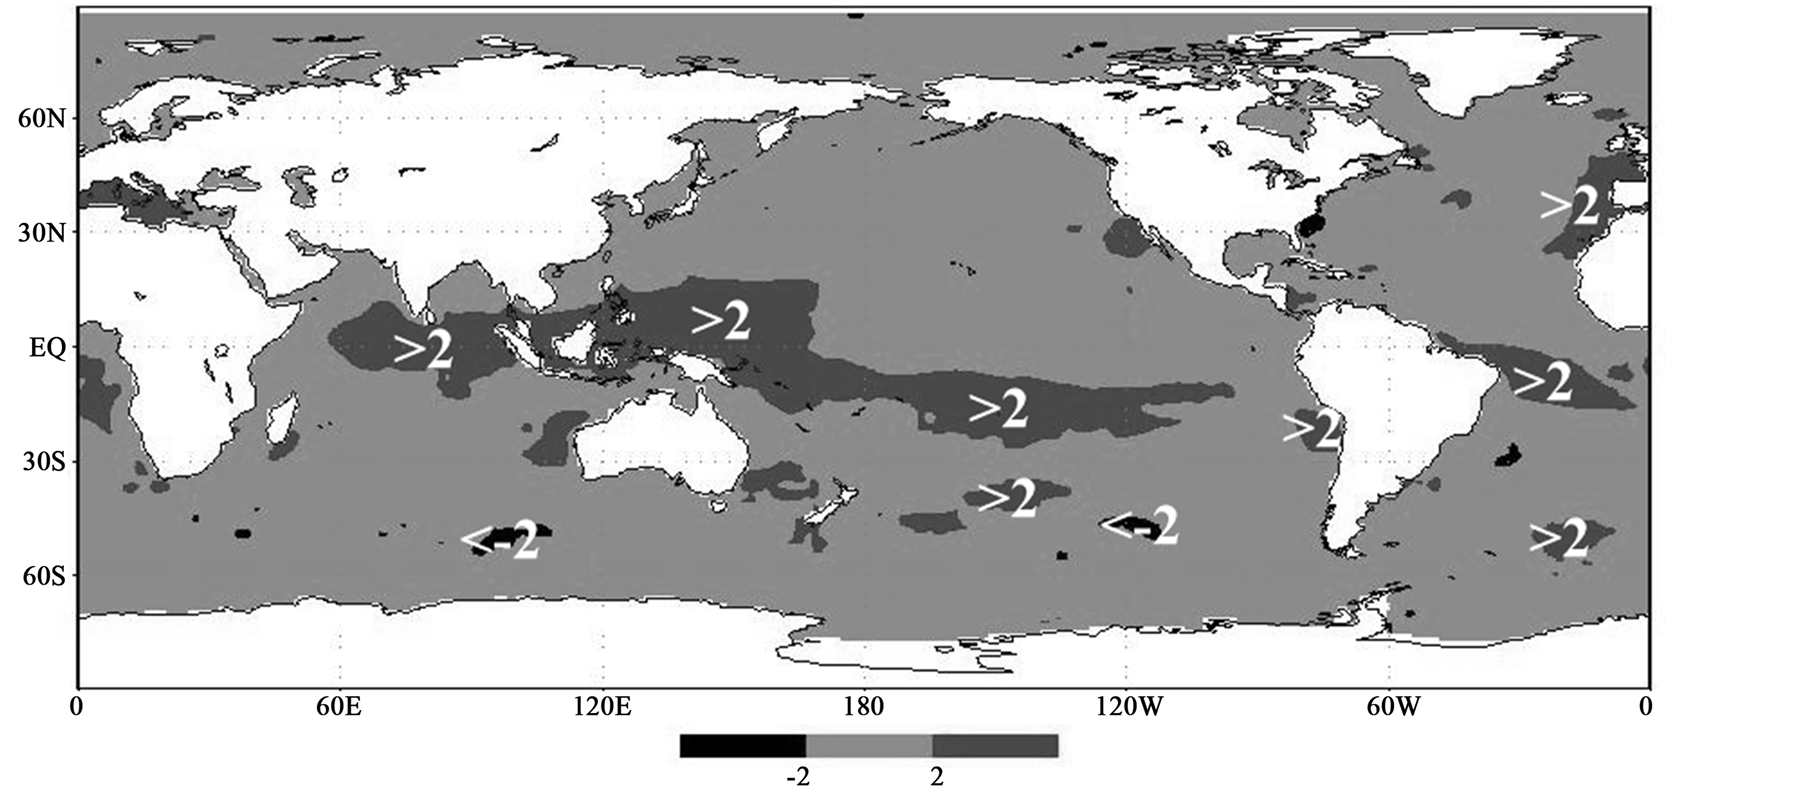
An empirical criterion temp was calculated for all grid points of the World Ocean for events with precipitation >20 mm/24 h (number of cases more or equal to 190). If the value of the empirical criterion temp is more than about twice as large as the denominator in absolute value, the null hypothesis would usually be rejected, corresponding to a two-sided test at the 5% level.
Figure (Figure 7) shows the space distribution of the calculated (sample) t values defined for precipitation >20 mm/24 h for different regions. In cases of negative or positive t values, the lower (−2.0) or upper (+2.0) confidence limits, respectively, were used. Consequently, the values must be negative for negative composite SSTA, and vice versa. Negative t values occupy relatively small areas in the world’s oceans and are confined mostly to
 (a)
(a)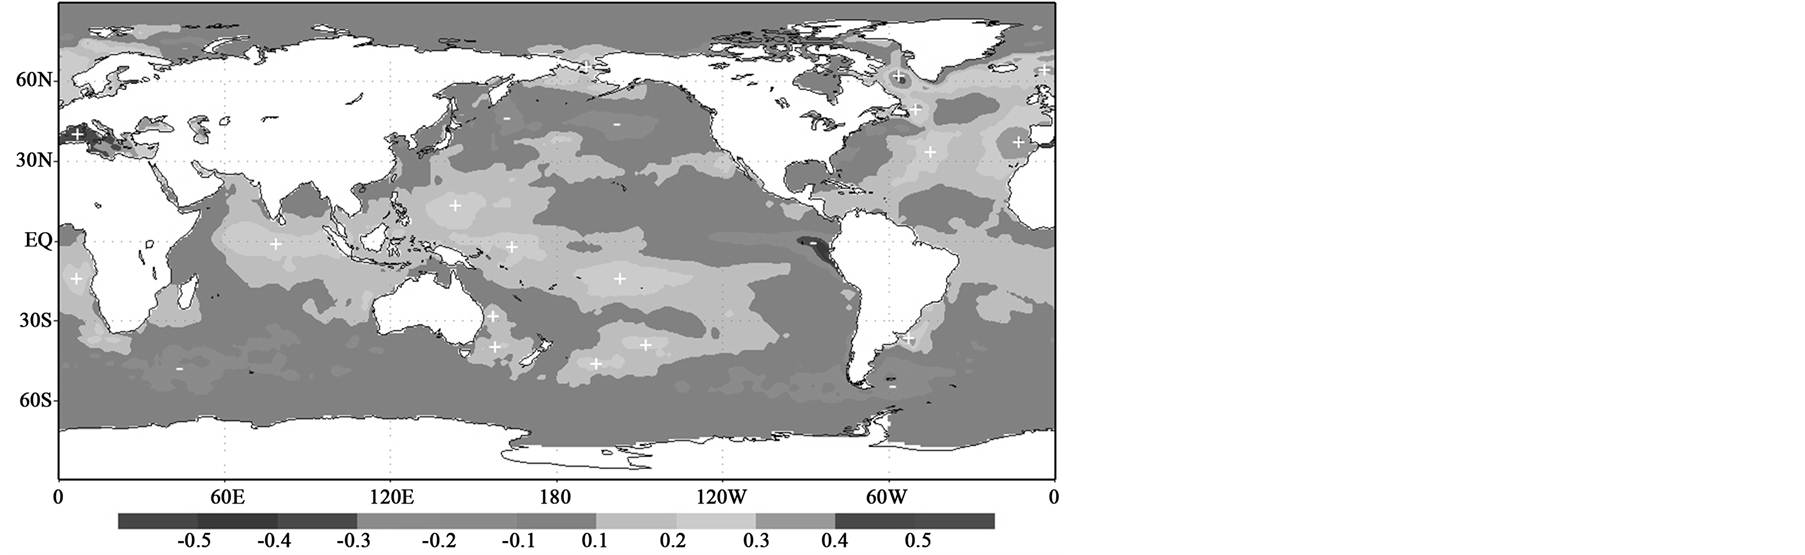 (b)
(b)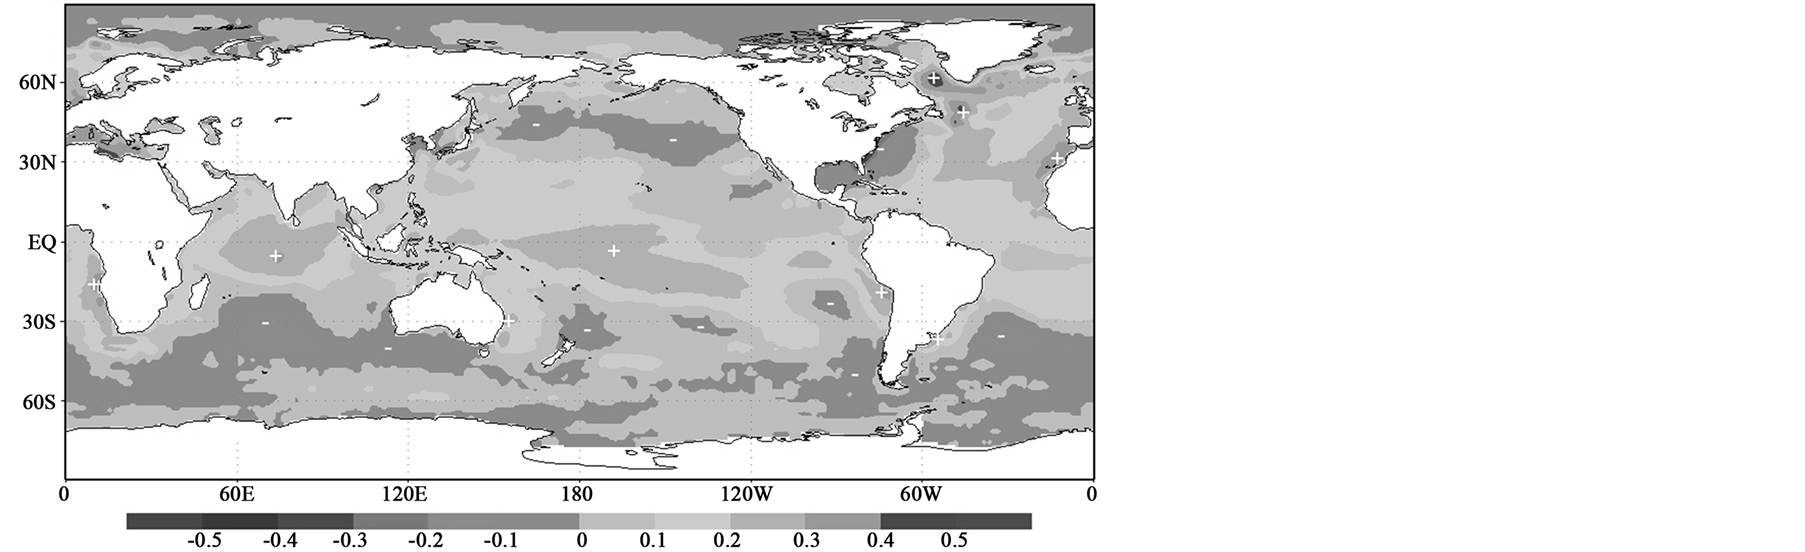 (c)
(c)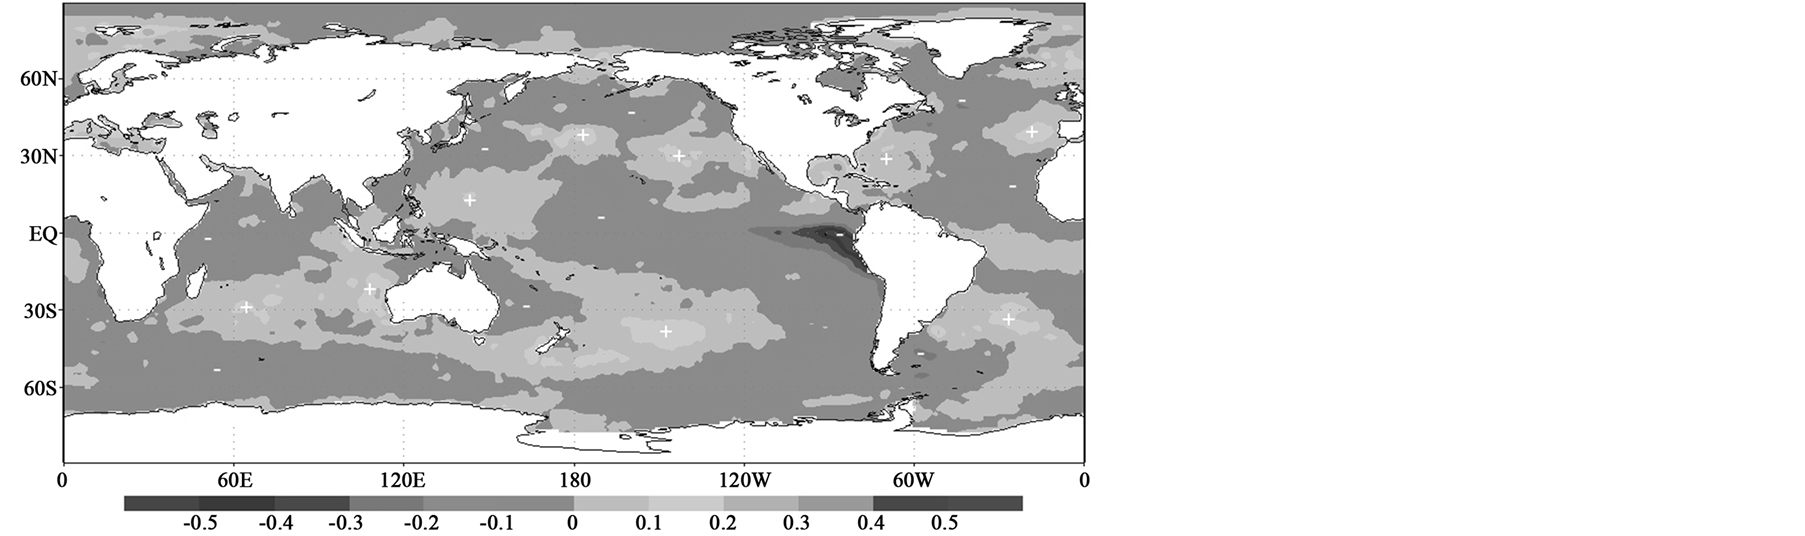 (d)
(d)
Figure 5. Sea surface temperature anomaly maps for days with different precipitation in the Litoral region: a) >50 mm/24 h, b) >20 mm/24 h, c) without precipitation, d) difference between (b) and (c).
 (a)
(a)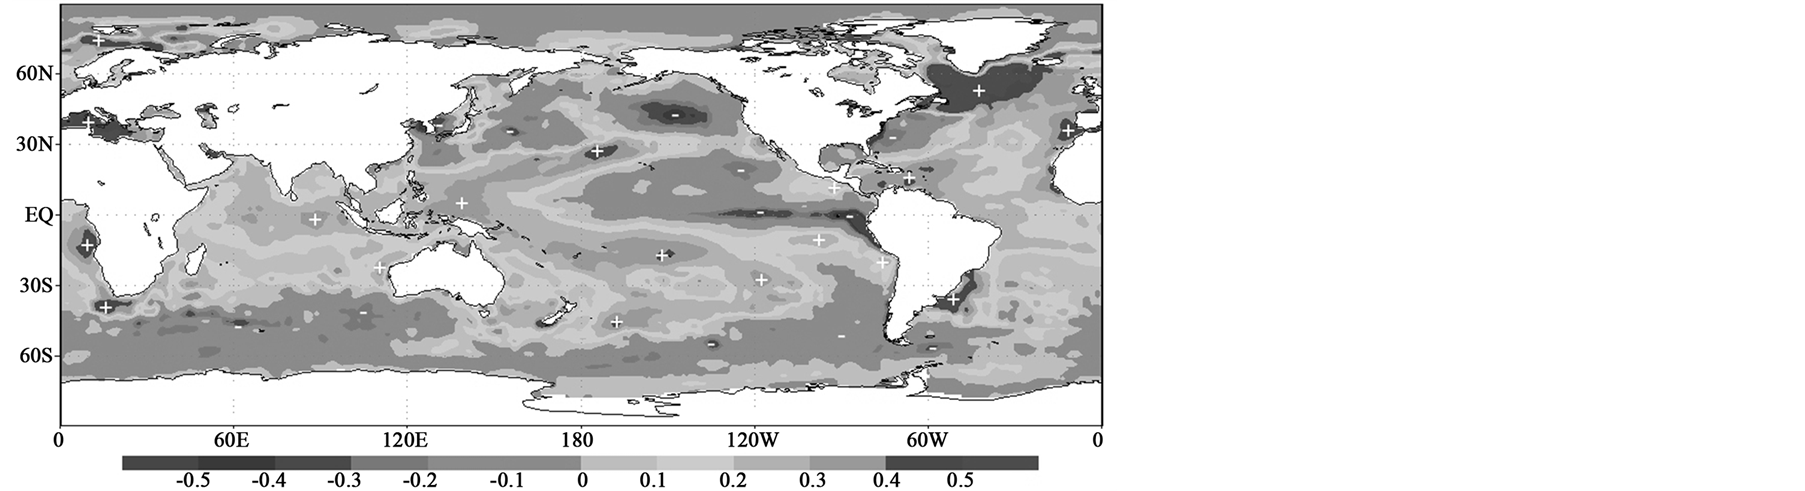 (b)
(b)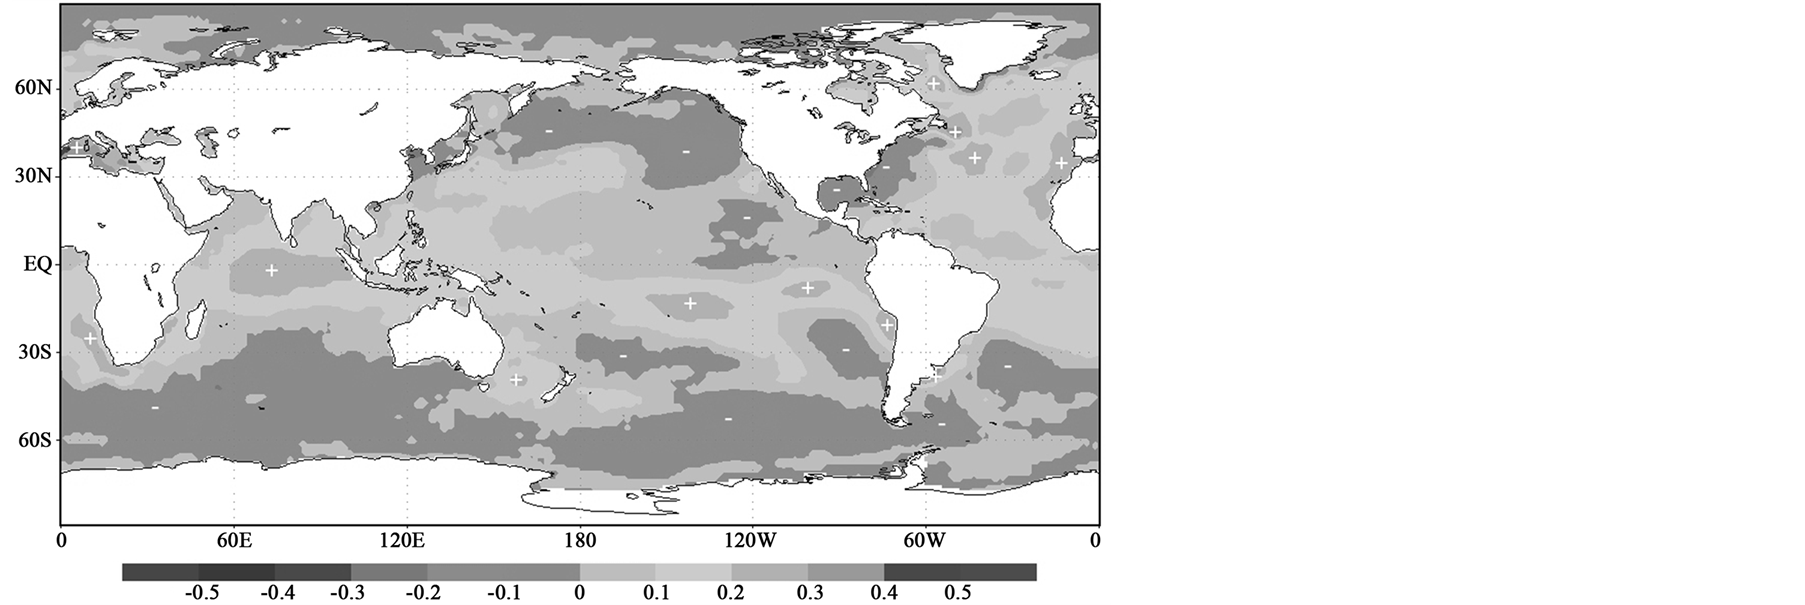 (c)
(c)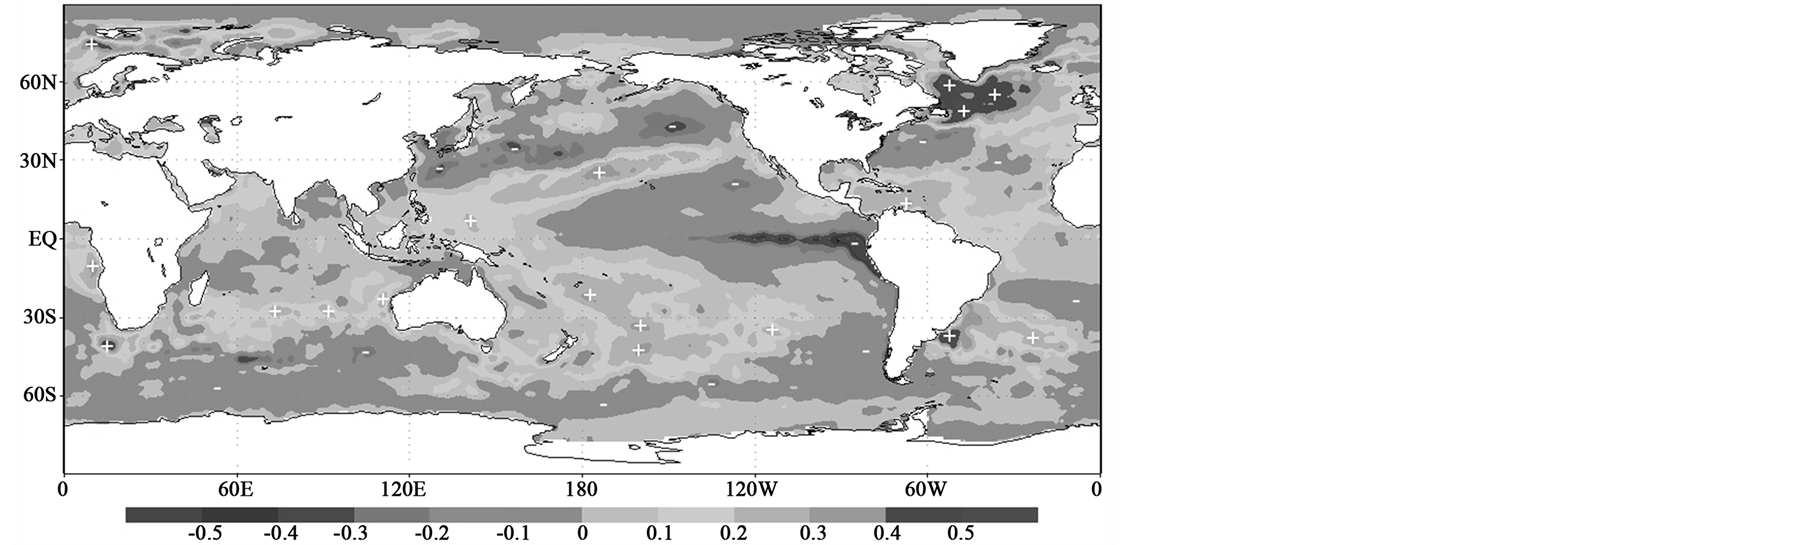 (d)
(d)
Figure 6. Sea surface temperature anomaly maps for days with different precipitation in the Agreste region: a) >50 mm/24 h, b) >20 mm/24 h, c) without precipitation; d) difference between (b) and (c).
 (a)
(a)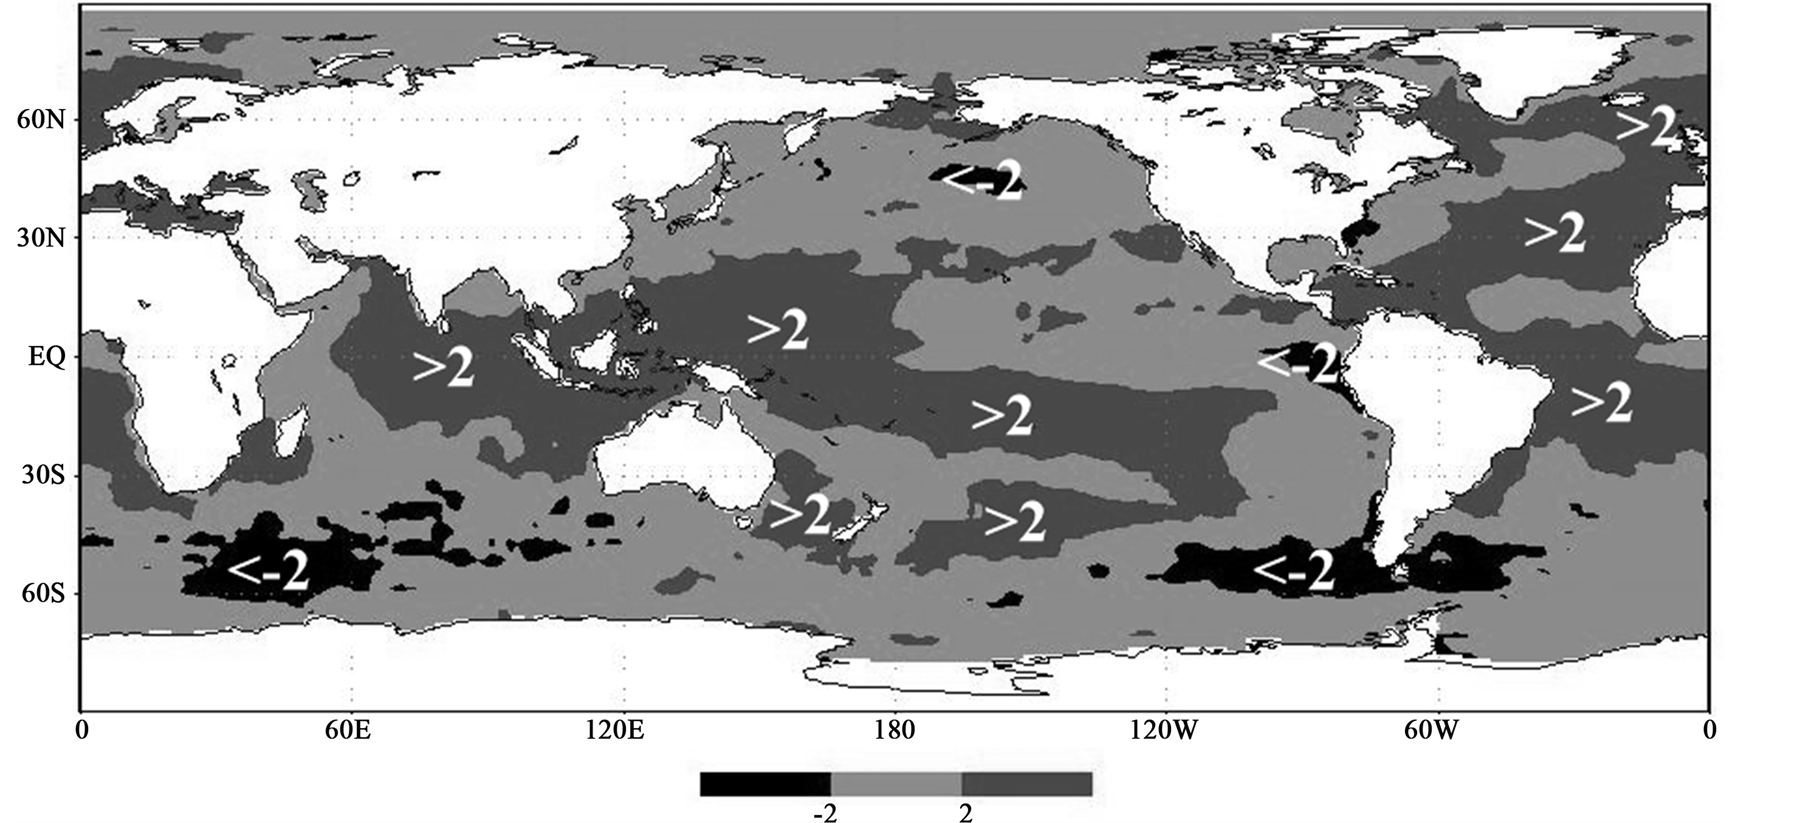 (b)
(b)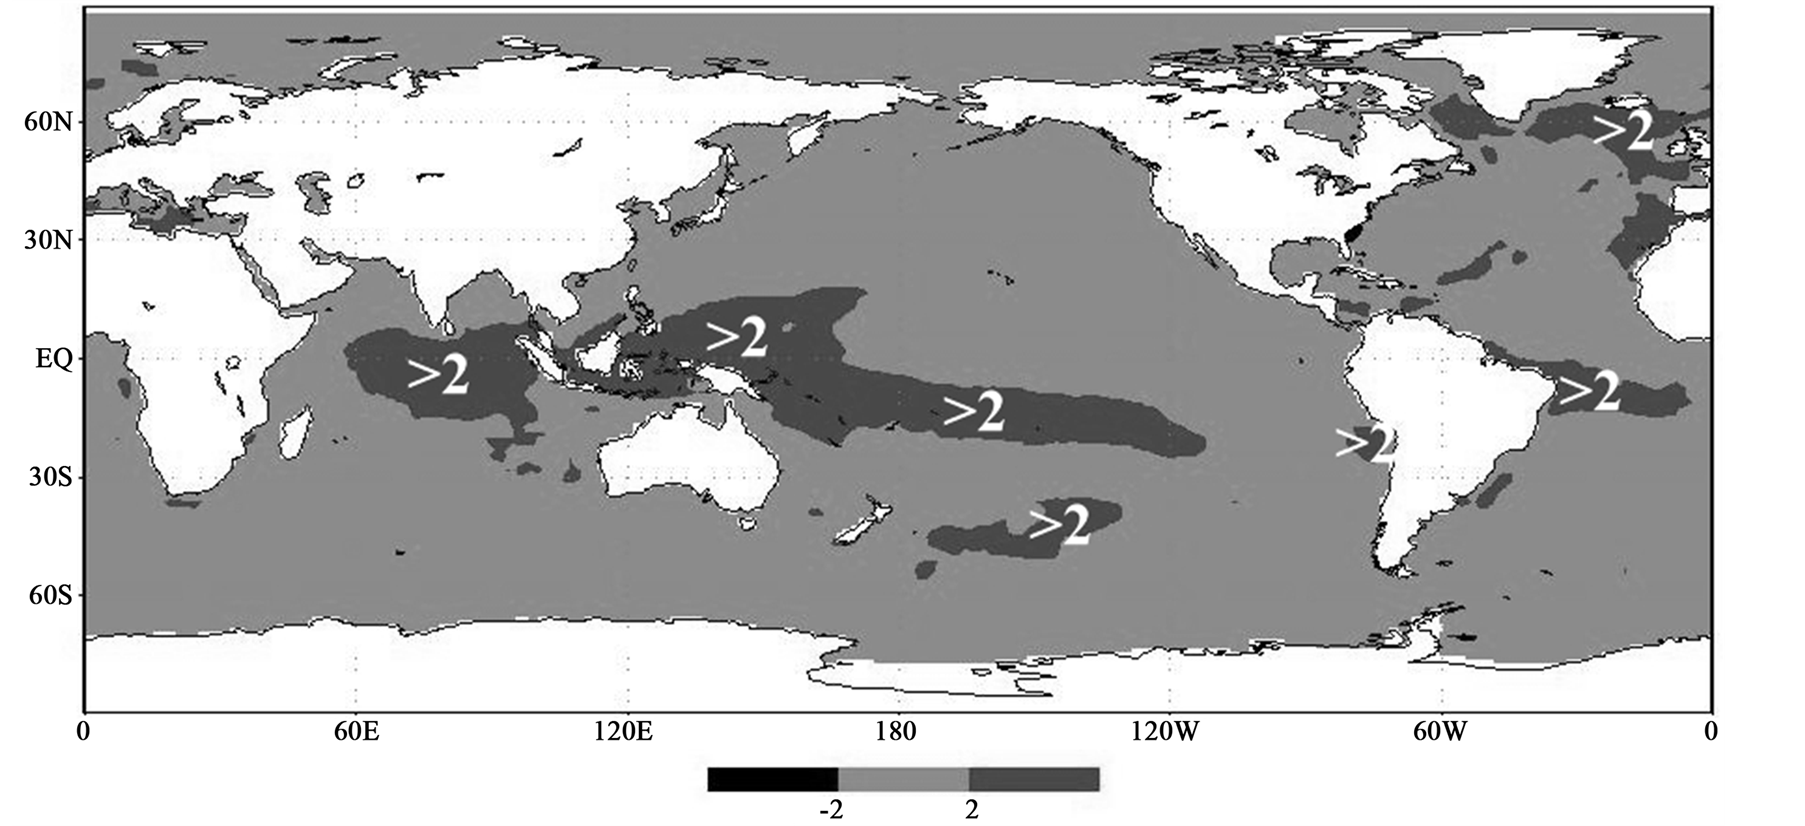 (c)
(c)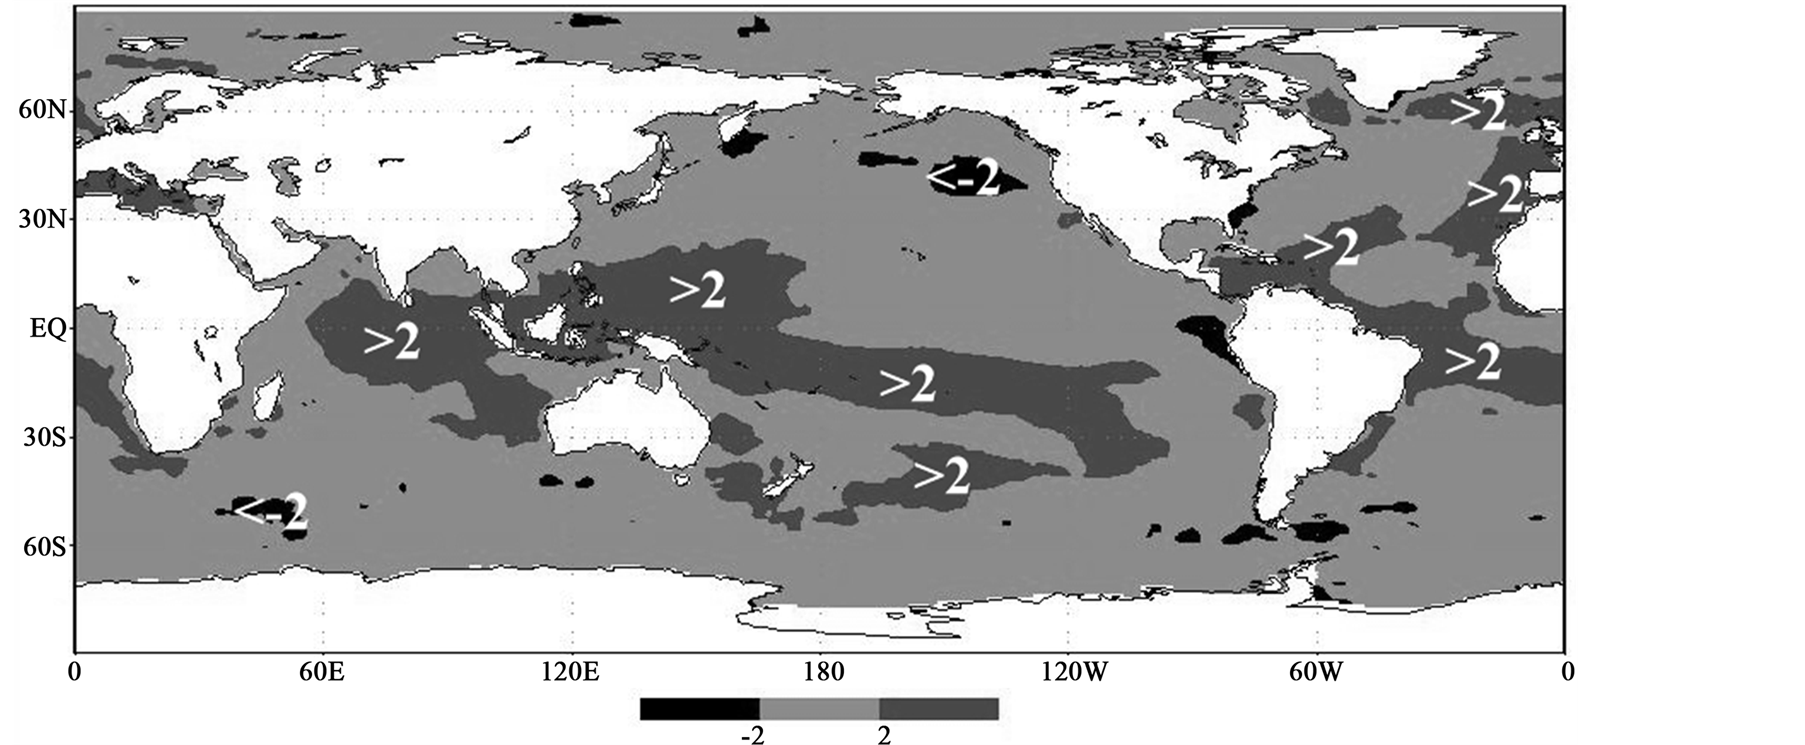 (d)
(d)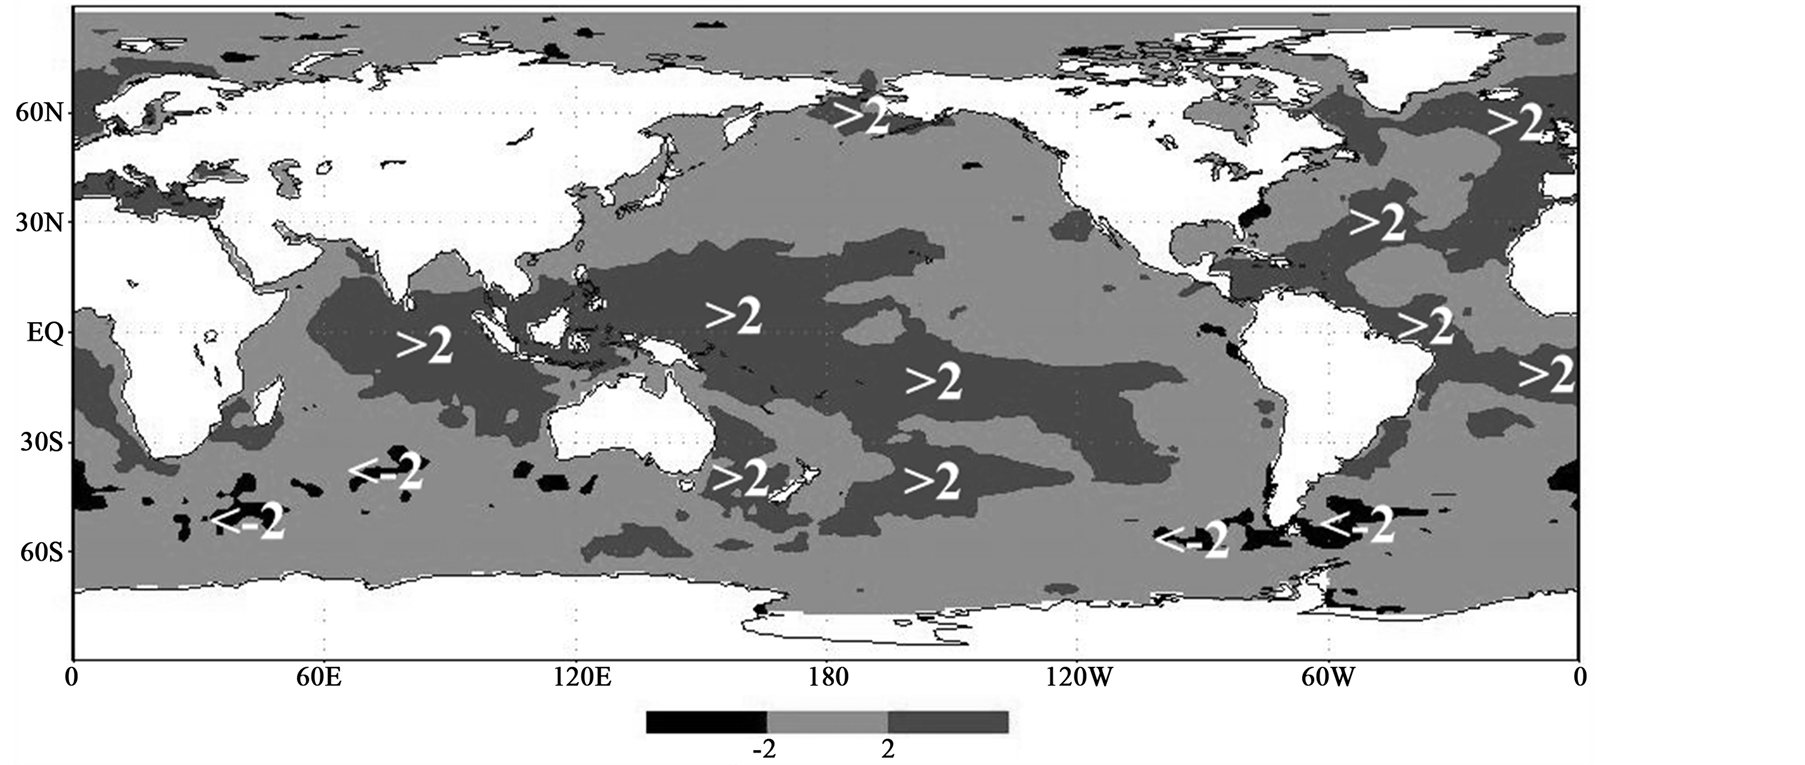 (e)
(e)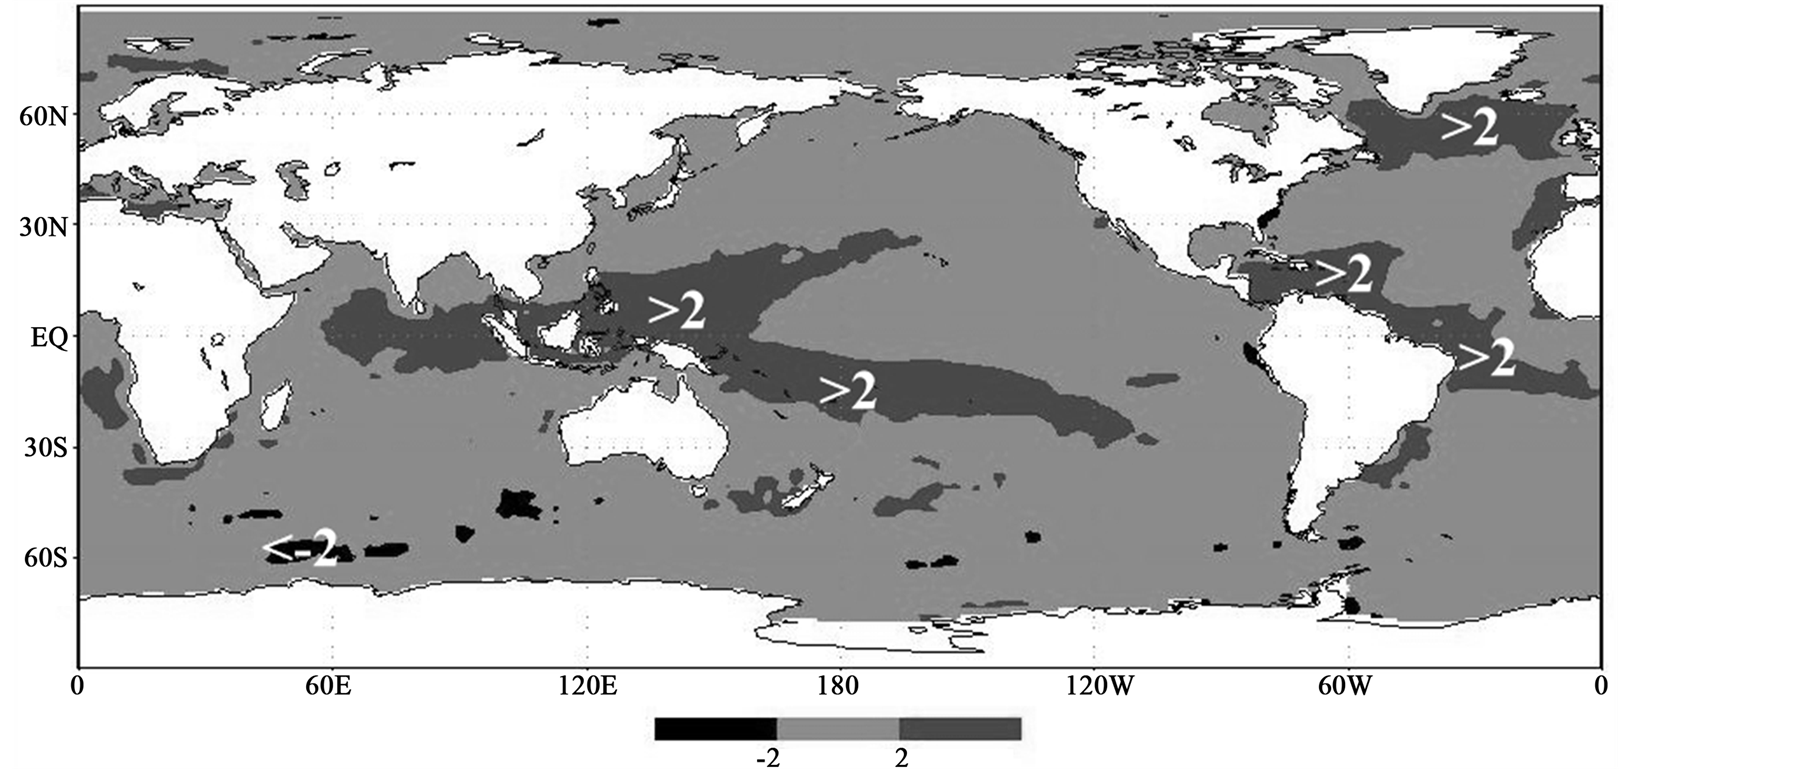 (f)
(f)
Figure 7. t-Student criteria for days with heavy precipitation (>20 mm/24 h) in environmental regions: a) Sertao; b) Litoral; c) Sertao de São Francisco; d) Baixo do São Francisco; e) Zona da mata e f) Agreste. Symbols (>2) and (<−2) are shown the regions with t-student criteria >2 and <−2, respectively.
the La Nina region. Significant synchronous patterns, connected with the La Nina phenomenon, are observed for events with precipitation more than 20 mm/24 h in the Agreste, Baixo do Sao Francisco and Litoral regions (Figure 8(f), Figure 8(d) and Figure 8(b)). Significant positive patterns for intensive precipitation in all regions appear in the tropical Pacific West.
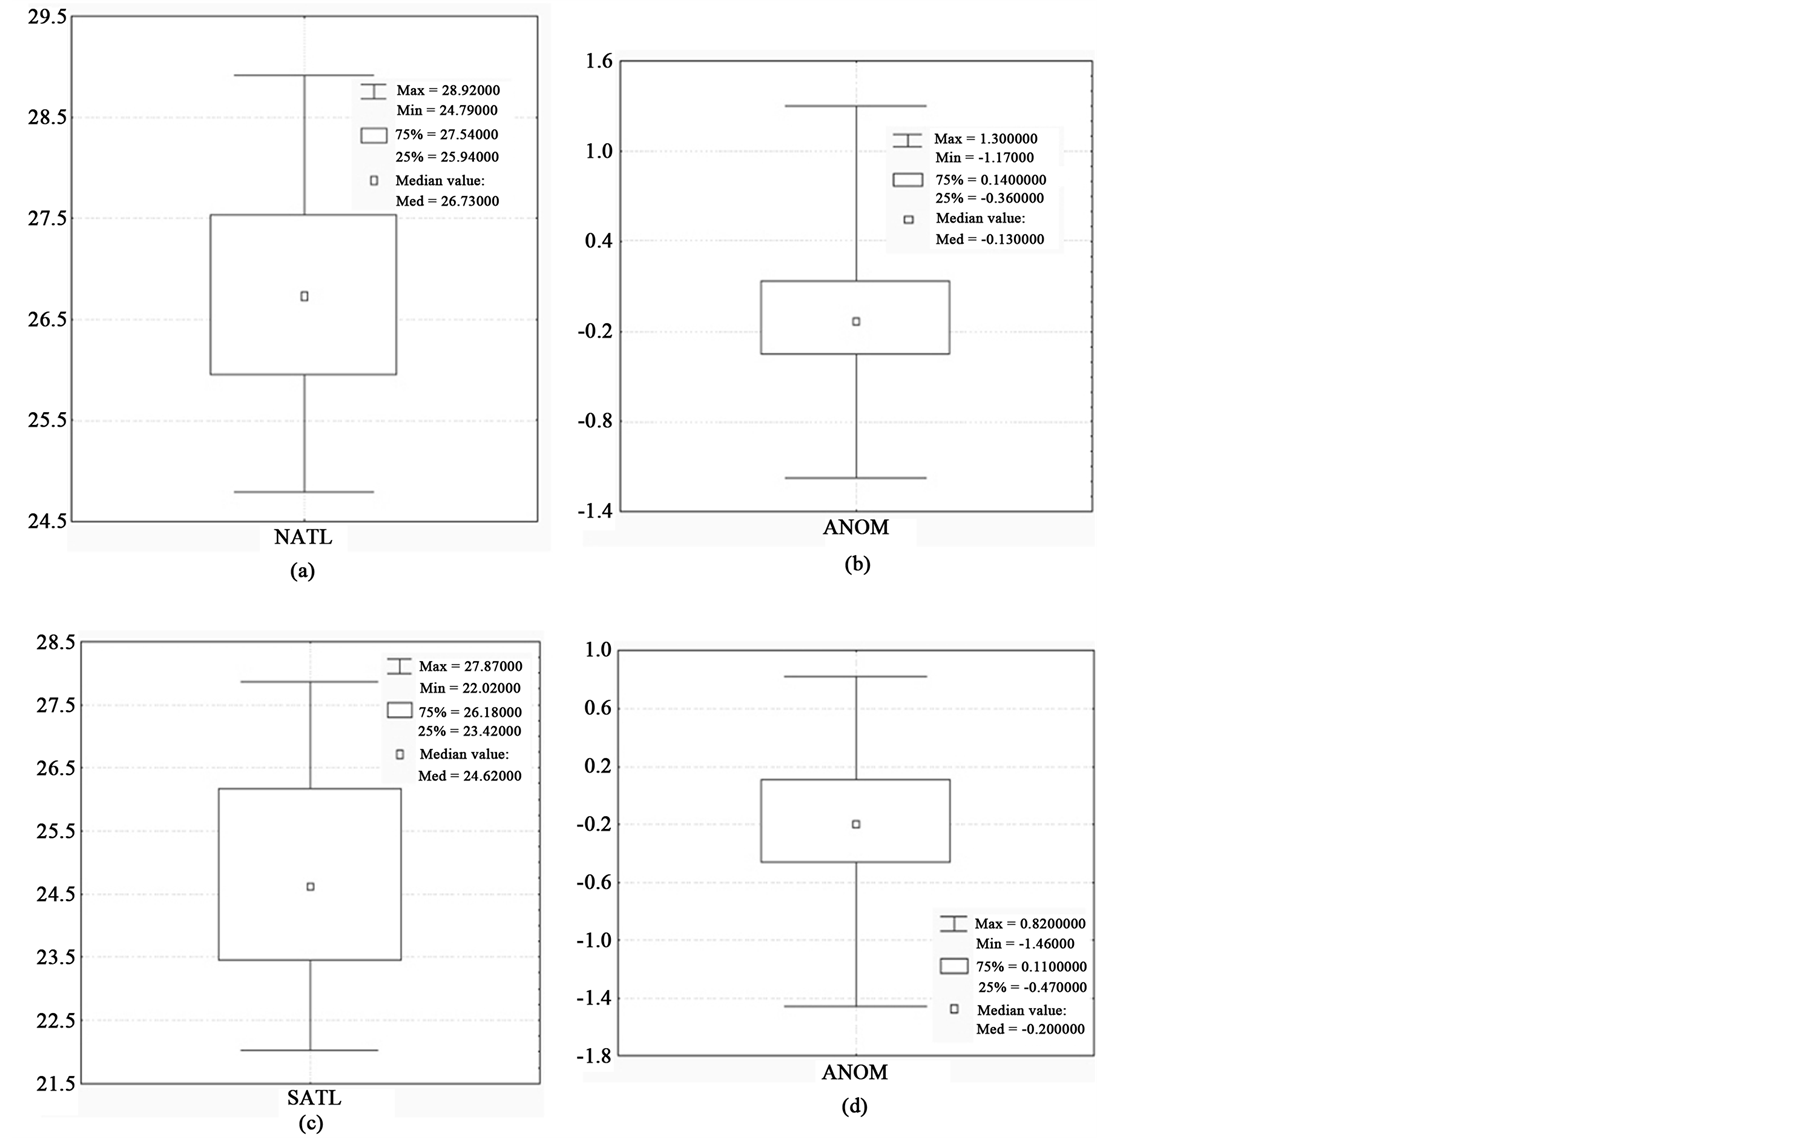
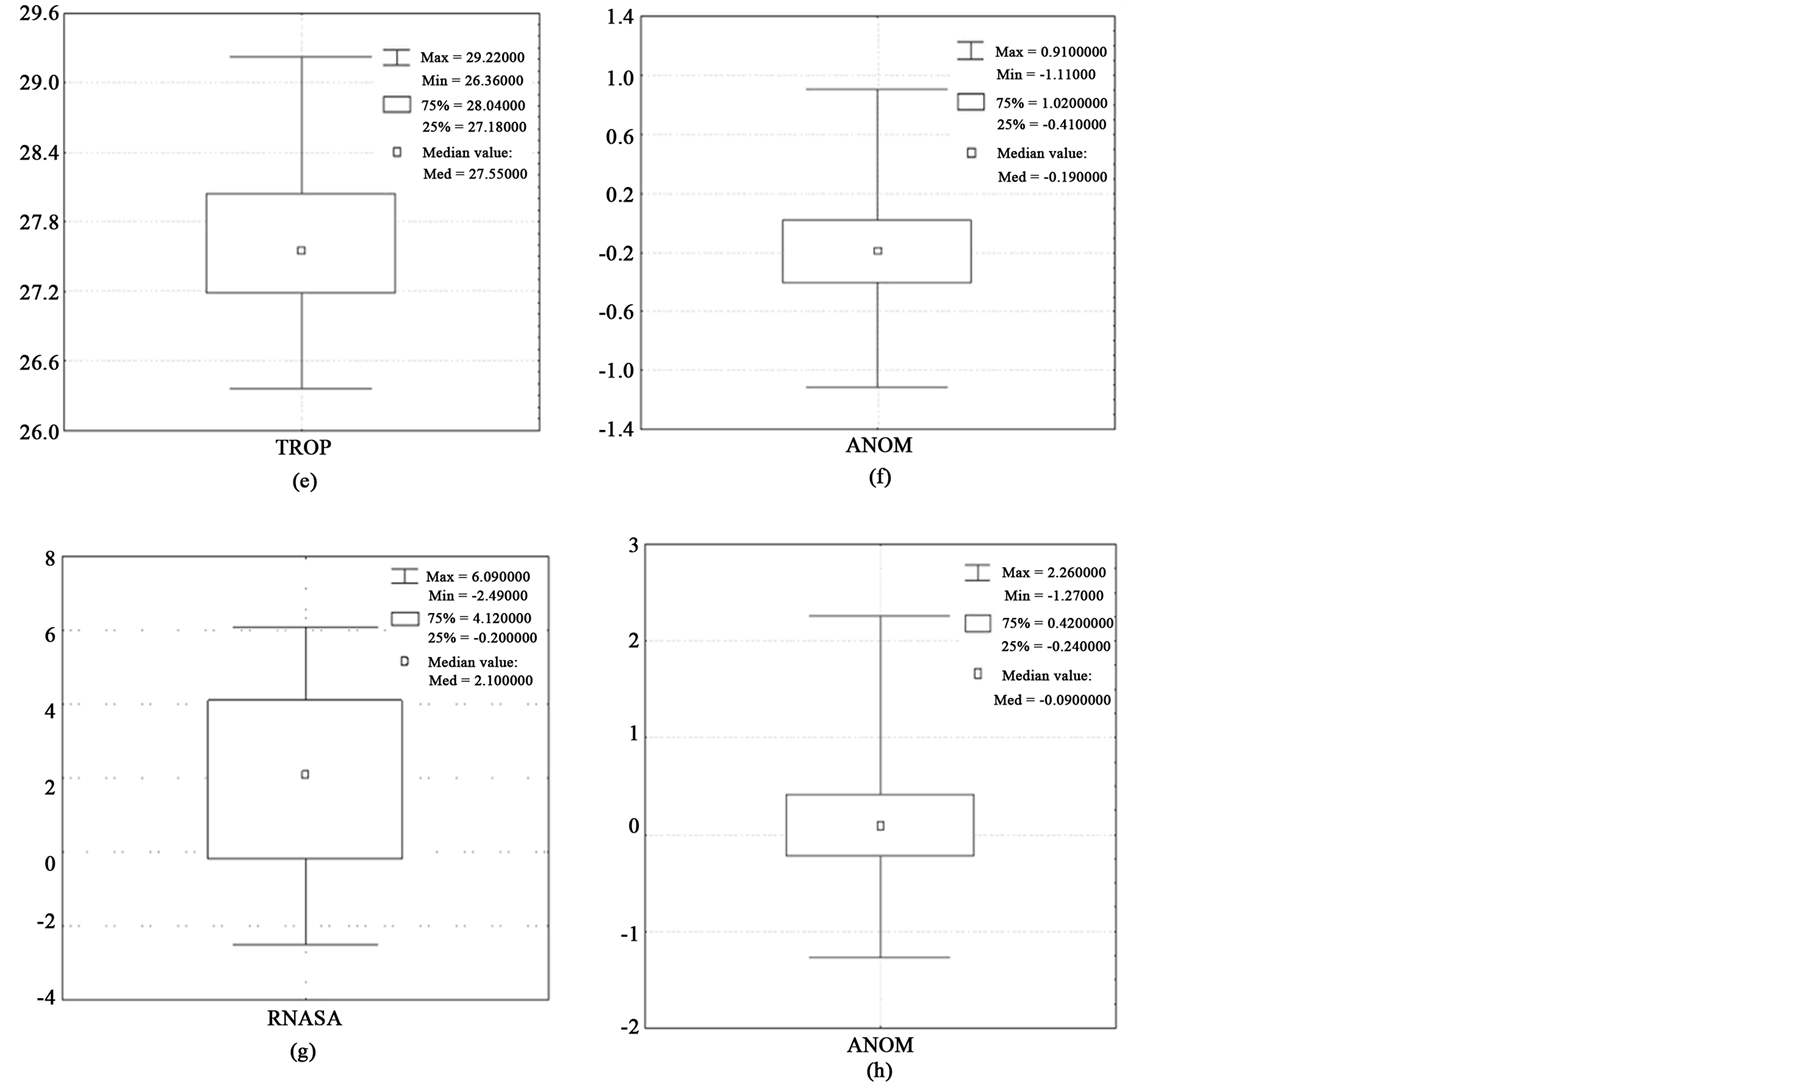
Figure 8. Scope of SST ((a), (c), (e) and (g)) and SSTA ((b), (d), (f) and (h)) indexes: NATL (a); anomaly of NATL (b); SATL (c); anomaly of SATL (d); TROP (e); anomaly of TROP (f); RNSA (g) and anomaly of RNSA (h).
Positive anomaly over the tropical Pacific West and negative anomaly over the tropical Pacific East create the Walker Circulation intensification. One of the direct forcing factors is through the generation of Walker Circulation, with upward motion near the heat source over the warm waters of the western Pacific, and its returning flow from the west to the east in the upper troposphere. In contrast, over the cold waters of the eastern Pacific, the lower atmosphere cools and this enhances the sinking motion in the Walker Circulation in the down current. Lower surface wind speed reduces the sensitive and latent heat fluxes from the surface to the atmosphere. Similar east-west circulation cells spanning different longitudinal sectors along the Equator have been reported.
The Walker Circulation down current intensification over the cold waters of the eastern Pacific leads to general circulation with upward motion near the continental heat source over northeastern Brazil. According to our results, this means that the La Nina events are associated with precipitation in the Agreste, Baixo do Sao Francisco and Litoral regions. In contrast, El Niño episodes were related to droughts in northeastern Brazil [30] . In this last case, the sinking motion associated with Walker Circulation widespread in northeastern Brazil. During La Nina events, Walker Circulation leads to rainfall anomalies with a reversal of the sign compared to El Nino events.
As you can see, intense rainfalls in all regions are accompanied by positive SSTA in the tropics. Atmospheric motions on the scale ranging from micro to macro are intensified by the influence of an anomalous warm ocean surface to increase the sensitive and latent heat fluxes from the surface to the atmosphere. Intensification of atmospheric processes on a time scale varying from mesoscale disturbances (WDTW, MCC, Instability and breezes) through synoptic systems (Easterly Waves, Frontal zone) to the long-term variability (ITCZ) in turn causes a precipitation response over northeastern Brazil.
The largest number of cases with heavy rainfall occurs in the Litoral region (see Table 3). Therefore, the results of statistical analysis for this region are the most reliable. The Ocean currents play an important role. For the Litoral region (Figure 8(b)), statistically significant connections in the Atlantic are found in the following currents: Labrador, North Atlantic, Canary, North and South equatorial, Caribbean, Guyanan, and North Brazilian.
For the Sertão and Sertão SF regions (Figure 7(a) and Figure 7(c)) distant from the ocean, the role of the ocean decreases; noting that only the upward current of Walker Circulation cannot explain the precipitation intensity in these regions. Relief is also an important factor in the precipitation formation.
3.5. Results of the Quantile Analysis of SST Indexes in the Tropical Region of the North Atlantic
Diagrams of the scope of SST and SSTA indexes were calculated for all study regions. For example, some of the diagrams are presented in Figure 8.
The quantitative results of the quantile analysis of SST indexes are presented in Tables 1-3. They show that absolute values of the negative results are more than positive ones for the anomalies of the SATL and TROP indexes. Minimum and maximum values are almost the same for NATL indexes. The maximum scope (a range with 50% of all values) was obtained for the RNASA index. It means that the RNASA index has more significant

Table 1 . Statistical characteristics of SST indexes. M is median, Min and Max are maximum and minimum values, MM is the difference between maximum and minimum values. L—low quantile, H-high quantile. ∆—span (∆ = ), AN—anomaly.
Table 2. Event numbers with precipitation >50 mm/24 h (total number—N) and event numbers (percentage value in parenthesis) for different quantile thresholds for different SST indexes (NATL, SATL, TROP and RNASA) in studied regions.
Table 3. Event numbers with precipitation >20 mm/24 h (N) and events numbers (percentage value in parenthesis) for SST indexes (NATL, SATL, TROP and RNASA) with quantile thresholds.
variation than other indexes and that it is more useful. It also means that it is very important to consider the thermal exchange between the Northern and Southern Hemispheres for the circulation study in the BNE region. The largest differences between maximum and minimum values were obtained for this same index. Minimum amplitude of oscillations was calculated for the TROP index, which possibly means that there is a different direction of thermal exchange processes at different longitudes of the tropical regions, and that there is some connection between them.
A connection between different precipitation (more than 50 mm/24 h and 20 mm/24 h) and the SST indexes were studied for every region (Table 2 and Table 3). Firstly, event numbers were calculated for all indexes with the following quantile scopes: 25.9 > NATL > 27.5, 23.4 > SATL > 26.2, 27.2 > TROP > 28.0, −0.2 > RNASA > 4.1.
Table 2 and Table 3 show that the tropical latitudes of the oceans, as a whole, (the TROP index) make a major contribution to rain formation. Thus, in situations of predominance of positive anomalies of sea surface temperatures in the tropical latitudes, the probability of rain fall in all of Alagoas’s regions increases. Extreme positive values of the index (TROP > 28.0) account for 51% - 66% of all study events with precipitation more than 50 mm/24 h and 44% - 55% of rainfall over 20 mm/24 h. The greatest effect is noted for the Agreste region.
The other important factor is a positive SSTA in the South Atlantic. Extreme positive values of the SATL index are associated with 39 - 59% of all events with rain more than 50 mm/24 h and 33% - 47% of rainfall more than 20 mm/24 h. Similar precipitation distribution (percentage value in parenthesis) observed for the RNASA index characterized the anomalous meridional SST gradient in the tropical Atlantic. The negative phase of this index (the South Atlantic is warmer than North Atlantic) is connected with 32% - 40% of all precipitation more than 50 mm/24 h and 28% - 38% of events with rain fall over 20 mm/24 h. The cross-gradient flow, through its hydrostatic effect on sea level pressure, implies a shift of ITCZ convection toward the anomalously warmer hemisphere [20] .
In the same way, reanalysis data shows a wave of warm SST (above 27˚C) in the adjacent South Atlantic ocean of Alagoas for MCC events over 10 years [53] . The greatest impact is noted for the Litora and Sertao SF regions (40% of events with precipitation over 50 mm/24 h).
4. Conclusions
The following conclusions should be made as a summary of the assessment of the statistical characteristics of composite charts for the Global SSTA fields and indexes of SSTA distribution in Atlantic.
Heavy precipitation in all regions of Alago as is accompanied by an increase of temperature contrasts between various water areas of the World Ocean. Sea surface temperature anomaly was more intensive for days with heavy precipitation (>50 mm/24 h) and at the highest ambient regions (Zona da Mata and Agreste). The lowest anomalies for all types of precipitation were detected in the semi-arid western region (Sertao).
The most important factor for precipitation formation is the ENSO (El Nino Southern Oscillation) cycle, which refers to the coherent, large-scale fluctuation of ocean temperatures. Significant synchronous patterns, connected with the La Nina phenomenon, are observed for precipitation events over 20 mm/24 h in the Agreste, Baixo do Sao Francisco and Litoral regions. Significant positive patterns for intensive precipitation in all regions appeared in the tropical Pacific West.
A predominance of positive SSTA is observed usually in the North Atlantic; this points to an increase in the possibility of heavy rain in Alagoas during the positive phase of the Atlantic Multidecadal Oscillation (AMO). Another important factor is a positive SSTA in the tropical South Atlantic. The greatest part of the water area in the middle latitudes is accompanied by negative SSTA.
The main contribution to precipitation formation in the Alagoas State is the SST distribution in the tropical regions of the globe. Positive values of the TROP index are associated with the highest possibility of precipitation formation. Another important factor is an anomalous meridional SST gradient in the tropical Atlantic, which is directed from the Southern to the Northern hemisphere. The greatest impact is noted for the Litoral and Sertao SF regions. The relationship of SSTA, winds and convection with rainfall have also been traced in other regions.
Obtained dependences can be used as additional information in the diagnosis and forecast of heavy rain fall in the Alagoas state.
Acknowledgements
The partial financial support (student grants) was provided by CNPq (National Council of Scientific and Technological Development) and CAPES (Coordination of the Level Superior Personal Improvement).
References
- Molion, L.C.B. and Bernardo, S.O. (2002) Uma revisão da dinâmica das chuvas no Nordeste Brasileiro. Revista Brasileira de Meteorologia, 17, 1-10.
- Pontes Da Silva, B.F., Fedorova, N., Levit, V., Cavalcanti, J.V. and Rocha, A.C. (2008) El Niño-Oscilação Sul e sua relação com as precipitações observadas no período chuvoso de Alagoas entre 2003 e 2006. In: XV Congresso Brasileiro de Meteorologia, San Paulo.
- Pontes Da Silva, B.F., Fedorova, N., Levit, V. and Peresetsky, A. (2011) Sistemas sinóticos associados às precipitações intensas no Estado de Alagoas. Revista Brasileira de Meteorologia, 26, 295-310.
- Schwerdtfeger, W. (1976) Climates of Central and South America. Elsevier Scientific Publishing Company, New York.
- Kousky, V.E. (1979) Frontal Influences on Northeast Brazil. Monthly Weather Review, 107, 1140-1153. http://dx.doi.org/10.1175/1520-0493(1979)107<1140:FIONB>2.0.CO;2
- Pereira Fo, A.J., Crawford, K.C. and Stensrud, D.J. (1999) Mesoscale Precipitation Fields. Part II: Hydrometeorologic Modeling. Journal of Applied Meteorology, 38, 102-125. http://dx.doi.org/10.1175/1520-0450(1999)038<0102:MPFPIH>2.0.CO;2
- Hastenrath, S. and Heller, L. (1977) Dynamic of Climatic Hazards in Northeast Brazil. Quarterly Journal of the Royal Meteorological Society, 110, 411-425. http://dx.doi.org/10.1002/qj.49711046407
- Citeau, J., Bergés, J.C., Demarcq, H. and Mahé, G. (1988) Position de La zone de convergence a 28?N et température de surface de l’océan. Veille Climatique Satellitaire, 21, 3-7.�
- Andrade, K. (2005) Climatologia e comportamento dos sistemas frontais sobre a América do Sul. Master’s Thesis, Nacional Institute of Space Science, São José dos Campos.
- Kousky, V.E. and Gan, M.A. (1981) Upper Tropospheric Cyclonic Vortices in the Tropical South Atlantic. Tellus, 33, 538-551. http://dx.doi.org/10.1111/j.2153-3490.1981.tb01780.x
- Cruz, C.D. (2008) Determinação sinótica dos fatores que favorecem as influências frontais sobre o estado de Alagoas. Master’s Thesis, Federal University of Alagoas, Maceio.
- Veber, M.E. (2011) Desenvolvimento de atividades convectivas sobre a região Nordeste do Brasil, organizada pela extremidade frontal. Master’s Thesis, Federal University of Alagoas, Maceio, 132 p.
- Costa, M.S. (2010) Vórtice ciclônico dos altos níveis associado à corrente de jato no nordeste brasileiro nos anos de 1998-2007. Master’s Thesis, Federal University of Alagoas, Maceio, 113 p.
- Ramirez, M.C.V. (1996) Padrões climáticos dos vórtices ciclônicos em altos níveis no Nordeste do Brasil. Thesis, Nacional Institute of Space Science, São José dos Campos.
- Repinaldo, H.F.B. (2010) Vórtice ciclônico em altos níveis e corrente de jato doNordeste brasileiro em anos de El Niño e La Niña. Master’s Thesis, Federal University of Alagoas, Maceio.
- Uvo, C.R.B. and Nobre, C.A. (1989) A Zona de Convergência Intertropical (ZCIT) e a precipitação no norte do Nordeste do Brasil. Parte I: A Posição da ZCIT no Atlântico Equatorial. Climanálise, 4, 34-40.
- Xavier, T.M.B.S., Xavier, A.F.S., Silva Dias, P.L. and Silva Dias, M.A.F. (2000) A zona de Convergência Intertropical — ZCIT e suas relações com a chuva no Ceará (1964-98). Revista Brasileira de Meteorologia, 15, 27-43.
- Zhou, J. and Lau, K.M. (2001) Principal Modes of Interannual and Decadal Variability of Summer Rainfall over South America, International Journal of Climatology, 21, 1623-1644. http://dx.doi.org/10.1002/joc.700
- Fedorova, N. and Carvalho, M.H. (2006) Processos sinóticos em anos de La Niña e de El Niño. Parte VI: Nebulosidade convectiva nas regiões equatoriais e tropicais da América do Sul e oceanos adjacentes. Revista Brasileira de Meteorologia, 21, 1-14.
- Nobre, P. and Shukla, J. (1996) Variation of Sea Surface Temperature, Wind Stress and Rainfall over the Tropical Atlantic and South America. Journal of Climate, 9, 2464-2479. http://dx.doi.org/10.1175/1520-0442(1996)009<2464:VOSSTW>2.0.CO;2
- Coutinho, E.C. and Fisch, G. (2007) Distúrbios Ondulatórios de Leste (Dols) na Região do Centro de Lançamento de Alcântara-MA. Revista Brasileira de Meteorologia, 22, 193-203.
- Fedorova, N. and Carvalho, M.H. (2000) Processos sinóticos em anos de La Niña e de El Niño. Parte II: Zonas Frontais. Revista Brasileira de Meteorologia, 15, 57-72.
- Kousky, V.E. and Ferreira, N.J. (1981) Interdiurnal Surface Pressure Variations in Brazil: Their Spatial Distributions, Origins and Effects. Monthly Weather Review, 109, 1999-2008. http://dx.doi.org/10.1175/1520-0493(1981)109<1999:ISPVIB>2.0.CO;2
- Oliveira, A.S. (1986) Interações Entre Sistemas Frontais na América do Sul e a Convecção da Amazônia. Master’s Thesis, Nacional Institute of Space Science, São José dos Campos.
- Rodrigues, L.R.L., Fedorova, N. and Levit, V. (2010) Adverse Meteorological Phenomena Associated with Low Level Baric Troughs in the Alagoas State, Brazil, in 2003. Atmospheric Science Letters, 11, 204-209. http://dx.doi.org/10.1002/asl.273
- Maddox, R.A. (1983) Large-Scale Meteorological Conditions Associated with Midlatitude, Mesoscale Convective Complexes. Monthly Weather Review, 111, 1475-1493. http://dx.doi.org/10.1175/1520-0493(1983)111<1475:LSMCAW>2.0.CO;2
- Alves, J.M., Ferreira, F.F., Campos, J.N.B., Souza, E.B., Duran, B.J. and Servain, J. (2006) Mecanismos Atmosféricos Associados à Ocorrência de Precipitação Intensa sobre o Nordeste do Brasil durante Janeiro/2004. Revista Brasileira de Meteorologia, 21, 1-21.
- Fedorova, N., Levit, V., Silveira, M.H.S., Pontes Da Silva, B.F. and Amiranashvili, A.G. (2009) Mesoscale Convective Complexes on the Northeastern Coast of Brazil. Journal of the Georgian Geophysical Society, Issue B: Physics of Atmosphere, Ocean and Space Plasma, 13B, 36-49.
- Reboita, M.S., Gan, M.A., Rocha, R.P. and Ambrizzi, T. (2010) Regime de precipitação na América do Sul: Uma revisão bibliográfica. Revista Brasileira de Meteorologia, 25, 185-204.
- Cavalcanti, I.F.A. (2012) Large Scale and Synoptic Features Associated with Extreme Precipitation over South America: A Review and Case Studies for the First Decade of the 21st Century. Atmospheric Research, 118, 27-40. http://dx.doi.org/10.1016/j.atmosres.2012.06.012
- Kousky, V.E. and Ropelewski, C.F. (1989) Extremes in the Southern Oscilation and Their Relationship to Precipitation Anomalies with Emphasis on the South America Region. Revista Brasileira de Meteorologia, 4, 351-363.
- Lima, M.C. (1991) Variabilidade da precipitação no litoral Leste da Região Nordeste do Brasil. Master’s Thesis, Nacional Institute of Space Science, São José dos Campos.
- Moura, G.B.A., Lacerda, F.F., Aragão, J.O.R., Passavante, J.Z.O., Souza, I.A., Lacerda, F.R., Ferreira, M.A.F., Ferreira, F.F. and Silva, C.V. (1999) Relação entre Temperatura da Superfície do Oceano Atlântico (área do Dipolo) e Pacífico com Anomalias de Precipitação do Setor Leste do Nordeste do Brasil: Parte I. In: XI Congresso Brasileiro de Agrometeorologia, Florianópolis.
- Moura, G.B.A., Lacerda, F.F., Aragão, J.O.R., Passavante, J.Z.O., Souza, I.A., Lacerda, F.R., Ferreira, M.A.F., Ferreira, F.F. and Silva, C.V. (1999) Relação entre Temperatura da Superfície do Oceano Atlântico (área do Dipolo) e Pacífico com Anomalias de Precipitação do Setor Leste do Nordeste do Brasil: Parte II. In: XI Congresso Brasileiro de Agrometeorologia, Florianópolis.
- Hastenrath, S. (1976) Variation in Low-Latitude Circulation and Extreme Climatic Events in the Tropical Americas. Journal of the Atmospheric Sciences, 33, 201-215. http://dx.doi.org/10.1175/1520-0469(1976)033<0202:VILLCA>2.0.CO;2
- Kousky, V.E., Kayano, M.T. and Cavalcanti, I.F.A. (1984) A Review of the Southern Oscillation: Oceanic-Atmospheric Circulation Changes and Related Rainfall Anomalies. Tellus, 36A, 490-504. http://dx.doi.org/10.1111/j.1600-0870.1984.tb00264.x
- Alves, J.M.B., Souza, E.B., Repellie, C.A. and Ferreira N.S. (1997) Um estudo da variabilidade pluviométrica no setor leste do nordeste brasileiro e a influência do fenômeno El Niño/Oscilação Sul. Revista Brasileira de Meteorologia, 12, 25-39.
- Andreoli, R.V., Kayano, M.T., Guedes, R.L., Oyama, M.D. and Alves, M.A.S. (2004) A influência da temperatura da superfície do mar dos oceanos Pacífico e Atlântico na variabilidade de precipitação em Fortaleza. Revista Brasileira de Meteorologia, 19, 337-344.
- Mantua, N.J., Hare, S.R., Zhang, Y., Wallace, J.M. and Francis, R.S. (1997) A Pacific Interdecadal Climate Oscilation with Impacts on Salmon Production. Bulletin of the American Meteorological Society, 78, 1069-1079. http://dx.doi.org/10.1175/1520-0477(1997)078<1069:APICOW>2.0.CO;2
- Siqueira, A.H.B. (2010) Clima da América do Sul e sua relação com oceanos adjacentes. Master’s Thesis, Federal University of Alagoas, Maceio.
- Souza, E.B., Kayano, M.T. and Ambrizzi, E. (2004) The Regional Precipitation over the Eastern Amazon/Northeast Brazil Modulated by Tropical Pacific and Atlantic SST Anomalies on Weekly Timescale. Revista Brasileira de Meteorologia, 19, 325-336.
- Folland, C.K., Colman, A.W., Rowell, D.P. and Davey, M.K. (2001) Predictability of Northeast Brazil Rainfall and Real-Time Forecast Skill, 1987-98. Journal of Climate, 14, 1937-1957. http://dx.doi.org/10.1175/1520-0442(2001)014<1937:PONBRA>2.0.CO;2
- Hastenrath, S. (1990) Prediction of Northeast Brazil Rainfall Anomalies. Journal of Climate, 3, 893-904. http://dx.doi.org/10.1175/1520-0442(1990)003<0893:PONBRA>2.0.CO;2
- Grimm, A. and Tedeschi, R.G. (2009) ENSO and Extreme Rainfall Events in South America. Journal of Climate, 22, 1589-1609. http://dx.doi.org/10.1175/2008JCLI2429.1
- Reynolds, R.W., Rayner, N.A., Smith, T.M., Stokes, D.C. and Wang, W. (2002) An Improved in Situ and Satellite SST Analysis for Climate. Journal of Climate, 15, 1609-1625. http://dx.doi.org/10.1175/1520-0442(2002)015<1609:AIISAS>2.0.CO;2
- Gordin, V.A. (1994) Inverse Interpolation of Averaged Values Applied to Climate Information (in Russian). Meteorology and Hydrology, 11, 110-115.
- Wilks, D.S. (2011) Statistical Methods in the Atmospheric Sciences. Elsevier Science, New York.
- Muravyev, A.V., Kulikova, I.A. and Resnyansky, Y.U.D. (2010) Synchronous and Asynchronous Relations between the North Atlantic SSTA and the Northern Hemisphere Large-Scale Circulation Features. Meteorology and Hydrology, 2, 5-25.
- Bolshev, L.N. and Smirnov, N.V. (1983) Tables of Mathematical Statistics (in Russian). Nauka, Moscow.
- Tukey, J.W. (1977) Box-and-Whisker Plots. §2C. In: Exploratory Data Analysis, Addison-Wesley, Reading, 39-43.
- Bombardi, R.J. and Carvalho, L.M.V. (2011) The South Atlantic Dipole and Variations in the Characteristics of the South American Monsoon in the WCRP-CMIP3 Multi-Model Simulations. Climate Dynamics, 36, 2091-2102. http://dx.doi.org/10.1007/s00382-010-0836-9
- Hastenrath, S. (2011) Exploring the Climate Problems of Brazil’s Nordeste: A Review. Climatic Change, 112, 243-251. http://dx.doi.org/10.1007/s10584-011-0227-1
- Silveira, M.H.S. (2012) Análise termodinâmica dos Complexos Convectivos de Mesoescala atuantes na costa leste do Nordeste Brasileiro. Master’s Thesis, Federal University of Alagoas, Maceio.