Natural Science
Vol. 5 No. 8 (2013) , Article ID: 35569 , 7 pages DOI:10.4236/ns.2013.58107
Electrochemical determination of catechol in tea samples using anthraquinone modified carbon paste electrode
![]()
1Department of Chemistry, College of Natural Sciences, Jimma University, Jimma, Ethiopia; *Corresponding Author: melakrobel@yahoo.com
2Department of Chemistry, College of Natural Sciences, Addis Ababa University, Addis Ababa, Ethiopia
3Department of Water Resources and Environmental Engineering, Institute of Technology, Jimma University, Jimma, Ethiopia
Copyright © 2013 Fekadu Melak et al. This is an open access article distributed under the Creative Commons Attribution License, which permits unrestricted use, distribution, and reproduction in any medium, provided the original work is properly cited.
Received 10 June 2013; revised 10 July 2013; accepted 17 July 2013
Keywords: Square Wave Voltammetry; Anthraquinone; Modified Carbon Paste Electrode; Catechol
ABSTRACT
Electrochemical investigation of catechol using square wave voltammetry with anthraquinone modified carbon paste electrode was found to be very sensitive. Compared with the unmodified carbon paste electrode, the anthraquinone modified electrode remarkably increases the peak currents of catechol, and greatly lowers the peak potential separation. Two varieties of tea, namely green, and black variety: Wush Wush tea, from Ethiopia, known by its brand name were investigated. Responses for the extracts using ethanol: water (1:4) % v/v showed green tea to be superior in catechol content. Optimization of different variables such as pH of working solution, modifier composition and square wave parameters such as frequency, amplitude and step potential were made to improve the method efficiency during the experiment. The reproducibility for the nine repeated analysis of 80 μmol∙L−1 of catechol gave a relative standard deviation of 3.65% and linear calibration plots were obtained in the range 6 to 80 μmol∙L−1 with (R = 0.998) and the detection limit with (S/N = 3) was as low as 2.155 x 10⁻⁷ mol∙L−1.
1. INTRODUCTION
Catechol (1,2-benzenediol) is a natural polyphenolic compound that widely exists in higher plants such as tea, vegetables, fruits, tobacco and some traditional Chinese medicines. It has a biological importance such as antioxidation, anti-virus, flower stimulating effect and affecting the activities of some enzymes [1-3]. Reactions between oxidized polyphenols and proteins are thought to be partly responsible for the so called enzymatic browning in plants [4,5]. Catechol is also used in a variety of applications such as a reagent for photography, dyeing fur, rubber and plastic production, pesticides and in pharmaceutical industries [6]. Recent epidemiological studies have shown that the consumption of tea prevent cancer in humans because the tea leaf contains abundant groups of polyphenols [7]. Despite the fact that catechols are ubiquitous and posses multiple advantageous, their toxicity has been observed in a variety of organisms, and toxic concentrations have been found in the environment. Further, catechol is readily absorbed from the gastrointestinal tract causing renal tube degeneration and decreases in liver functions. Even at low concentration in foods and cigarette smokes, catechol may cause mutagenesis and cancerous alterations [8,9]. Many different reactions can occur with biomolecules such as DNA, proteins and membranes, ultimately leading to non repairable damage [6].
Many methods have been reported for the determination of catechols and its derivatives including: IR spectrometry, UV vis spectrophotometry [10], thin layer chromatography, high performance liquid chromatography [3,11] are to mention some. However, these methods are costly, require highly skilled manpower, complicated and time consuming procedures which is difficult to use for routine analysis. Electroanalytical methods are promising approach owning to its sensitivity, rapidity and simplicity [2] though the case of interference. The electrochemical oxidation of catechols in the presence of nucleophiles such as: ethanol, 2-thiobarbituric acid, b-diketones, 4-hydroxy-6-methyl-a-pyrone, dibuthylamine and diethylamine, 4-hydroxycoumarin, 3-hydroxycoumarin, alkanedithiol, 4,7-dihydroxycounarin and sulfunic acid were studied [4,11,12]. However, the use of anthraquinone modified carbon paste electrode in the determination of catechol has been seldom reported.
In this work, the use of carbon paste modified with anthraquinone as a sensitive electrochemical electrode was established for the determination of catechol using square wave voltammetry. Parameters such as pH of working solution, amount of modifier, frequency, amplitude and step potential were optimized to improve the method efficiency during the experiment. Furthermore, real sample of tea (Camellia sinensis L.) varieties green tea and black tea has been proven to produce a good response towards catechol.
2. EXPERIMENTAL
2.1. Reagents
All reagents and chemicals were of analytical grade. Catechol (Sigma Aldrich, Indian industries), graphite powder (BDH, UK), paraffin oil (FINE CHEM Industries, India), di-potassium phosphate and di-hydrogen phosphate (Fulka, Germany), anthraquinone (BDH chemicals Ltd., England) and ethanol alcohol (Changshu Yangyuan chemicals, China), NaOH (Labmerk chemicals, India) and HCl (Riedel-De Haen, Germany) were used during the experiment. Stock solution of catechol (0.10 mmol∙L−1) was prepared in 0.2 M phosphate buffer of pH 7.5. All experiments were carried out in phosphate buffer of (0.2 M, pH 7.5). The stock solution of catechol prepared was stored in the refrigerator to avoid exposure to air and light to keep its stability. All solutions and subsequent dilutions were prepared using de-ionized water.
2.2. Instruments and Apparatus
The voltametric experiments were performed using BAS-50 W potentiostat/galvanostat analyzer coupled with KTC personnel computer with conventional three electrode configuration consisting of working electrode (anthraquinone modified carbon paste), a silver-silver chloride reference electrode and a platinum wire serving as a counter electrode.
2.3. Preparation of Carbon Paste Electrode
The carbon paste electrode (CPE), first introduced by Adams [13], is one of the most commonly used electrodes. Carbon paste electrodes (CPEs) belong to a special group of heterogeneous carbon electrodes. It is a mixture prepared from carbon (graphite) powder and a suitable liquid binder packed into a suitably designed electrode body. Due to its low cost, ease of fabrication, high sensitivity and renewable surface, the CPE has been widely applied in the electroanalytical community [14]. To prepare carbon paste electrode for this experiment 70% (w/w) of graphite powder and 30% (w/w) of paraffin oil were mixed homogeneously for 20 minutes with a mortar and pestle. The homogenized mixture was kept in the refrigerator for 24 hrs, and then the paste was housed in a tip of an insulin syringe by introducing a conducting copper wire that extends between the tip and the back of the syringe.
2.4. Preparation of Anthraquinone Modified CPE
The modified electrode containing the following percentage ratio of graphite powder, anthraquinone and paraffin liquid were homogeneously mixed for 20 minutes to give a uniform paste. In the preparation of modified carbon paste electrode the following composition were prepared and tested. For 5% (w/w) Anthraquinone modified electrode; 67.5% (w/w) graphite powders and 27.5% (w/w) paraffin liquid was used. For 10% (w/w) Anthraquinone, 65% (w/w) graphite powder and 25% (w/w) paraffin liquid were utilized. And for 15% (w/w) Anthraquinone; 62.5% (w/w) graphite powders and 22.5% (w/w) paraffin liquid were mixed. Similarly, for 20% (w/w) Anthraquinone modified; 60% (w/w) graphite powder, and 20% (w/w) paraffin liquid were homogenized. After the modified paste was prepared, it was kept for 24 hrs in a refrigerator. The modified paste was introduced in to the tip of the syringe by removing part of the unmodified paste filled before as in Section 2.3. The electrode surface was polished on a clean smooth paper before use [15].
2.5. Real Sample Preparation
Two varieties of tea green and black from Wush Wush brand were taken from the Ethio Agri-CEFT factory Addis Ababa, Ethiopia, extracted and treated as indicated in reference [16]. Then it was quantified using square wave votammetry at optimized conditions.
Tea Sample Preparation by Infusion
Wush Wush tea samples such as green and black from Ethio Agri-CEFT were taken and 2 gm of tea infusion was made using hot (100˚C) de-ionized water. After filtering each infusion, 50 ml was taken and diluted with 100 ml of buffer solution (0.1 M Na2HPO4 + 0.1 M NaH2PO4) for analysis. This was to internalize the catechol amount in drinking tea, in a cup of tea.
3. RESULTS AND DISCUSSION
3.1. Electrochemical Behavior of Catechol
The electrochemical behavior of catechol was studied using cyclic voltammetry (CV) in 0.2 M phosphate buffer. Figure 1 shows cyclic voltammograms of anthraquinone modified CPE without catechol (curve a) and with standard catechol (curve b). The response in cyclic voltammograms during the experiment revealed that in case of unmodified carbon paste electrode, the oxidation peak was observed at 292 mV (figure not shown) during the anodic sweep. In the reverse scan, the reduction potential peak was at 226 mV.
The peak potential separation, which can indicate the reversibility behavior of the reaction, is very large (266 mV) at the unmodified carbon paste electrode, inferring the electron transfer reaction is slow. Under similar conditions, when anthraquinone modified CPE was used, the response of potential for of catechol redox system showed different behavior: The oxidation peak potential shifted negatively to 278 mV while the reduction peak potential shifted positively to 36 mV, which gives separation in potential of 251 mV at the anthraquinone modified carbon paste electrode, suggesting the electrochemical behavior of catechol with slight reversibility than before as one utilizes anthraquinone as modifier. This decrease in separation potential using modified CPE shows the catalytic activity of anthraquinone for catechol detection.
Quantification of catechol using anthraquinone modified CPE in a square wave voltammetry significantly increases the oxidation peak, attesting that anthraquinone modified CPE greatly improves the detection sensitivity for catechol (Figure 2). The magnitude of the signal (peak current) enhancement was found to be 22% (μA/ μA) times relative to the unmodified electrode. The enhancement in the peak current is due to the catalytic
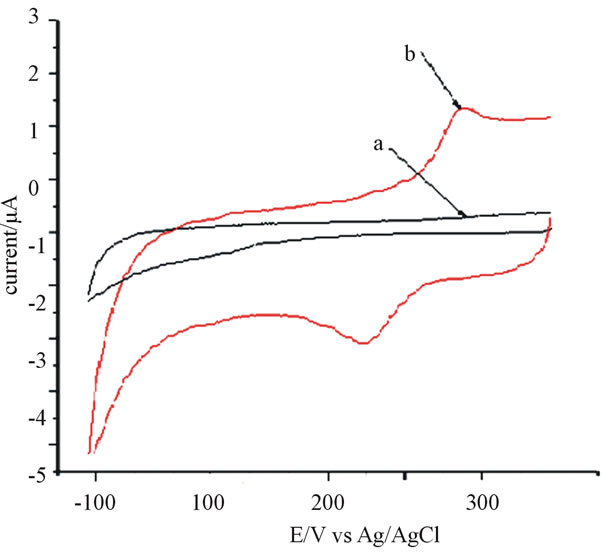
Figure 1. Cyclic voltamograms of anthraquinone (15%) modified CPE in 0.2 M phosphate buffer a) in the absence of catechol, b) in 80 μmol∙L−1 catechol. Scan rate = 100 mV∙s−1.
property of anthraquinone which considerably enhances the oxidation signal of catechol although its electric conductivity is poor since it is an organic compound [15,16].
3.2. Effect of pH
The influence of pH on the electrochemical reaction or response of catechol was examined using phosphate buffer of pH ranging between pH 5 to 9. The position and peak current for 80 μmol∙L−1 catechol in the investigated pH range is detailed in (Figure 3). As it is seen in the graph, beyond pH 7.5 the peak current decreases as the pH increases this may be due to o-benzoquinone can undergo a hydroxylation reaction. Further in more alkaline solution (e.g., pH 9.0) it is thus suggested that the oxidation of catechol is due 1,4-Michael addition reaction with
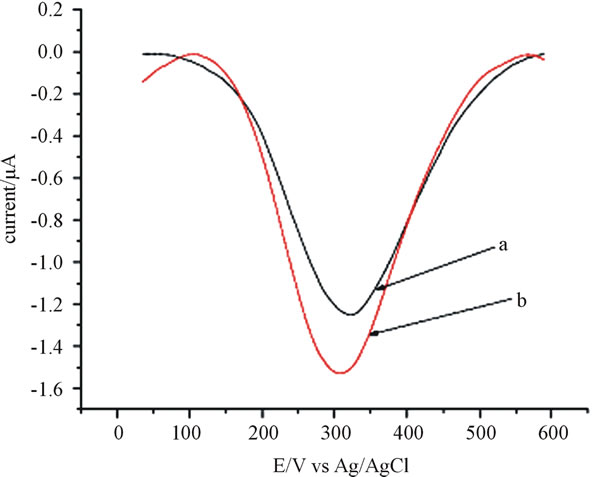
Figure 2. Square wave voltamogram of 70 µmol∙L−1 catechol in 0.2 M phosphate buffer a) unmodified CPE, b) anthraquinone modified (15%) CPE, frequency 25 Hz, amplitude 55 mV and step potential 5 mV.
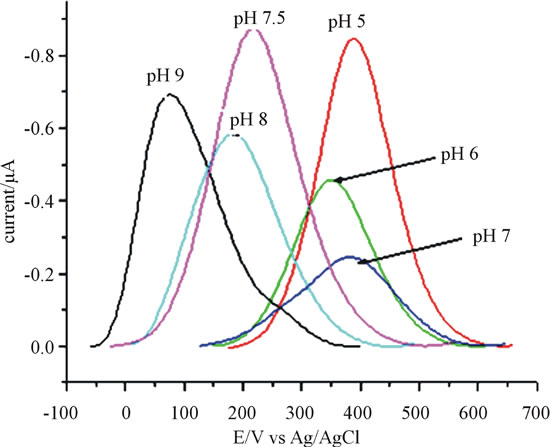
Figure 3. Square wave voltammograms on the effect of pH with anthraquinone (10%) modified CPE for 80 μmol∙L−1 catechol. Frequency 15 Hz, amplitude 25 mV and step potential 4 mV.
hydroxyl ion which can complicate the catalytic mechanism [17,18].
3.3. Optimization of Square Wave Parameters
3.3.1. Effect of Square Wave Frequency
As it is shown in Figure 4, it was found that the catechol signal increased as the frequency increased from 10 Hz to 100 Hz; however, during the square wave run beyond 25 Hz at potential around 245 mV the peak current still showed increment though not considerable.
As it is seen in (Figure 5), the peak current increased linearly up to 25 Hz as the frequency was increased. Af-
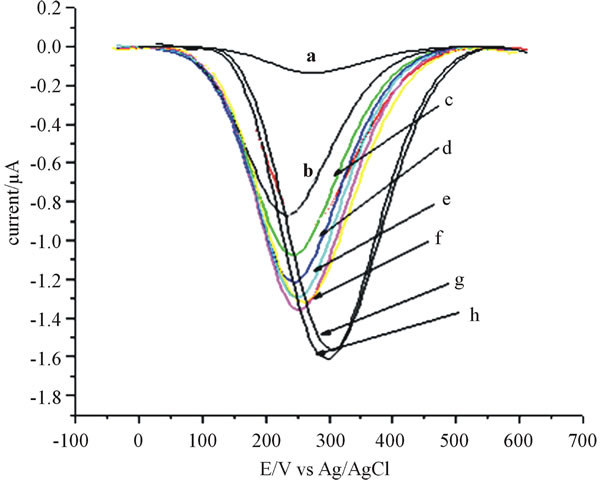
Figure 4. Square wave voltammograms showing the effect of frequency on the responses for catechol (80 μmol∙L−1) using 10 % modifier. a) at 10 Hz, b) at 15 Hz, c) at 25 Hz, d) at 30 Hz, e) at 35 Hz, f) at 40 Hz, g) 65 Hz, h) at 70 Hz. Amplitude of 25 mV and step potential set at 4 mV.
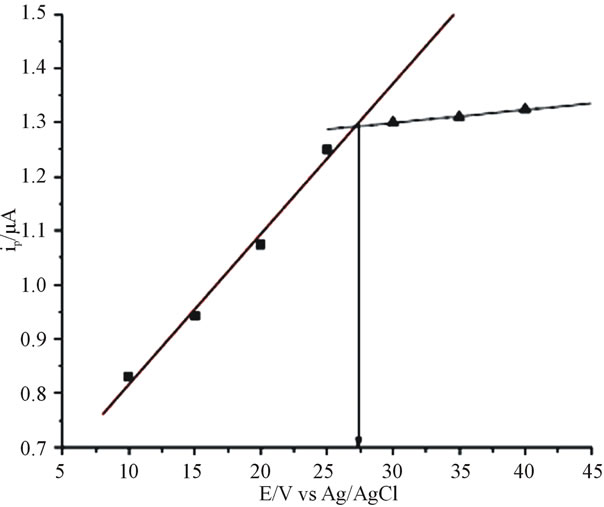
Figure 5. Variation of peak current with the square wave frequency using anthraquinone (10%) modified CPE in catechol (80 μmol∙L−1). Amplitude 25 mV, step potential 4 mV.
terwards frequency increment was slight losing its linear relation. As a result 25 Hz was selected as optimal for further analysis.
3.3.2. Effect of Square Wave Amplitude
The effect of square wave amplitude on the current response was studied by varying the square wave amplitude from 10 to 70 mV at the frequency of 25 Hz and a step potential of 5 mV. The result showed that as the amplitude was increased from 10 to 55 mV consequently the increase in peak current was observed. Whereas as the amplitude was further increased from 55 mV the peak current slightly decreased as it is indicated in (Figure 6) suggesting 55 mV was best for quantifying catechol.
3.3.3. Effect of Square Wave Step Potential
As it is indicated in (Figure 7), upon increasing the step potential of the system, an increase in peak current was observed up to 5 mV then after the peak current declined slightly. Hence square wave step potential of 5 mV was chosen as optimal condition for the subsequent experiment.
3.3.4. Effect of Modifier Composition
The construction of electrodes by incorporating an electroactive substance into a carbon paste matrix was first reported by Kuwana in (1964) and has been extensively applied till now for the determination of trace amount of elements, preparation of biosensors, and evaluation of electrochemical processes and investigation of electrocatalytic mechanisms [14,19]. The paste composition strongly affects the electrode reactivity, with the increase in pasting liquid content decreasing the electron transferrates [10,13]. The result in Figure 8 explains the
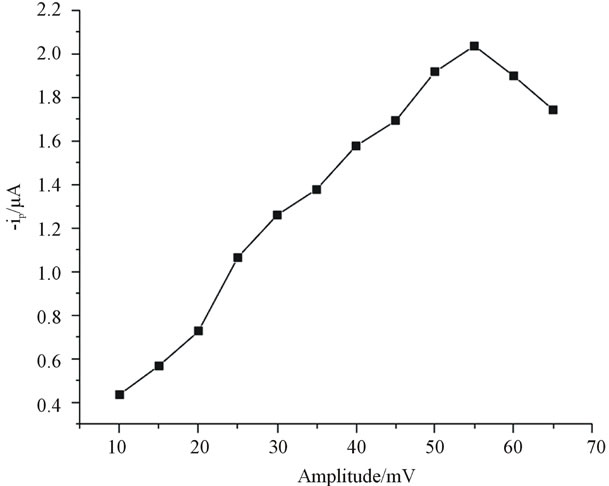
Figure 6. Impact of square wave amplitude on the peak current using 15% anthraquinone modified electrode for 70 µmol∙L−1 catechol. Frequency 25 mV and step potential 5 mV.
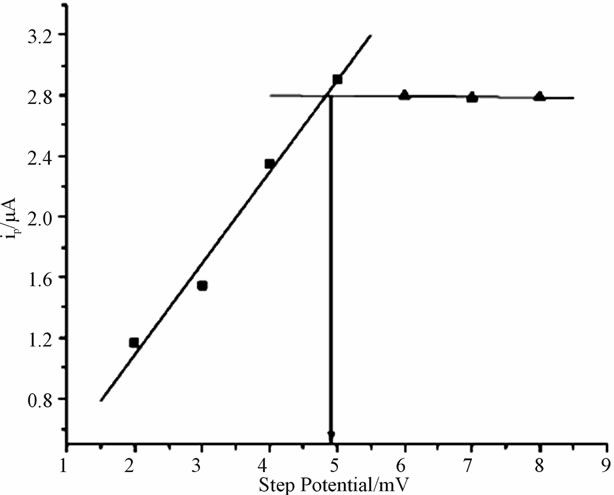
Figure 7. Dependence of peak current on square wave step potential using anthraquionone (10%) modified electrode for 80 μmol/L catechol.
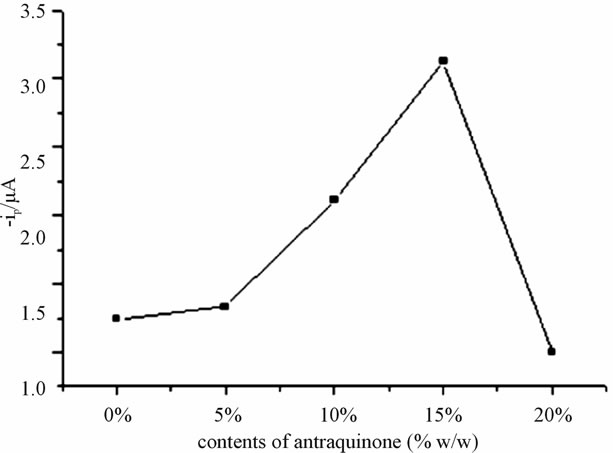
Figure 8. The effect of amount of anthraquinone (modifier) on the oxidation peak current of 80 μmol∙L−1 catechol. Frequency 25 Hz, amplitude 55 mV, step potential 5 mV.
oxidation peak current as function of modifier composition (amount of anthraquinone (% w/w)) considerably enhances the oxidation signal of catechol. When the content of anthraquinone was increased from 0% to 15% (w/w), with the selected data sets (points) current output showed an increment this is supported by literatures in the detection of catechol amine [20] whereas with further increasing the modifier amount from 15% to 20% (w/w), the oxidation peak current decreased leading 15% to be optimal working condition for the experiment.
3.4. Repeatability, Reproducibility and Stability of Modified Carbon Paste Electrode
In this experiment, reproducibility was investigated by considering three modified electrodes prepared independently by taking triplicate measurements using the three electrodes. The reproducibility expressed in relative standard deviation was found to be 3.65% for 80 μmol∙L−1 catechol solution. To characterize the repeatability of anthraquinone modified CPE, seven successive determinations of 80 μmol∙L−1 standard catechol was made. The result of seven repetitive measurements showed that the relative standard deviation (RSD %) was 3.4 which revealed an excellent repeatability. During the experiment, there has been no significant difference in the peak current responses for the same electrode over a period of three months tested by setting the modified electrode in the refrigerator after trial.
3.5. Calibration Plots for Catechol
Using the optimal square wave parameters described the calibration curve for the determination of catechol concentration was established. The peak height for catechol was found to increase with increasing concentration from 6 to 80 μmol∙L−1 (Figure 9) for eight average data points (n = 8). As it is indicated using the numerical value of coefficient of variation for this experiment, the data sets showed a good linear fit because the value of R is approaching positive one (0.998).
3.6. Analysis of Catechol in Tea Samples
To predict presence of catechol in the green tea, subsequent runs of square wave have been made with diluted extract of green tea and standard catechol added onto a diluted green tea extract. Current responses were recorded after each run that is only green tea and after 1 ml of 60 μmol×L−1 catechol addition.
Peak current enhancement was found on nearly similar potential and with almost same band shape suggesting the presence of catechol in tea sample. This situation has been delineated in (Figure 10).
The content of catechol was determined using interpolation, and the result is given in the Table 1 by comparing detection of catechol with other methods. The sample was determined in triplicate and found higher amount in green tea than in black Wush Wush tea. This might be evidenced by part that catechol my get oxidized during the process of the tea in the factory.
The amount of sample catechol determined using hot water infusion for Wush Wush tea was found to be two magnitudes less than the one obtained by the water: ethanol extraction (Table 2). This indicates that catechol is slightly soluble in water as compared to ethanol. This phenomenon was explained by Adam et al. [9].
Catechol determination using different methods are possible. Here Table 1 under is a comparison of different parameters found during catechol detection as detailed in
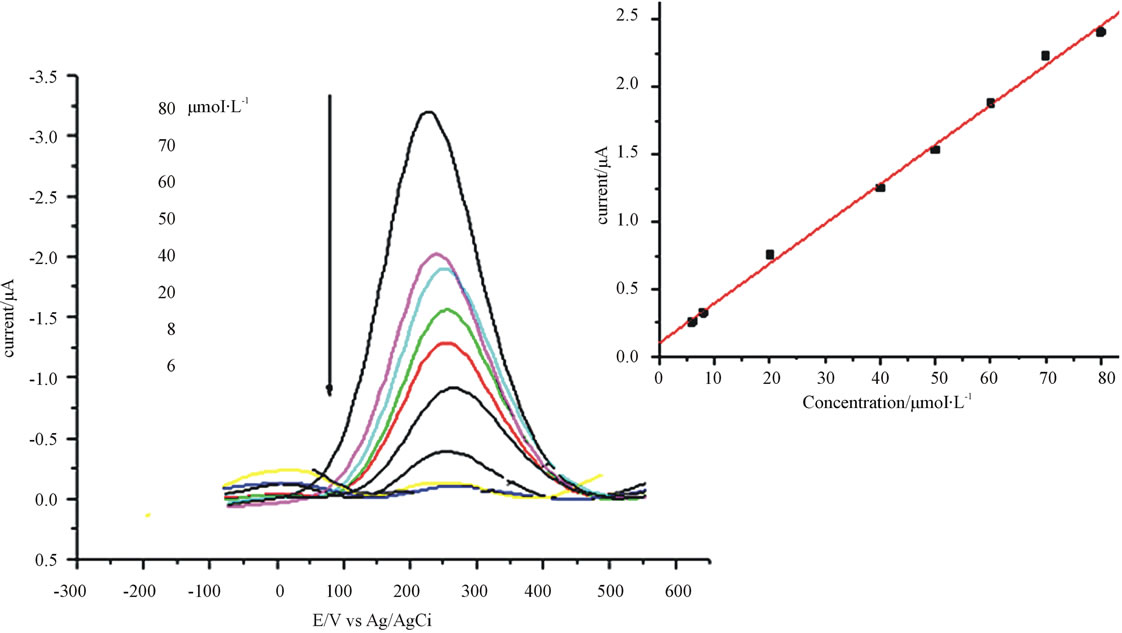
Figure 9. Square wave voltammograms for anthraquinone modified electrode containing different concentration of catechol. Frequency 25 mV, amplitude 55 mV and step potential 5 mV.
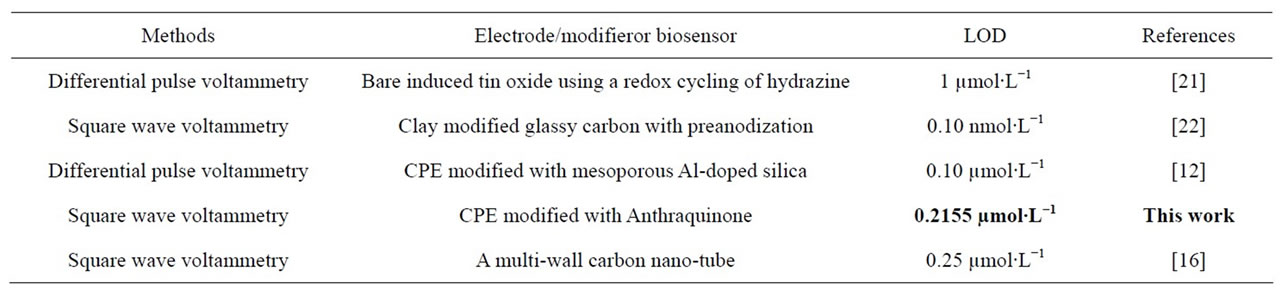
Table 1. Comparison of the different methods of catechol determination.
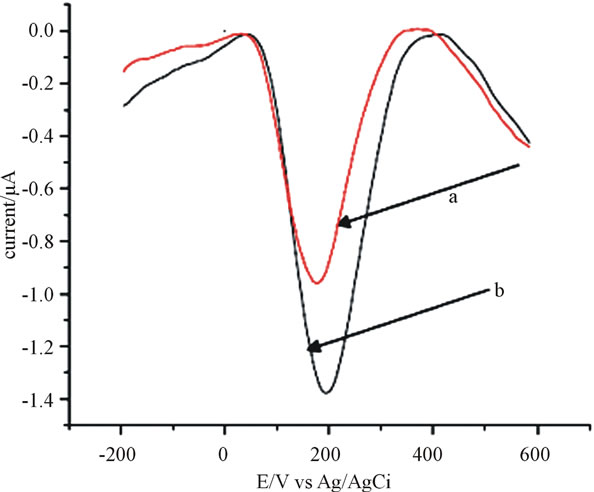
Figure 10. Peak current enhancement upon addition of standard catechol to tea sample a) only green tea b) After addition of 1 ml of 60 μmol∙L−1 catechol at anthraquinone (15%) modified CPE. Frequency 25 Hz, amplitude 55 mV, step potential 5 mV.
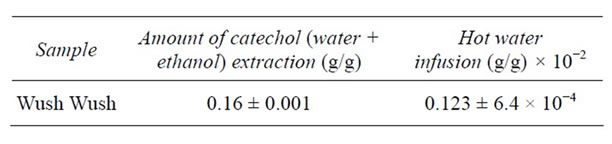
Table 2. Determination of catechol in Wush Wush tea sample in different extraction solvent.
the corresponding references given.
4. CONCLUSION
In general, electrochemical analysis employing anthraquinone modified CPE has been developed for the determination of catechol with the detection limit of 2.155 × 10⁻⁷ mol∙L−1. This system is useful for determination of catechol and it derivatives from beverages like tea. The system has excellent reproducibility, repeatability and high sensitivity. This work can be extended to the use of other modifiers or similar quinines to apply for the determination of catechol in tea and other food samples. The method is simple, rapid and applicable in routine analysis. To exclude potential interferences in environmental and food analysis, the electrochemical determination of catechol can be integrated with separation techniques such as chromatography. And this remains as the researchers future work or for other researchers interesting in the area.
5. ACKNOWLEDGEMENTS
The authors would like to thank the Addis Ababa University, department of chemistry for financial and material support and jimma university, for academic sponsor during the research work.
![]()
![]()
REFERENCES
- Kilmartin, P.A. and Chyong, F.H. (2003) Characterisation of polyphenols in green, oolong, and black teas, and in coffee, using cyclic voltammetry. Food Chemistry, 82, 501-512. doi.org/10.1016/S0308-8146(03)00066-9
- Sun, Y.-G., Cui, H., Li, Y.-H. and Lin, X.-Q. (2000) Determination of some catechol derivatives by a flow injection electrochemiluminescent inhibition method. Talanta, 53, 661-666. doi.org/10.1016/S0039-9140(00)00550-6
- Abolfazl, K., Raoof, J.-B., Davood, N. and Reza O. (2005) Electrochemical study of catechol in the presence of dibuthylamine and diethylamine in aqueous media: Part 1. Electrochemical investigation. Electroanalysis, 17, 1755- 1760. doi:10.1002/elan.200503279
- Nina, S., Alexander, J.B., Zehnder, R. and Eggen, I.L. (2001) Chemical properties of catechols and their molecular modes of toxic action in cells, from microorganisms to mammals. Environmental Microbiology, 3, 81-91.
- Marjorie, M.C. (1999) Plant products as antimicrobial agents. Clinical Microbiology Reviews, 12, 564-582.
- Fernandes, S.C., de Barros Osório, R.El-H.,M., dos Anjos, A., Neves, A., Micke, G.A. and Vieira, I.C. (2008) Determination of catechin in green tea using a catechol oxidase biomimetic sensor. Journal of the Brazilian Chemical Society, 19, 1215-1223. doi:10.1590/S0103-50532008000600024
- Zen, J.-M., Chung, H.-H. and Kumar, A.S. (2002) Biosensors and modern biospecific analytical techniques. Analytical Chemistry, 74, 1202. doi:10.1021/ac011012l
- Mouayed, Q., Al-Abachi and Muneer, A.A.-D. (2005) Spectrophotometric determination of catechol amine drugs in pharmaceutical preparations via oxidative coupling reaction with 3-amino pyridine and sodium periodate. National Journal of Chemistry, 18, 226-234.
- Figueiredo, E.C., Tarley, C.R.T., Kubota, L.T., Rath, S. and Arruda, M.A.Z. (2007) On-line molecularly imprinted solid phase extraction for the selective spectrophotometric determination of catechol. Microchemical Journal, 85, 290-296.
- Lin, H., Gan, T. and Wu, K. (2009) Sensitive and rapid determination of catechol in tea samples using mesoporous Al-doped silica modified electrode. Food Chemistry, 113, 701-704. doi:10.1016/j.foodchem.2008.07.073
- Maoguo, L., Fang, N., Yinling W., Shudong X., Dandan Z., Shuihong C. and Lun, W. (2009) Sensitive and facile determination of catechol and hydroquinone simultaneously under coexistence of resorcinol with a Zn/Al layered double hydroxide film modified glassy carbon electrode. Electroanalysis, 21, 1521-1526. doi:10.1002/elan.200804573
- DuVall, S.H. and McCreery, R.L. (2000) Self-catalysis by catechols and quinones during heterogeneous electron transfer at carbon electrodes. Journal of the American Chemical Society, 122, 6759-6764. doi:10.1021/ja000227u
- Adams, R.N. (1969) Electrochemistry at solid electrodes. Marcel Dekker, New York
- Su, L, and Mao, L. (2006) Gold nanoparticle alkanedithiol conductive films self-assembled onto gold electrode: Electrochemistry and electroanalytical application for voltammetric determination of trace amount of catechol. Talanta, 15, 68-74. doi:10.1016/j.talanta.2006.01.015
- Manisankar, P. and Gomathi, A. (2005) Electrocatalytic reduction of dioxygen at the surface of carbon paste electrodes modified with 9,10-anthraquinone derivatives and dyes. Electroanalysis, 17, 1051. doi:10.1002/elan.200403213
- Qi, H. and Zhang, C. (2005) Simultaneous determination of hydroquinone and catechol at a glassy carbon electrode modified with multiwall carbon nanotubes. Electroanalysis, 17, 832-838. doi:10.1002/elan.200403150
- March, J. (1992) Advanced organic chemistry. John Wiley & Sons, New York, 261.
- Reza, O., Raoof, J.-B., Rahman, H. and Ali, A. (2008) Electrochemical oxidation of catechol in the presence of dimethyl chloromalonate and its digital simulation. Asian Journal of Chemistry, 20, 5863-5872.
- Sheng-Ming, W., Wan-Yu, S. and Shu-Hua, C. (2010) A simultaneous and sensitive determination of hydroquinone and catechol at anodically pretreated screen-printed carbon electrodes. International Journal of Electrochemical Science, 5, 1649-1664.
- Naseri, A. and Majidi, M.R. (2011) Cheap and easy modification of glassy carbon electrode for voltammetric determination of dopamine in the presence of ascorbic acid. DARU, 19, 271-276.
- Aziz, Md.A., Selvaraju, T. and Yang, H. (2007) Selective determination of catechol in the presence of hydroquinone at bare indium tin oxide electrodes via peak-potential separation and redox cycling by hydrazine. Electroanalysis, 19, 1543. doi:10.1002/elan.200703905
- Jyh-Myng, Z. and Ping-Jyh, C. (1998) An ultrasensitive voltammetric method for dopamine and catechol detection using clay-modified electrodes. Electroanalysis, 10, 12-15. doi:10.1002/(SICI)1521-4109(199801)10:1<12::AID-ELAN12>3.0.CO;2-5