Natural Science
Vol.5 No.3(2013), Article ID:29021,8 pages DOI:10.4236/ns.2013.53046
Water loss in Mafraq Governorate, Jordan
![]()
1Department of Civil, Environmental and Natural Resources Engineering, Lulea University of Technology, Lulea, Sweden; *Corresponding Author: Nadhir.alansari@ltu.se
2Department of Business Administration, Al Al-Bayt University, Mafraq, Jordan
Received 11 January 2013; revised 14 February 2013; accepted 27 February 2013
Keywords: Mafraq; Water Loss; Jordan; Administrative Loss; Technical Loss
ABSTRACT
Jordan is located in the Middle East and covers an area of 89,342 km2. The total population of Jordan is 6,508,271. Jordan is rapidly facing a severe water supply crisis due to greater demands on a finite quantity of available water. If current trends continue, it has been estimated that the country will experience a chronic water shortage by 2020. Despite these shortages, water loss in the distribution network is relatively high where it reaches 46%. Mafraq Governorate has the maximum water loss. Continuous records and data for the period 1999-2004 for Mafraq water authority were investigated for the water supply and lose. Water losses were evaluated, and suggestions were given to minimize the loss.
1. INTRODUCTION
Jordan is located in the Middle East and shares borders with Iraq, Syria, Saudi Arabia, and Israel and covering an area of 89,342 km2 (Figure 1). The population of Jordan reaches 6,508,271 with an annual increase of about 128,152. Jordan is rapidly facing a severe water supply crisis brought about by an ever-increasing population placing greater demands on a finite quantity of available water (see Figure 1). The fundamental importance of water cannot be overstated. The supply of fresh potable water is essential to life, socioeconomic development, and political stability in the region. The need for a rationalized holistic management of this most vital natural resource is paramount in order to attain a sustainable society.
If current trends continue, it has been estimated that the country will experience a chronic water shortage by 2020. Although a significant scope exists to reduce the demand deficit through systematic changes to the current management, extraction, and distribution regimes, they will not be sufficient for fully satisfy the requirements; hence a need to look beyond conventional water sources is critical.
The water shortages experienced by the country of Jordan are well documented [1-3]; and the extent to which this is forecasted to worsen has also been offered a considerable attention at a national political level [4]. Various international seminars, reports, and publications have suggested a plethora of alternatives to mitigate the current and predicted future situation.
Jordan’s projected water demand is increasing with time, and it was been reported by the Ministry of Water and Irrigation (MWI) that it would reach 408 MCM in 2020 [5]. Meanwhile, the World Bank [6] estimated that water deficit in Jordan will reach 360 MCM in 2004 [5].
Despite the shortages in Jordan’s water resources there, is a high percentage of water loss (see Table 1) [6]. The overall water loss reaches 122,359,974 m3, indicating that loss are 46.58% (see Table 2). The records of the Jordanian MWI indicate that Mafraq Governorate has the highest percentage of water loss (see Table 3).
Average rainfall in Jordan reaches 23 mm. It might exceed 450 mm in north west and reaches less than 50 mm in the desertic area (Figure 2). In Mafraq Governorate, the average annual rainfall reaches 132 mm.
In this research, water loss in Mafraq Governorate was been investigated. To study the causes, six years of continuous and reliable records were used (1999-2004). Sources and types of loss had been identified. Solutions are given to minimize these losses.
2. WATER PUMPING AND SUPPLY IN MAFRAQ
Mafraq Governorate covers an area of 26,541 km2, and its population reaches 275,000. Water authority in Mafraq supplies the water for Mafraq Governorate and other neighboring Governorates. This implies that the length of the water supply pipe lines reaches about 10,000 km. Water is pumped from 91 wells. Figure 3 shows the quantities of water pumping for the period 1999-2004.
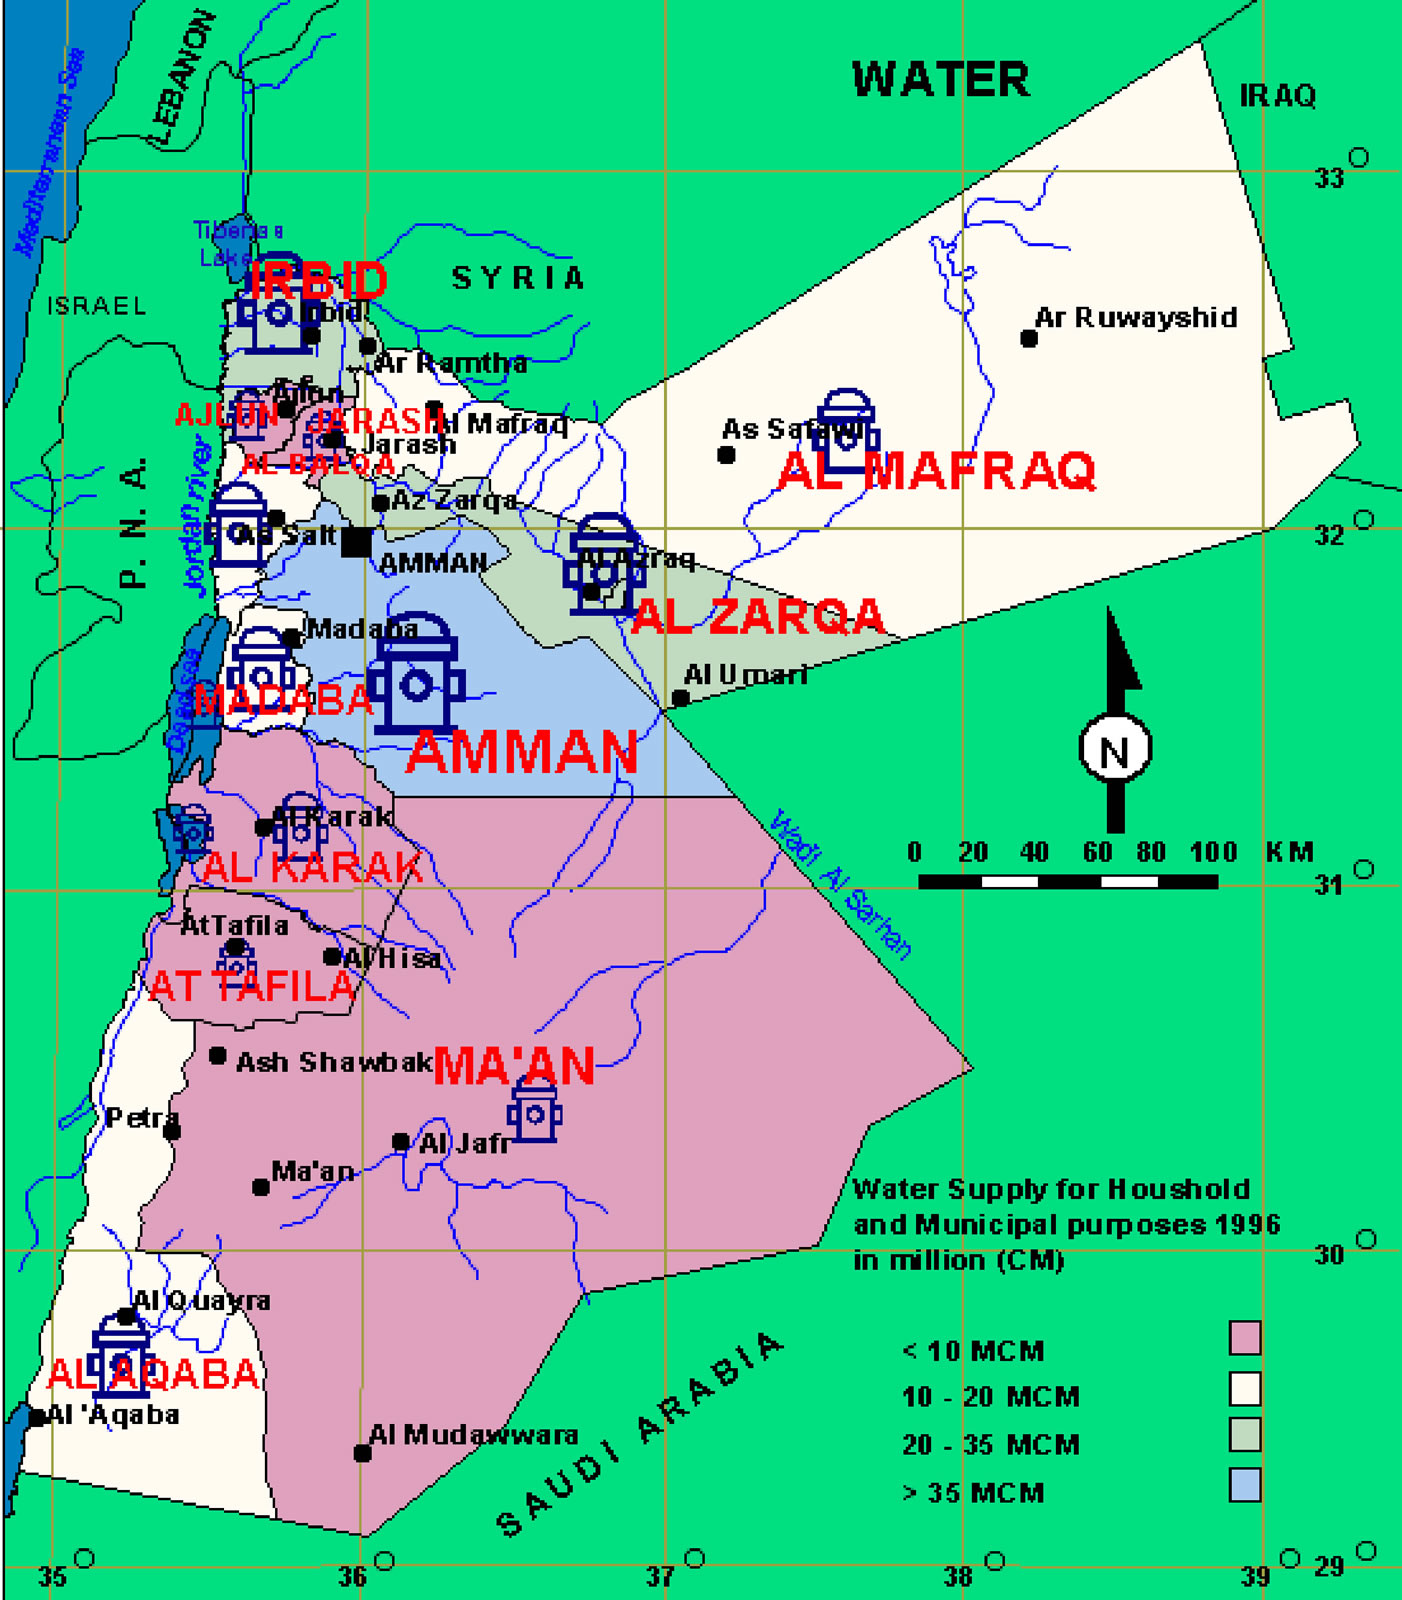
Figure 1. Map of Jordan highlighting the water resources available in each region.
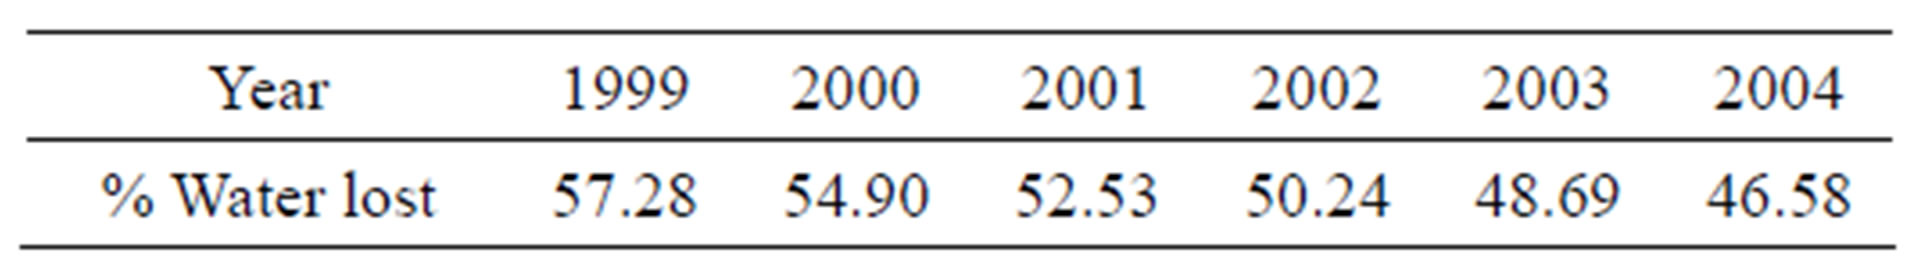
Table 1. Water loss in Jordan [7].
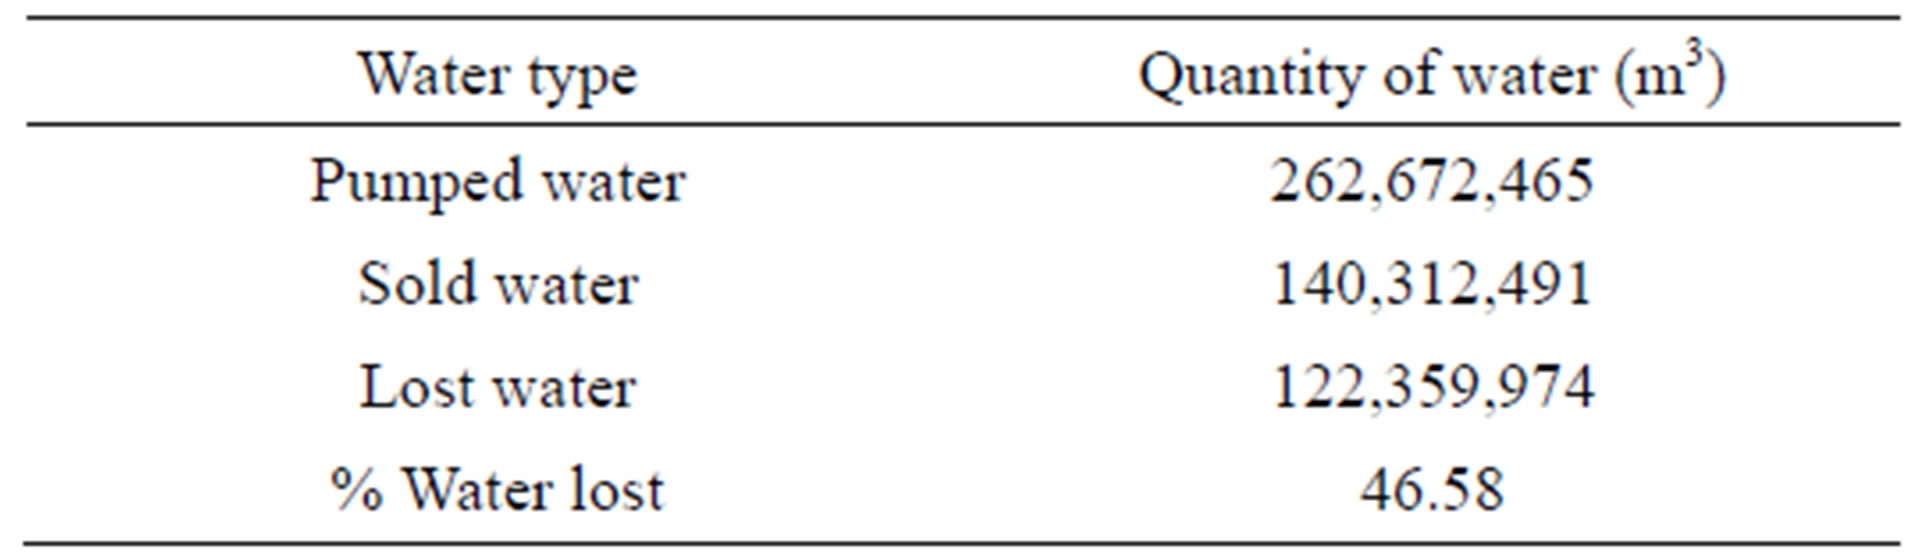
Table 2. Water loss in Jordan for the year 2004 [7].
During this period, the pumping of water from the wells reached 210,311,351 m3 with an annual average of 35,051,891 m3 (see Figure 3). It is evident that water pumping in 2003 was the lowest for the studied period. This is due to the fact that during that year, part of Mafraq water production department was split in two parts: the Badia and Mafraq. Due to the hot weather, water pumping increases during summer months (see Figure 4).
It should be mentioned however, that in addition to the water supplied through the wells in Mafraq, there is other sources which come from Zarqa city (see Table 4). The
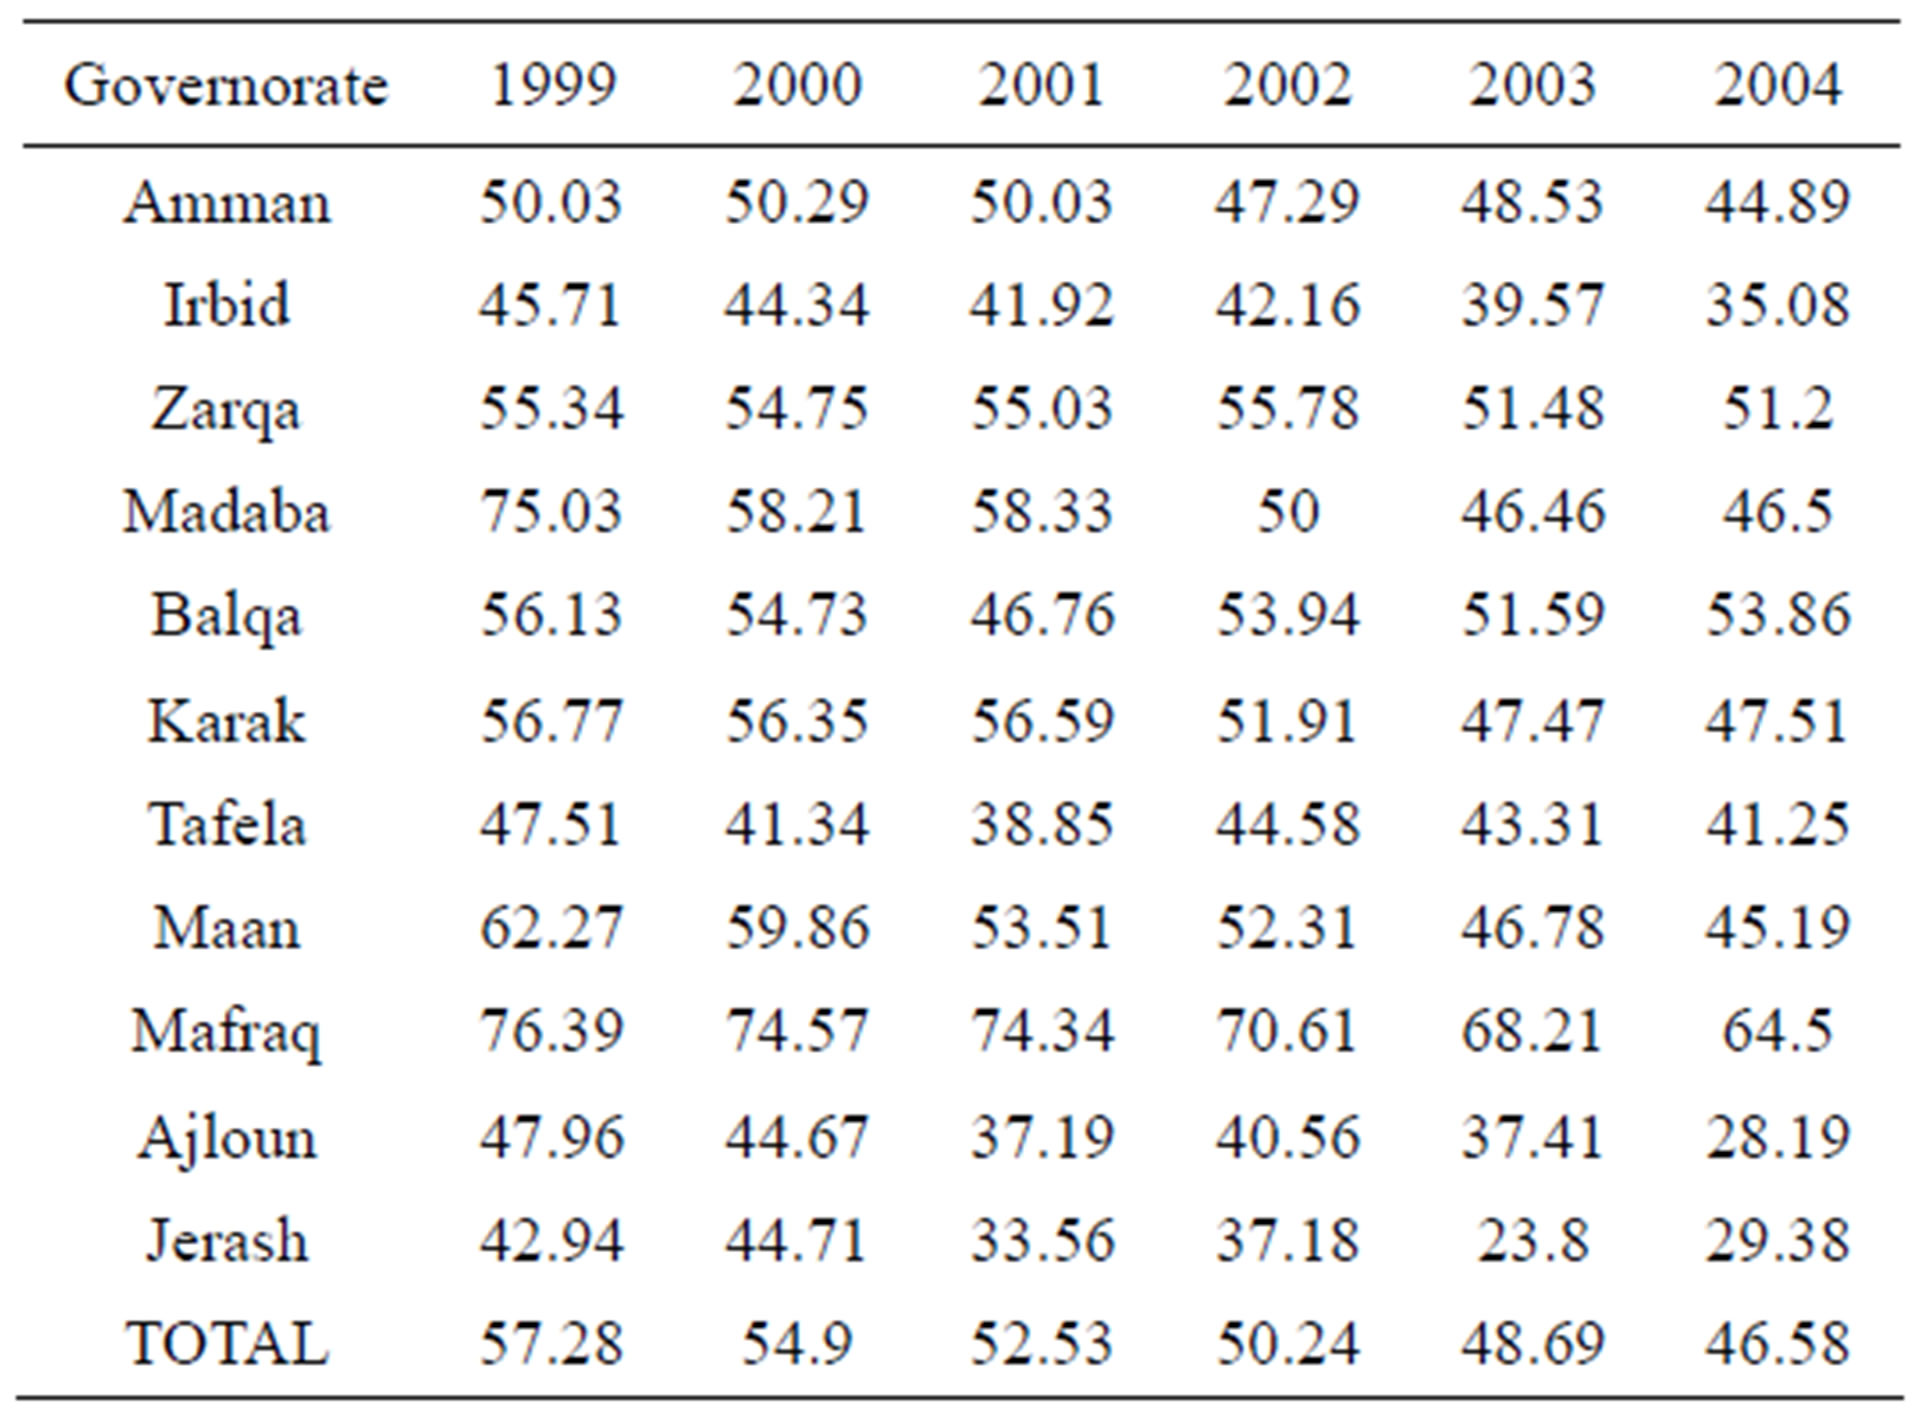
Table 3. Percent water loss in different governorates of Jordan (1999-2004) [6].
average annual supply is 161,366 m3, and the total water supplied during the studied period was 968,200 m3. It should be mentioned however that the water supply was stopped for the period of October 2000 to April 2001 due to the pollution of the source.
The average annual quantities of water exported from Mafraq Governorate to other Governorates were
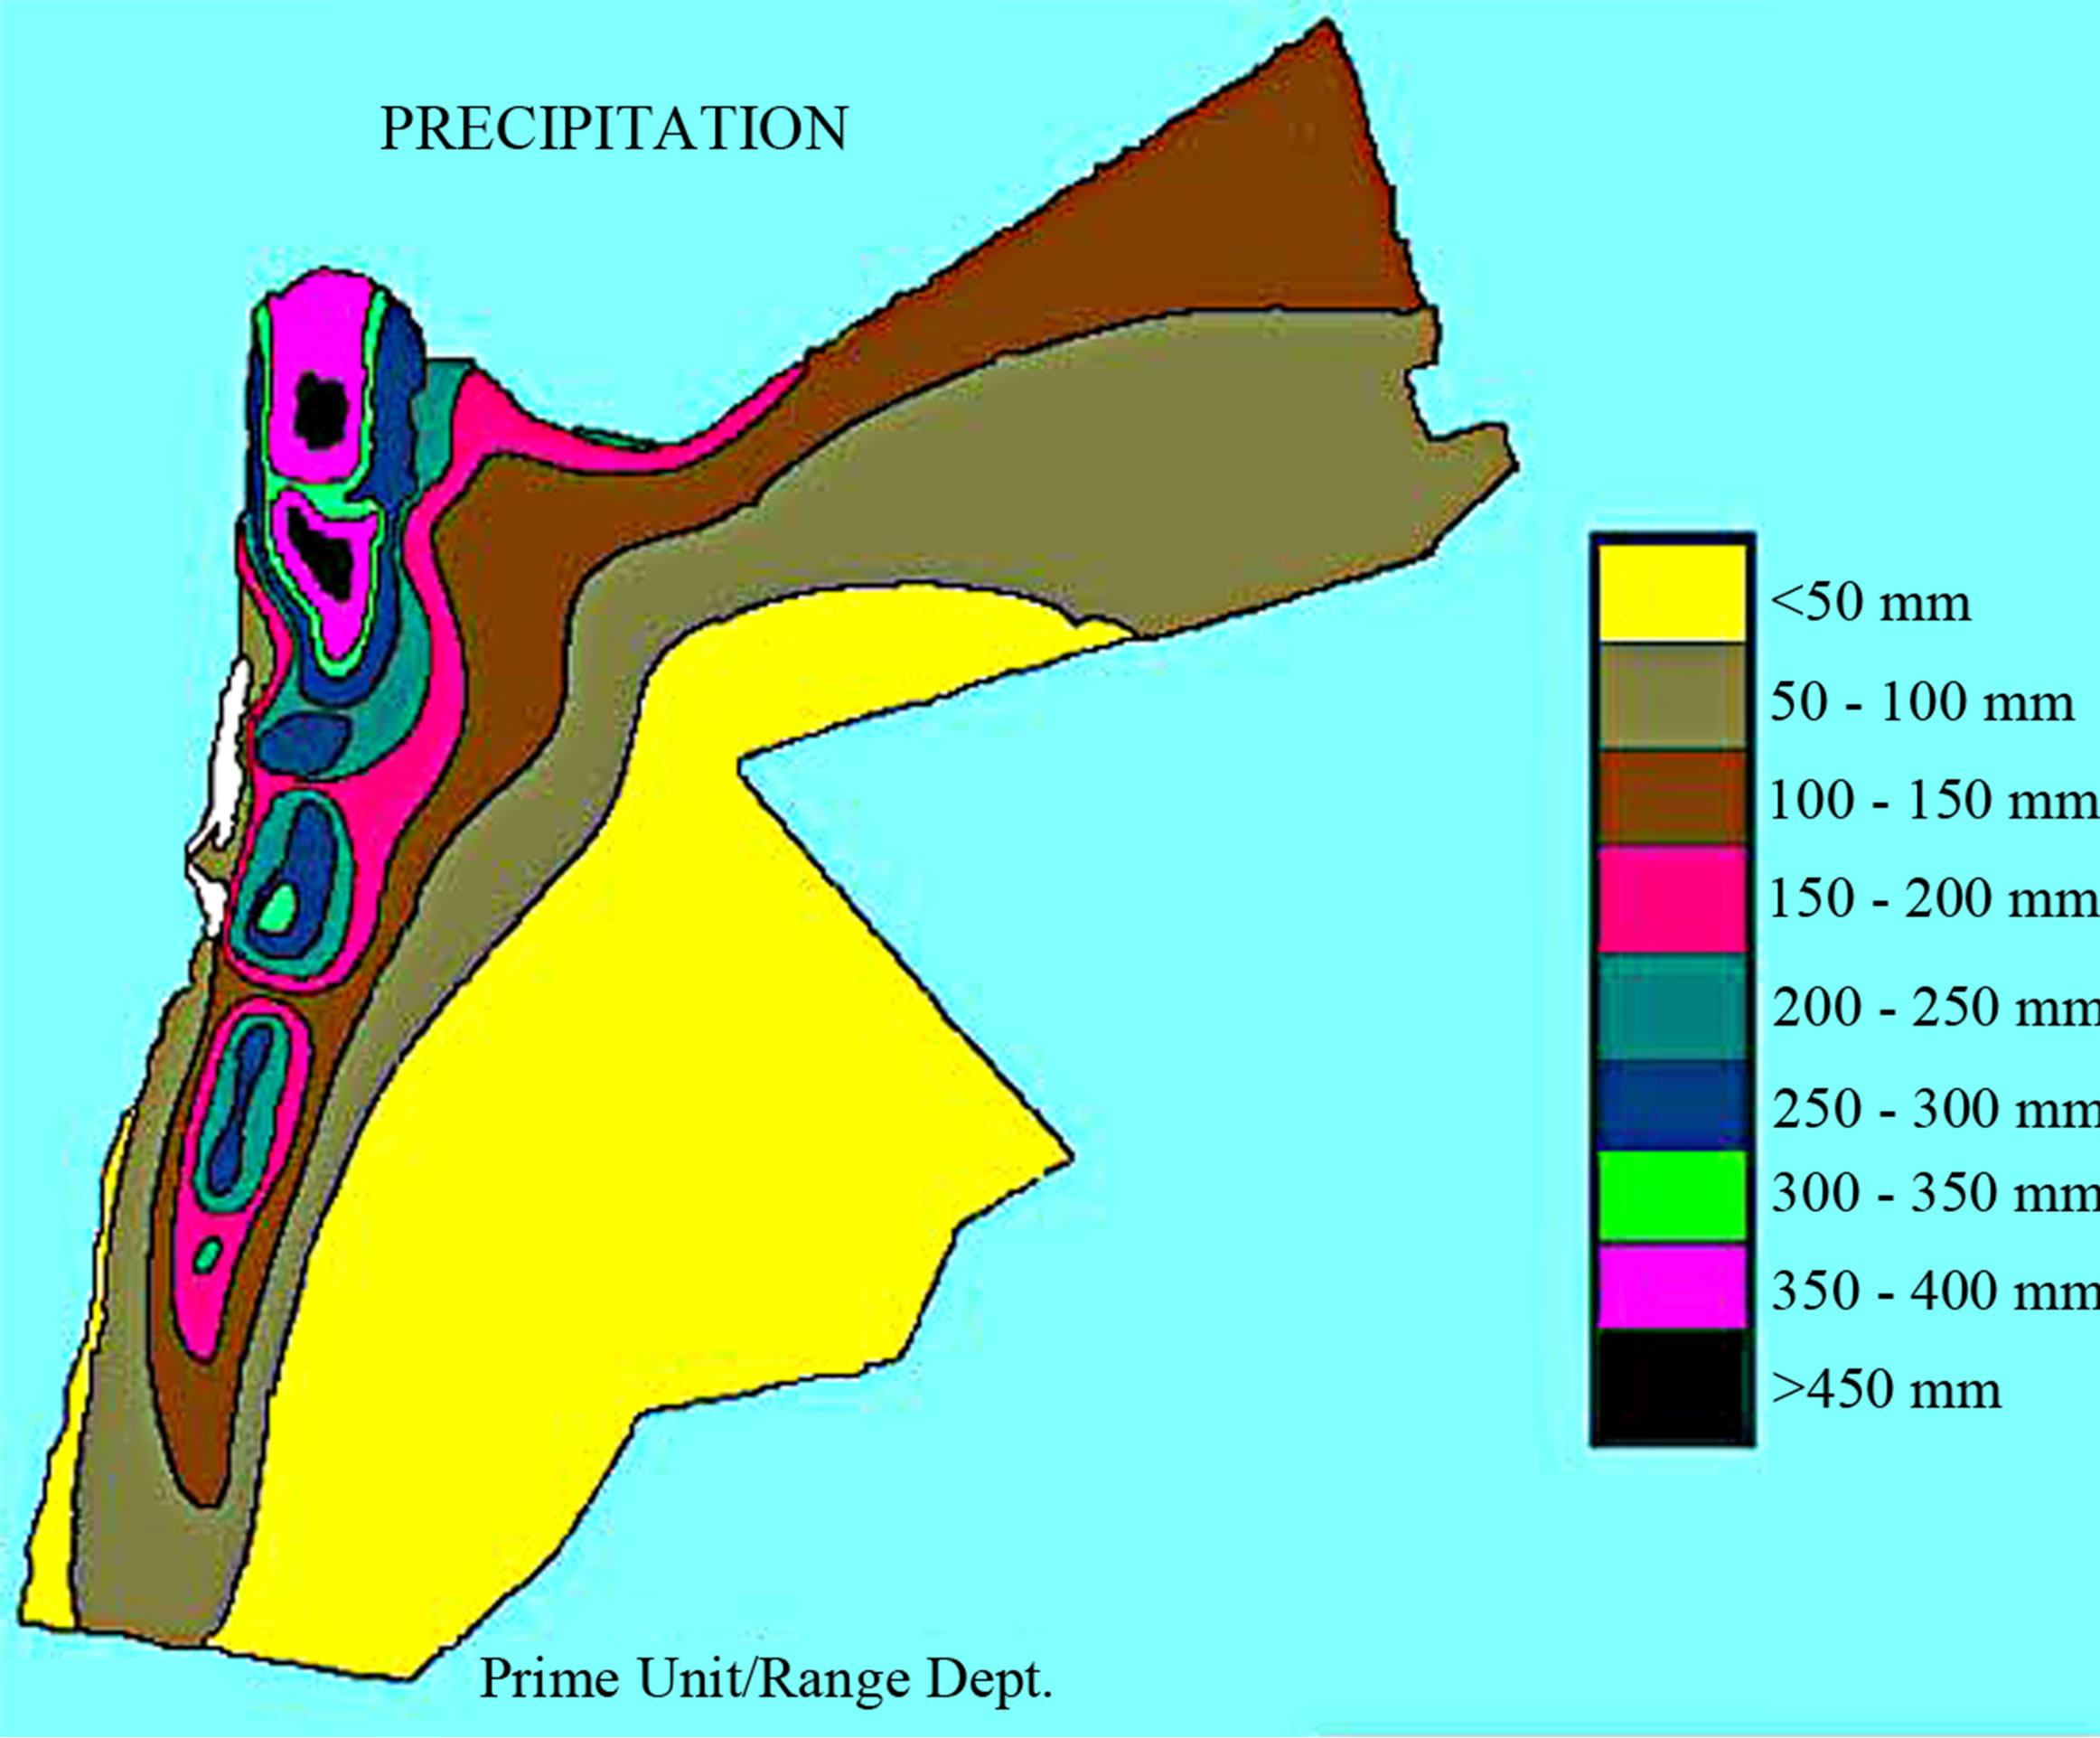
Figure 2. Average annual rainfall in Jordan.
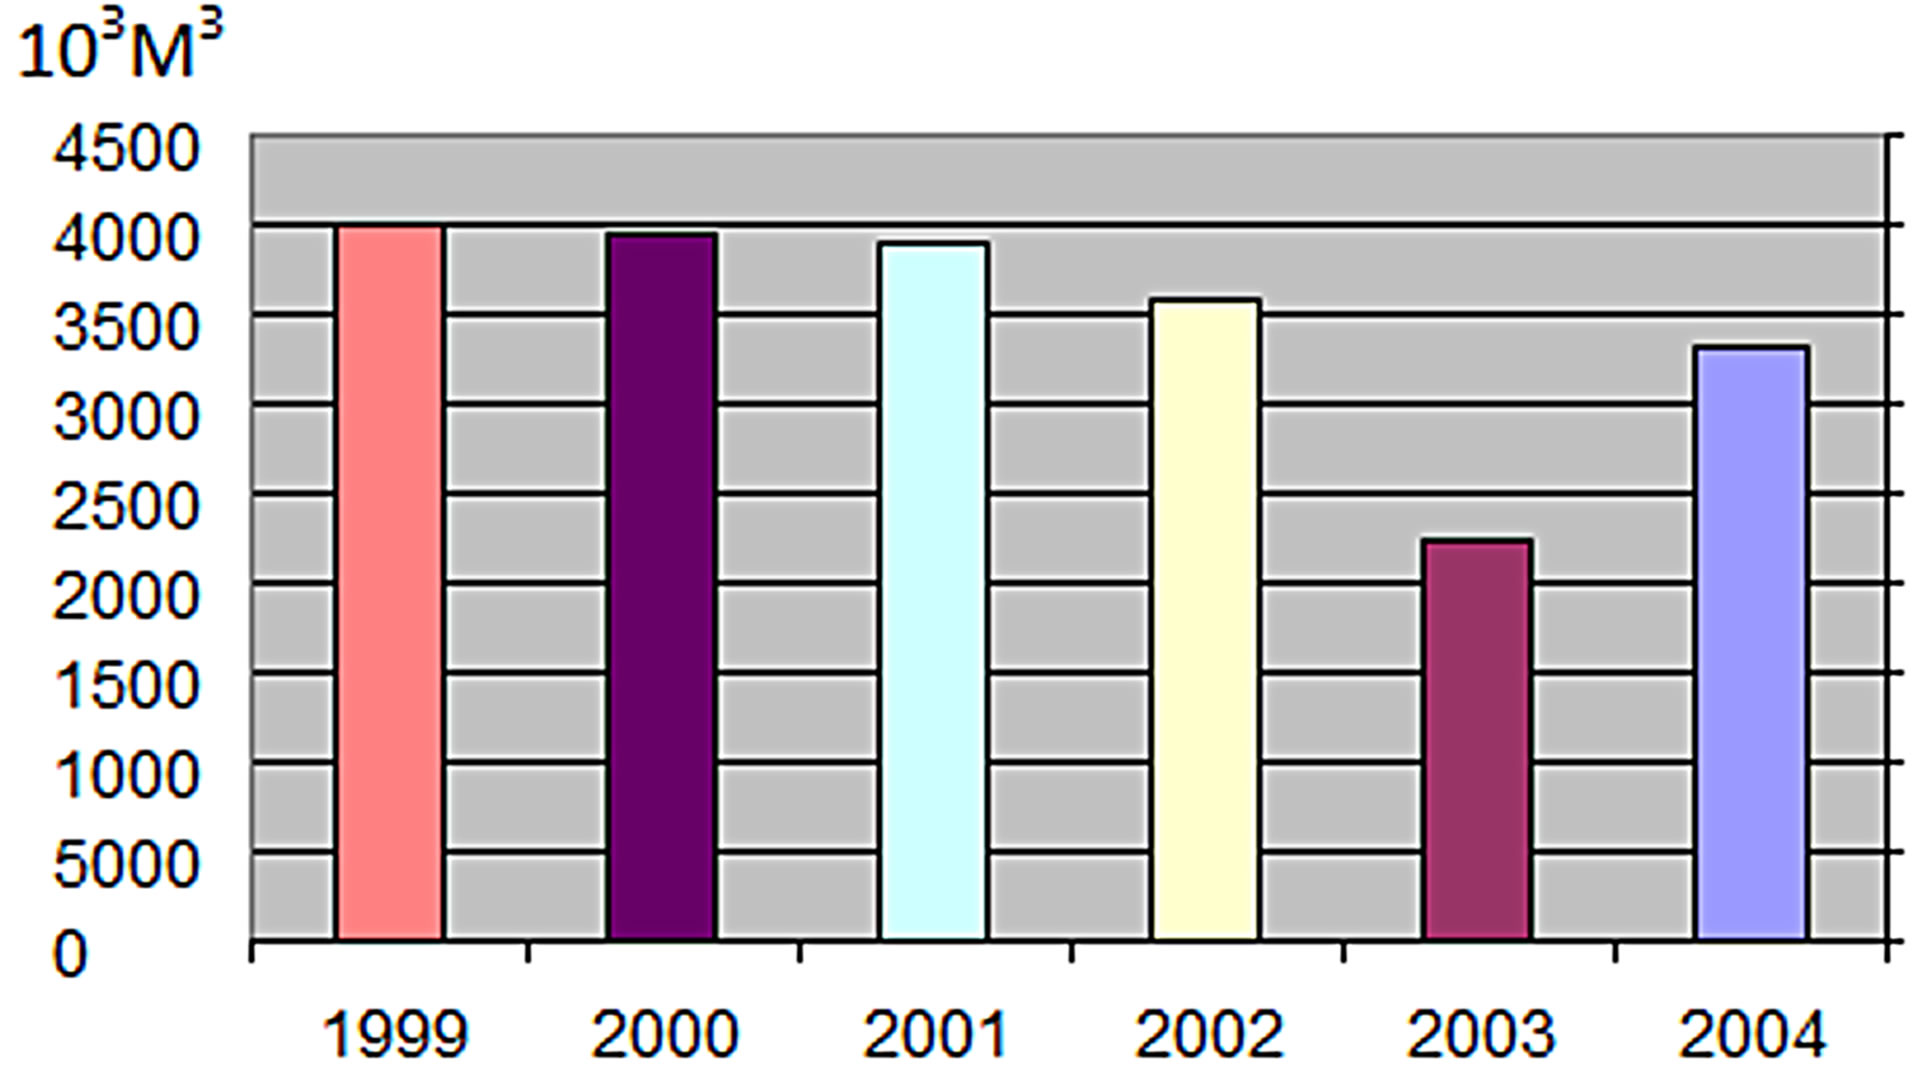
Figure 3. Water supply of wells in Mafraq Governorate (1999- 2004).
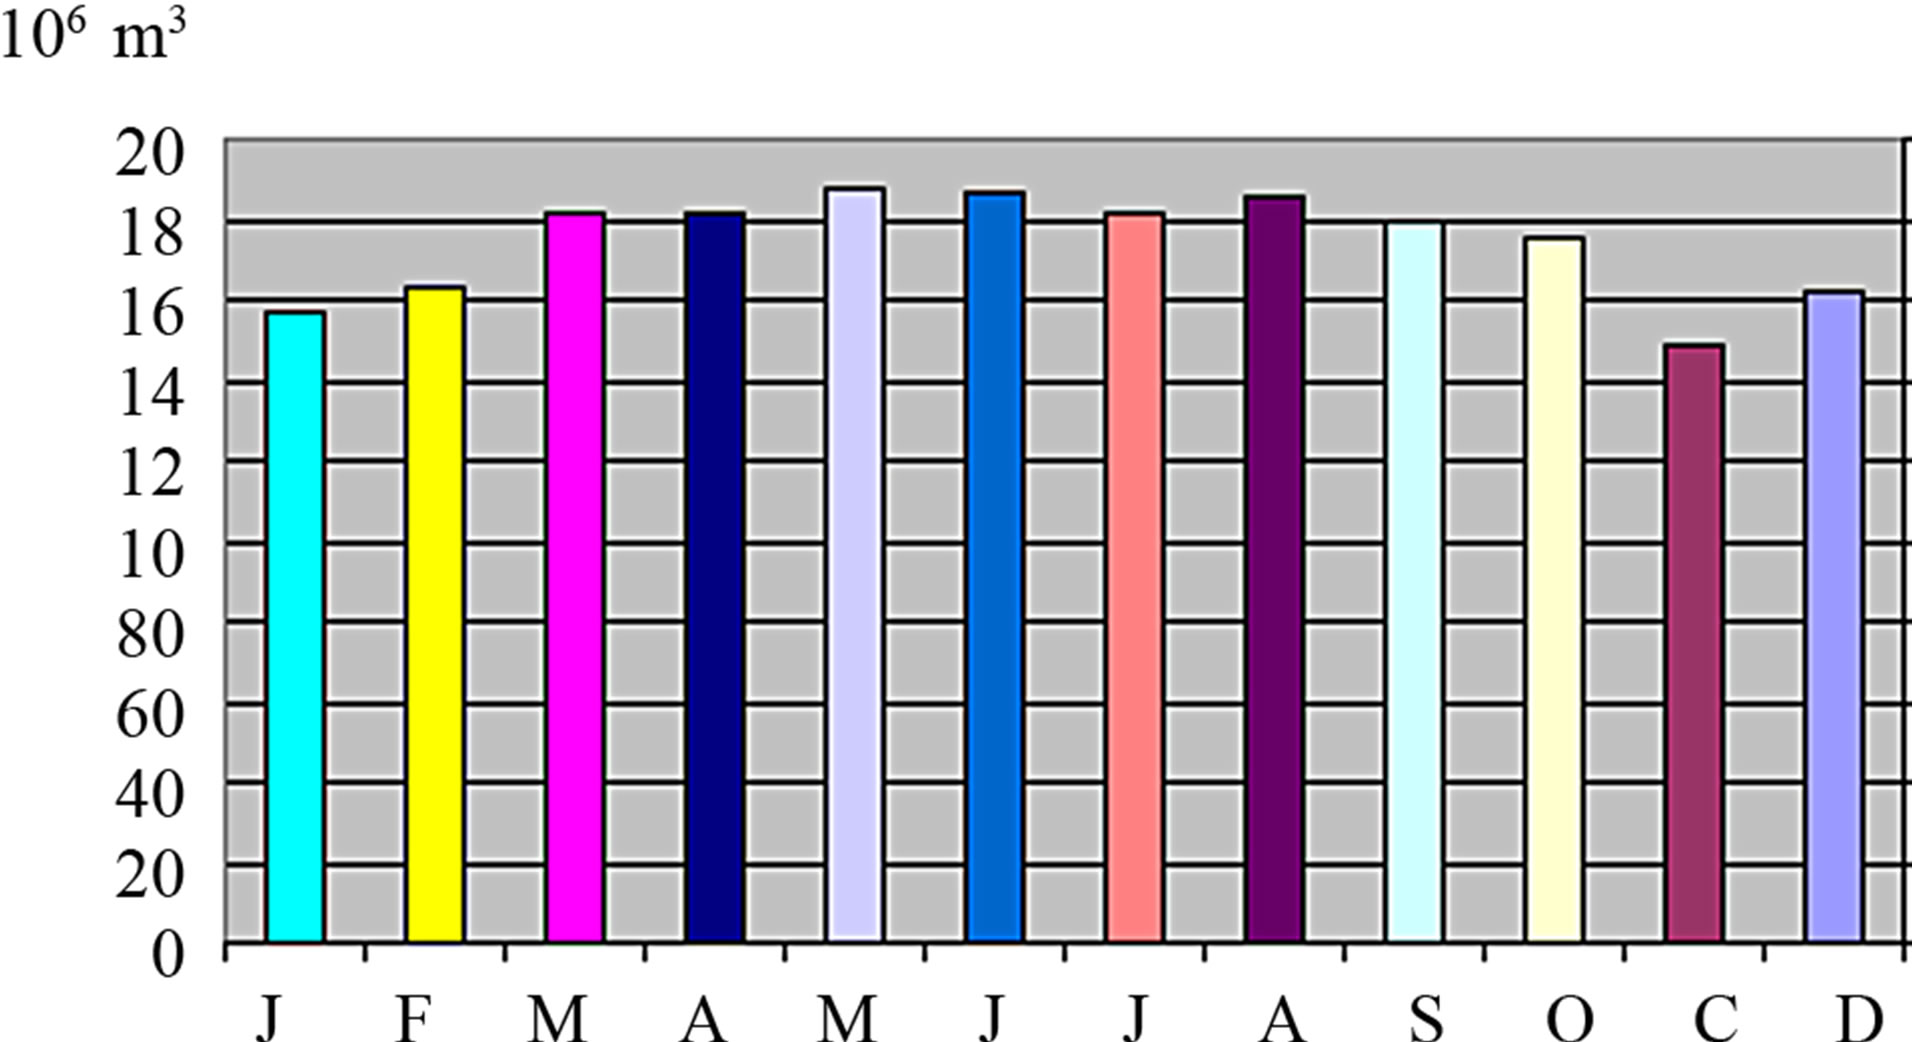
Figure 4. Monthly water pumping from wells in Mafraq Governorate.
15,495,928 m3 for the studied period, and the total amount of water supplied was 92,975,572 m3 (see Table 5).
Figure 5 and Table 6 show the net quantities of water supplied by Mafraq Governorate to various towns and
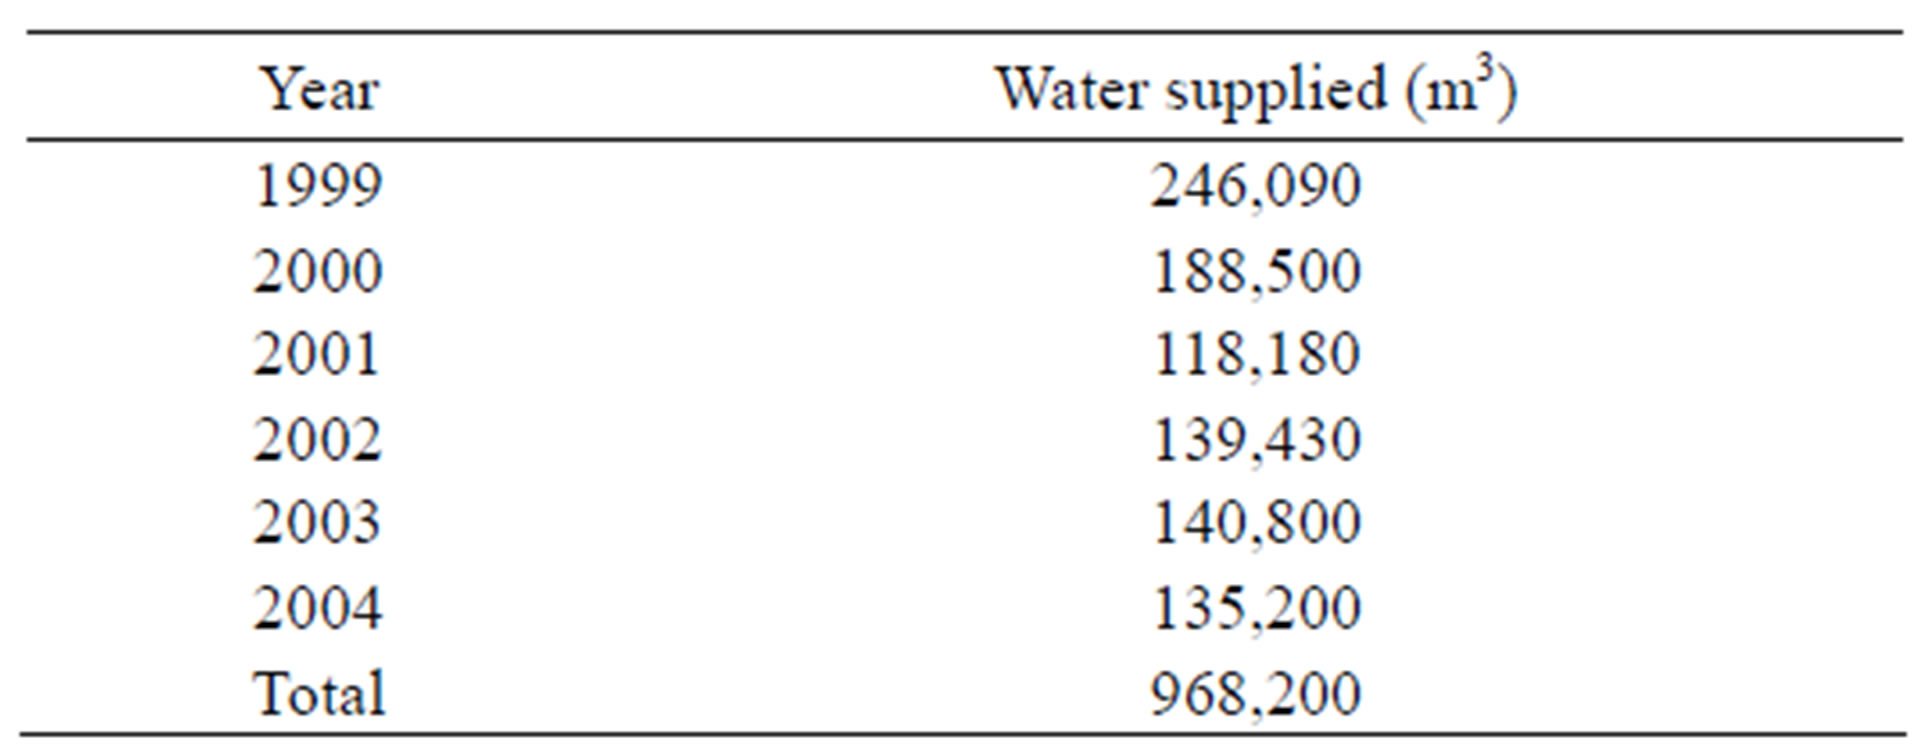
Table 4. Water from Ghiya wells supplied to Mafraq Governorate.
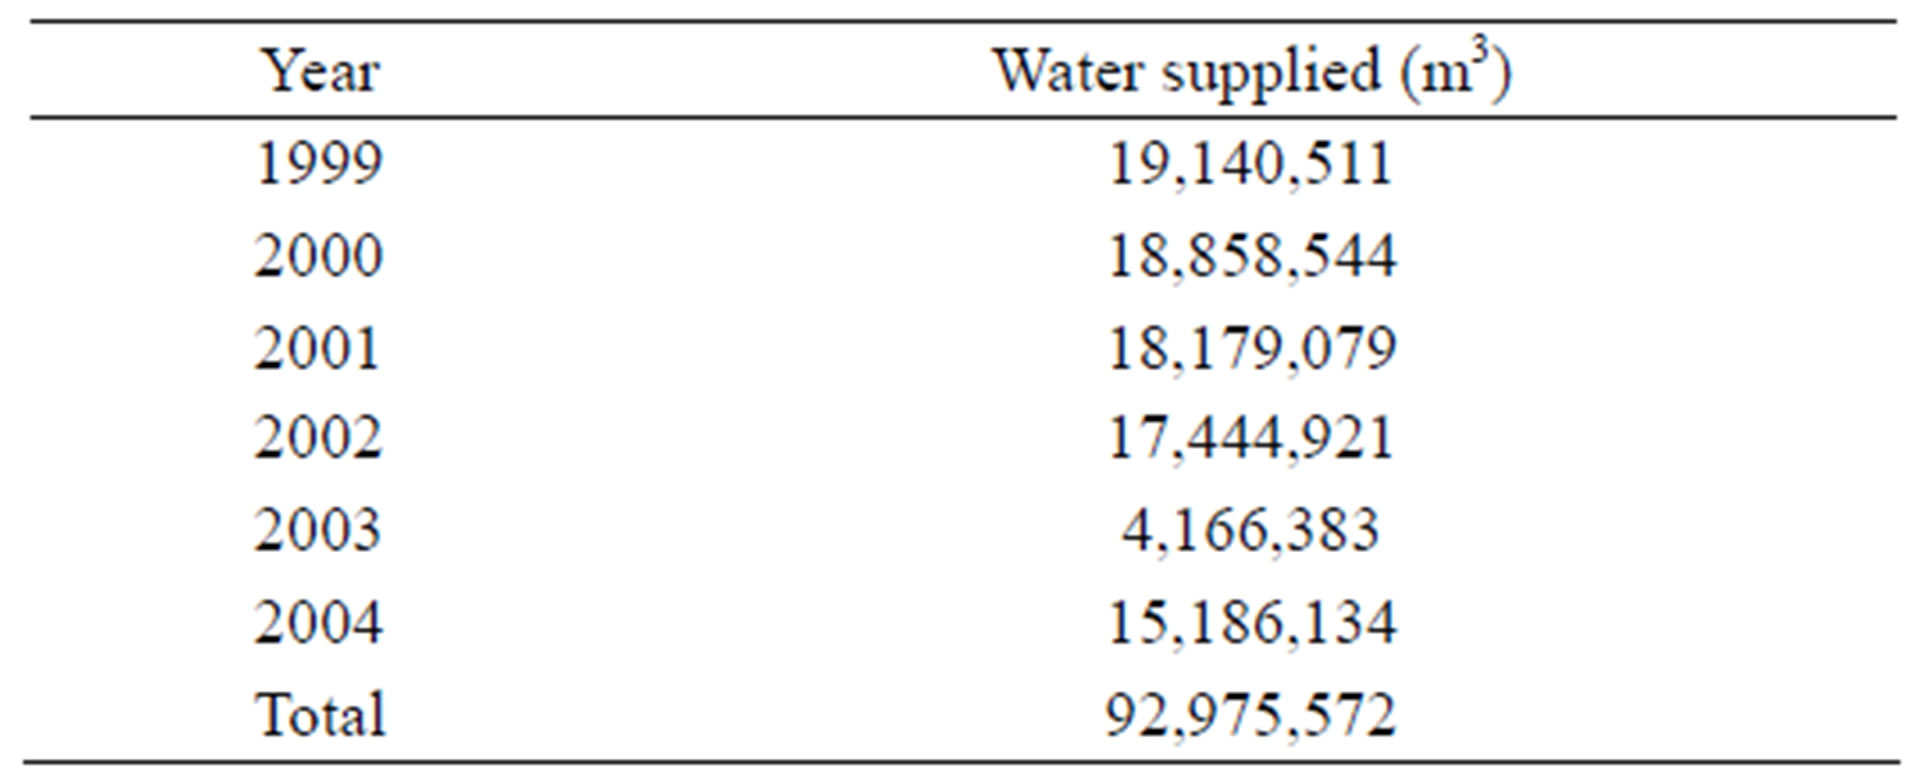
Table 5. Quantities of water exported by Mafraq Governorate to other Governorates (1999-2004).
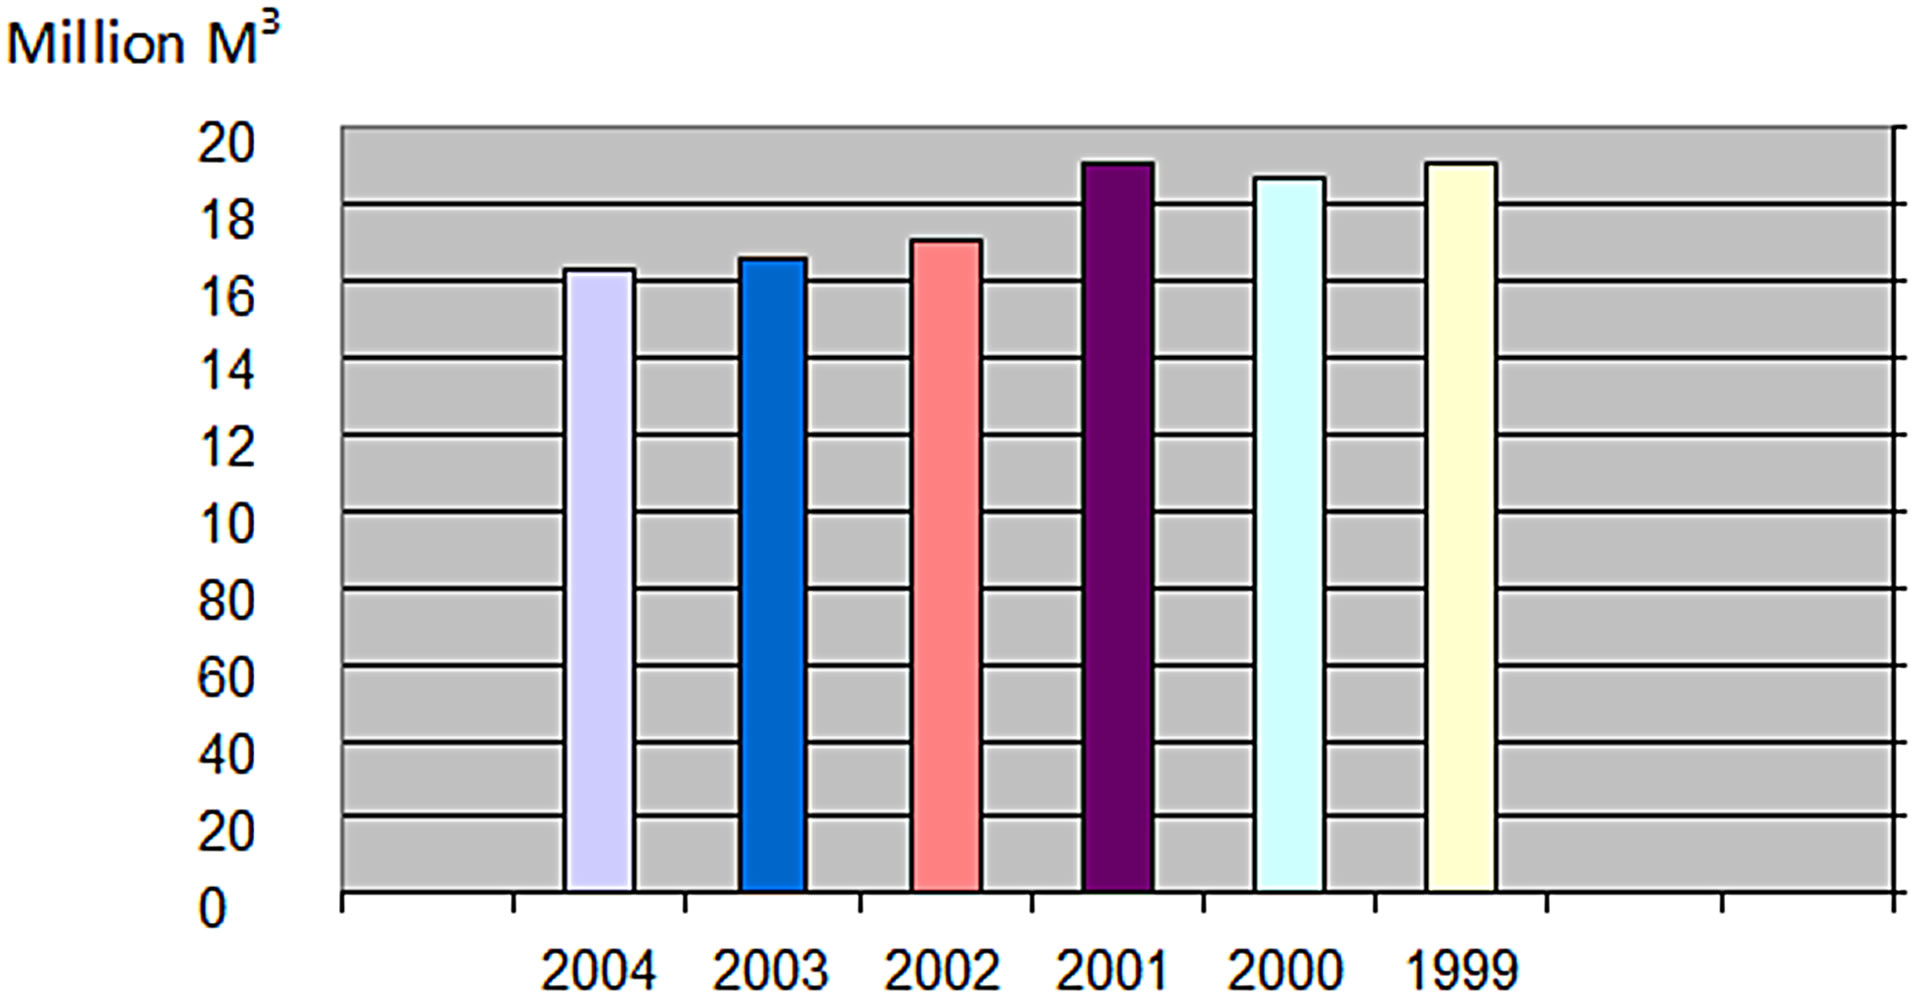
Figure 5. Net water supplied within Mafraq Governorate (1999-2004).
villages within the Governorate. From Figure 5, it can be noticed that the average annual supply was 14,376,678 m3 for the studied period, while the total quantity of the water supplied was 86,260,069 m3.
Water consumption in Mafraq can be divided into two main categories: The first is household consumption, which accounts for 95% of the consumed water and non-household consumption (Table 7). This is due to the fact that industrial and commercial activities are very restricted in Mafraq Governorate, compared to other cities in Jordan.
3. WATER LOSS IN MAFRAQ
Water loss in Mafraq is considered very high relative to other Governorates in Jordan. Table 8 and Figure 6 show that the average annual loss is higher than 70%. It also shows that the loss is slightly decreasing with time. This is due to the increase in maintenance operations within Mafraq city.
Water losses are defined here as the water which has no revenue. These can be classified as:
Technical losses: they result from breakdown or seepage within the distribution pipes systems. This type of loss can be divided into:
Apparent technical loss: this is due to apparent breakdown of the distribution net systems;
Unseen loss: such loss is due to the breakdown of the pipes in the distribution network under the ground;
Administrative losses: these are due to existence of broken water quantity meters, human errors (e.g. issuing wrong bills), not installing meters correctly, using the water illegally, centralization, and weak governance.
3.1. Technical Losses
Charalambous [8] had put a table that summarizes the distributed water (Table 9).
To calculate the loss the following equation is used (Table 10):
Quantity of water loss (L) = Net supplied water (Ss) – Net sold water (So) + Water consumed outside counters (C).
It can be noticed from Table 3, listed earlier, that the loss in Mafraq is among the highest in Jordan. This is due to the large and expanded geographical area of Mafraq Governorate, and to the fact that the communities in the governorate are dispersed. Consequently, long supply pipe lines used makes it hard for the inspection and maintenance teams to report or repair seepages and leakages [9]. In addition, this governorate’s population livelihood is based on livestock. In many cases, livestock owners deliberately make seepages in the supply pipe lines using guns, or they break the lines in valleys, in order to secure water needs for their livestock [10].
As a summary, technical losses can be attributed to
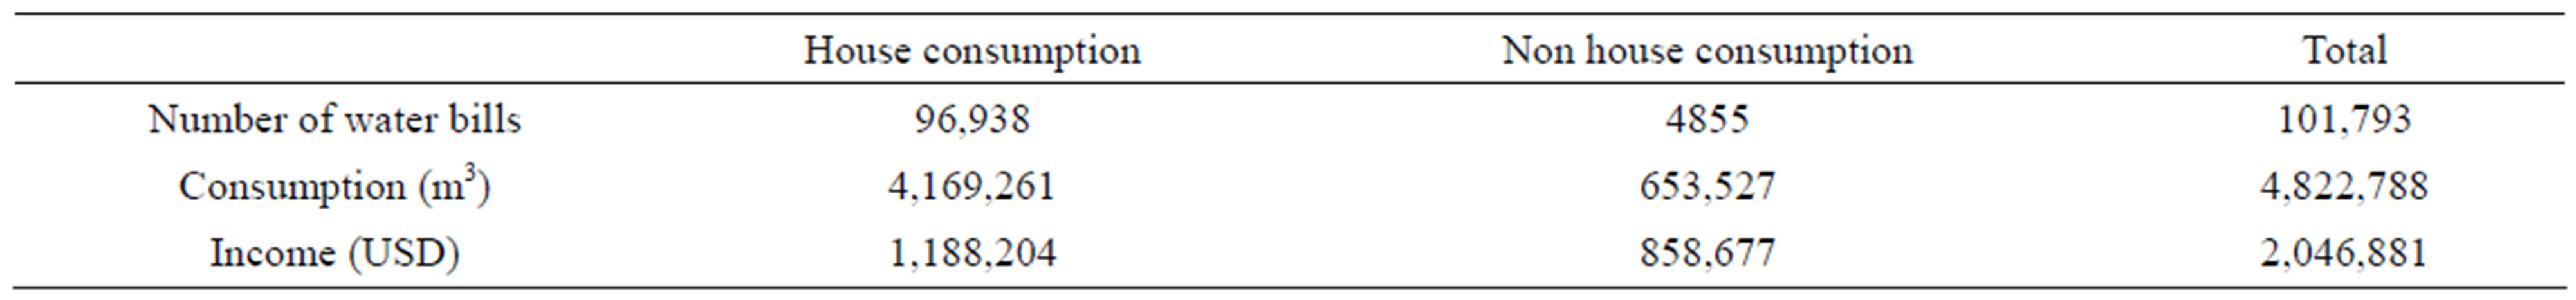
Table 6. Water supplied in Mafraq.
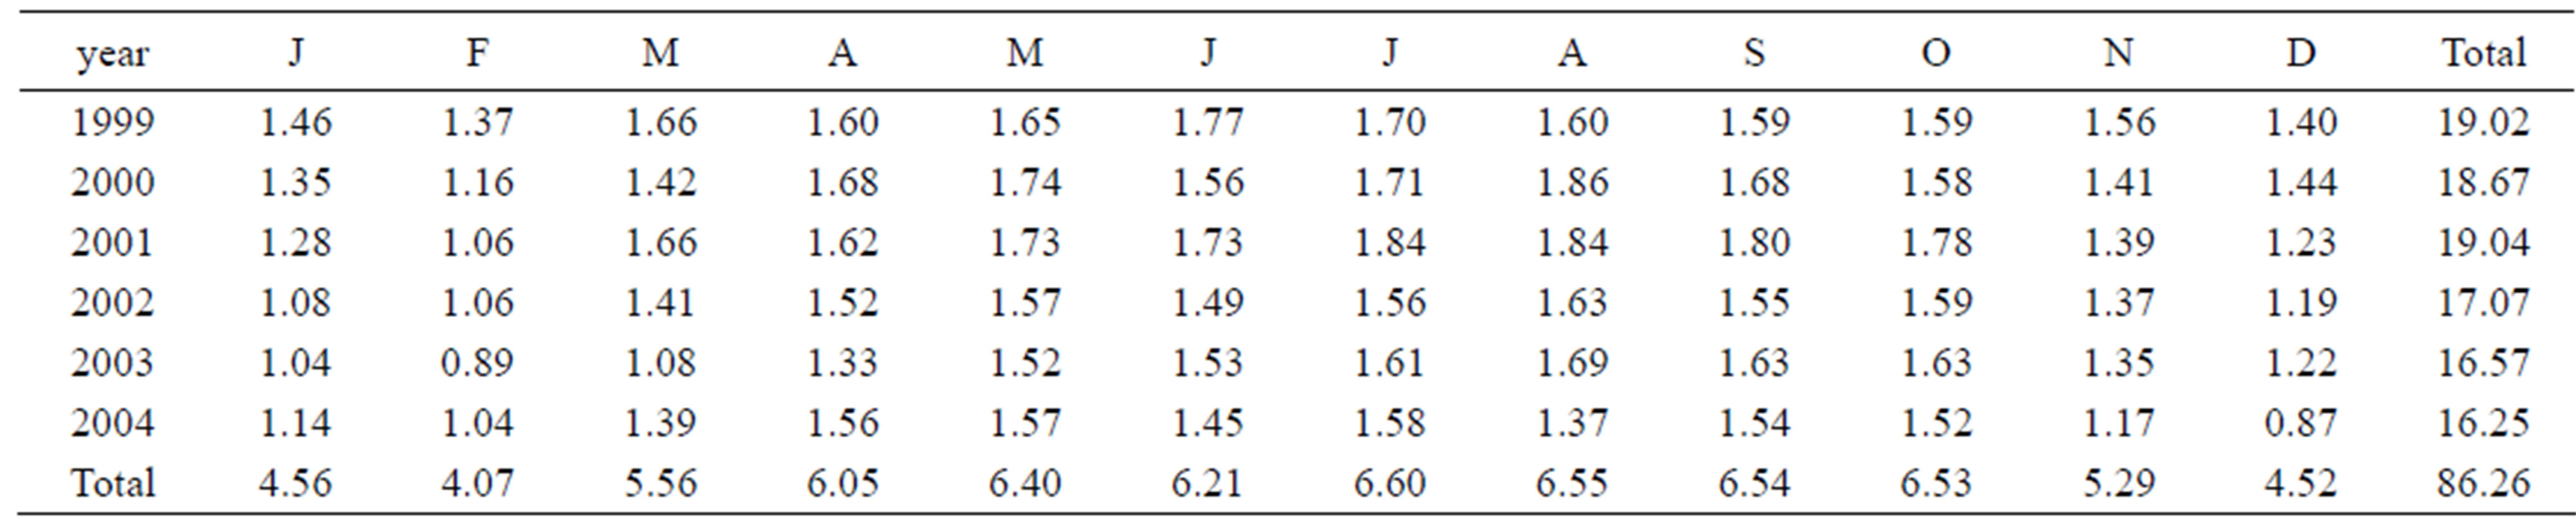
Table 7. Water consumption in Mafraq.
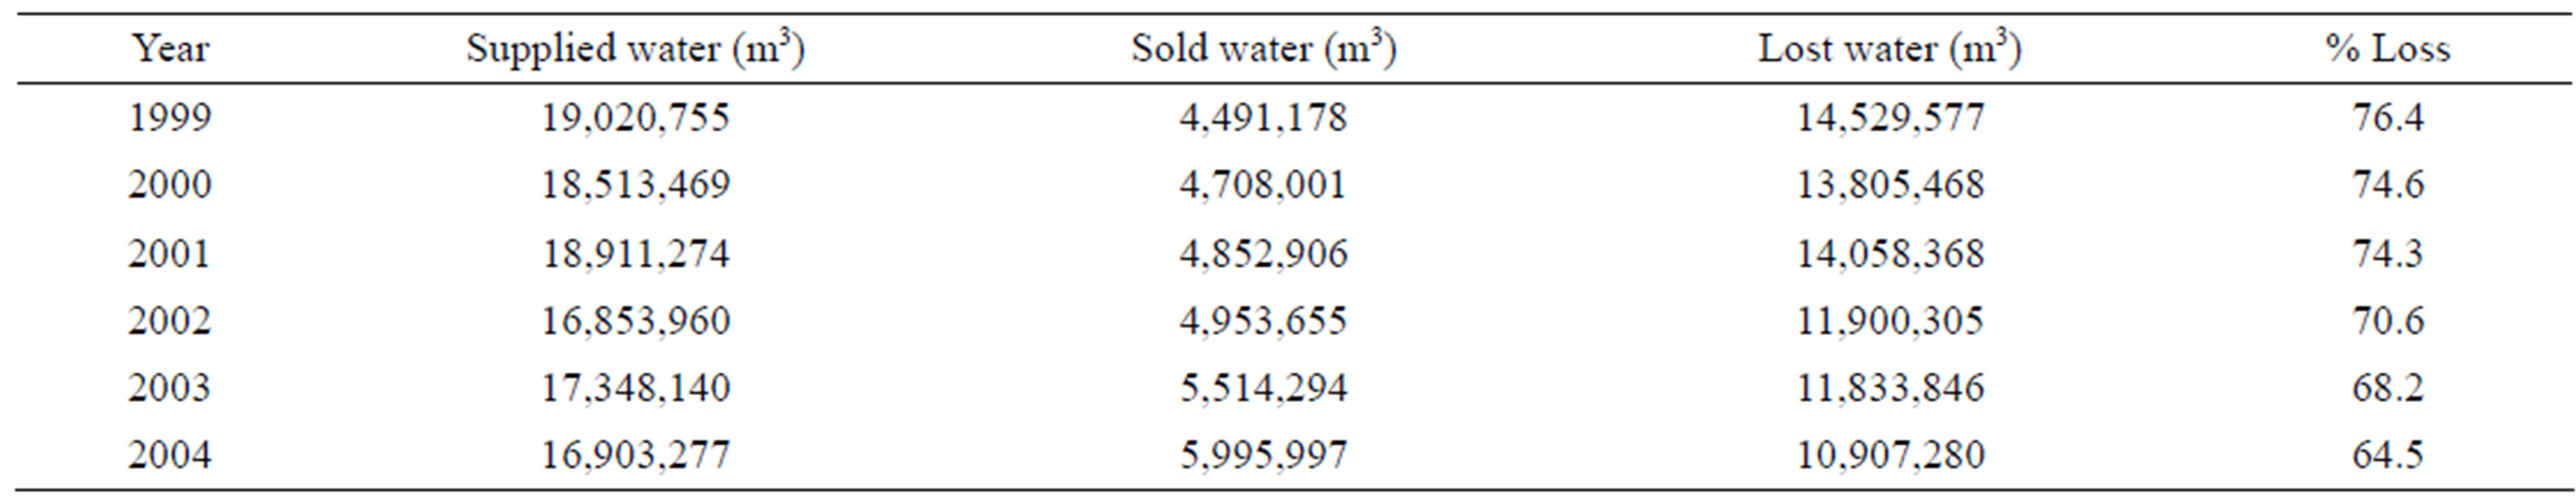
Table 8. Water supply and losses in Mafraq Governorate.
several factors (Figure 7). Among these is not installing the pipes in straight lines, not using flexible joints, as well as the erosion of the pipes and joints. Further, poor operation and maintenance of the network, as well as having water hammer in some parts of the network [11, 12].
3.2. Administrative Losses
The administrative loss in Mafraq can be attributed to (Figure 8):
Meters in terms of quality, accuracy, location, methods of installation and suitability to the different areas in the governorate, in terms of operation and climate (Mafraq Water Management: Annual Reports of the Directorate of Losses);
Administrative errors related to manpower: the most important of which is not reading the meters, errors in reading and deportation, lack of running for subscrip-
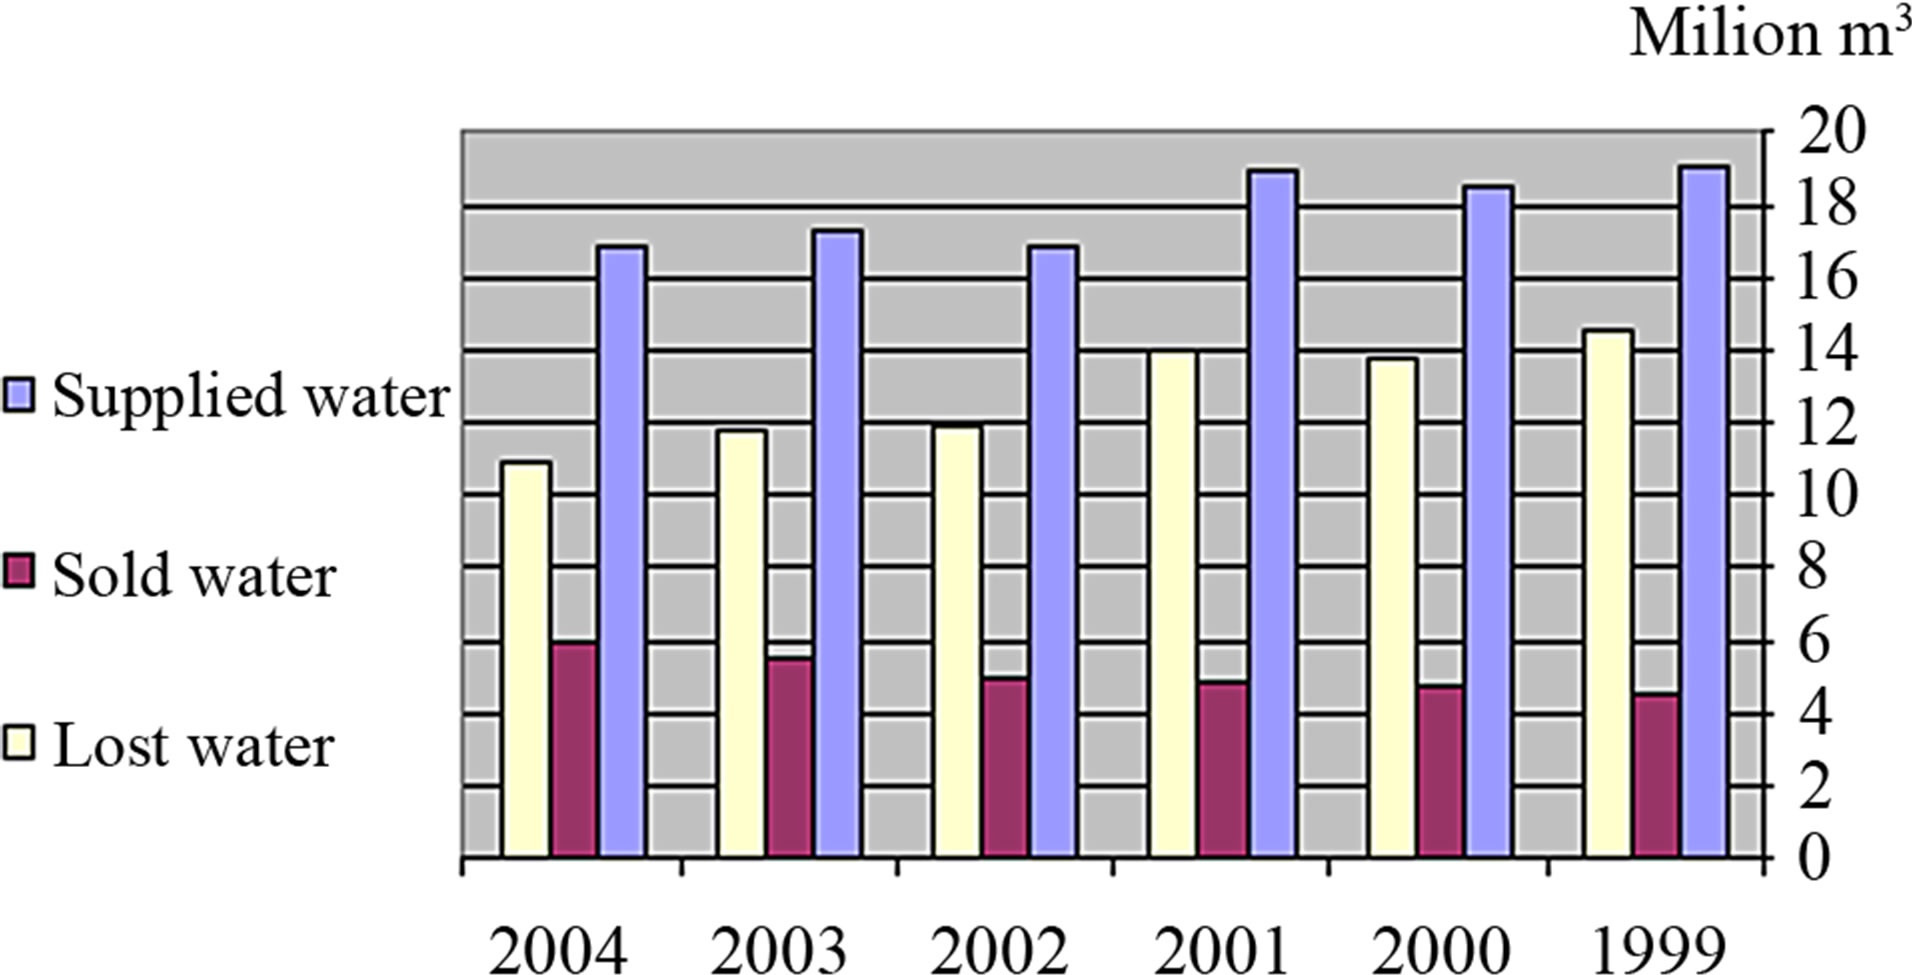
Figure 6. Water supply and loss in Mafraq city.
tions, as well as, errors in estimating the amount of water;
Illegal use of water: this involves manipulating the meters, breaking the pipes, and installing junctions before the meter;
Poor administrative coordination with the water sector and water authority workers who are operating in the field;
Lack of documentation concerning the consumers, meters, and the network;
Lack of qualified and creative personnel and the lack of the specific job description;
The existence of some broken meters as a result of frost, which were not been replaced;
Lack of operating governance in the field.
Centralization—basically because communities around the governorate are dispersed, decisions need to be taken in the field, and personnel are not trained to do so; they do not take action in the field until they report back to the central office in the governorate, and therefore, loss takes place during action.
4. EVALUATION OF WATER LOSS
There is no accepted universal method to calculate the loss. For this reason, four methods were been used as follows:
First method: calculation of the water consumption for each consumer’s category. Then these quantities will be transferred to its cost according to their tariff by the water authority (Table 11);
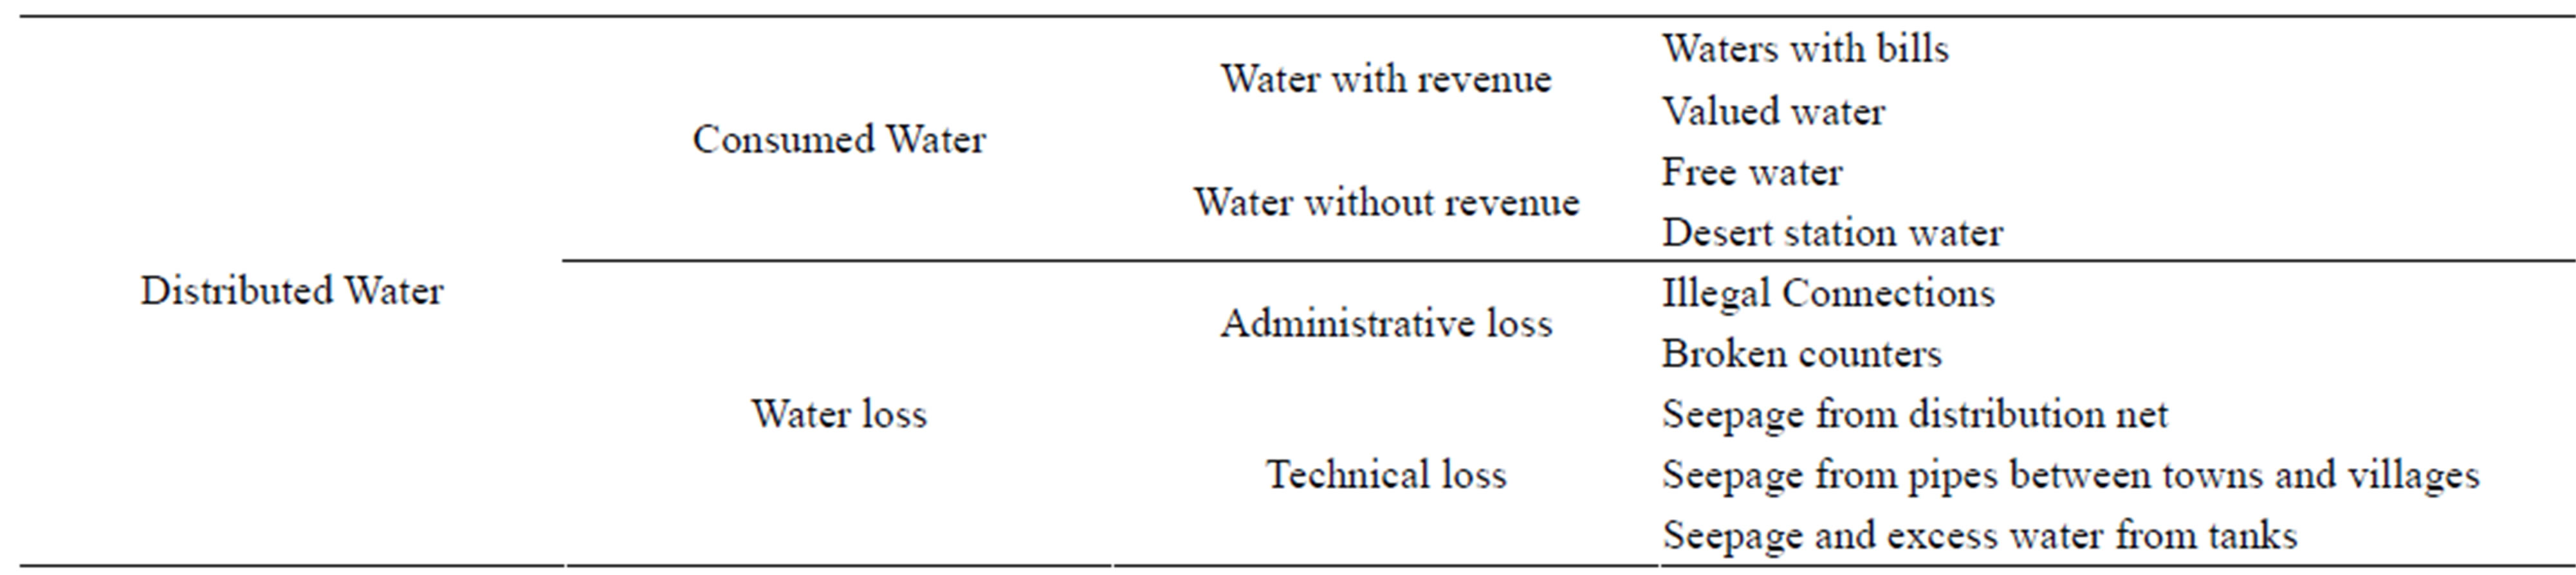
Table 9. Water distribution [8].
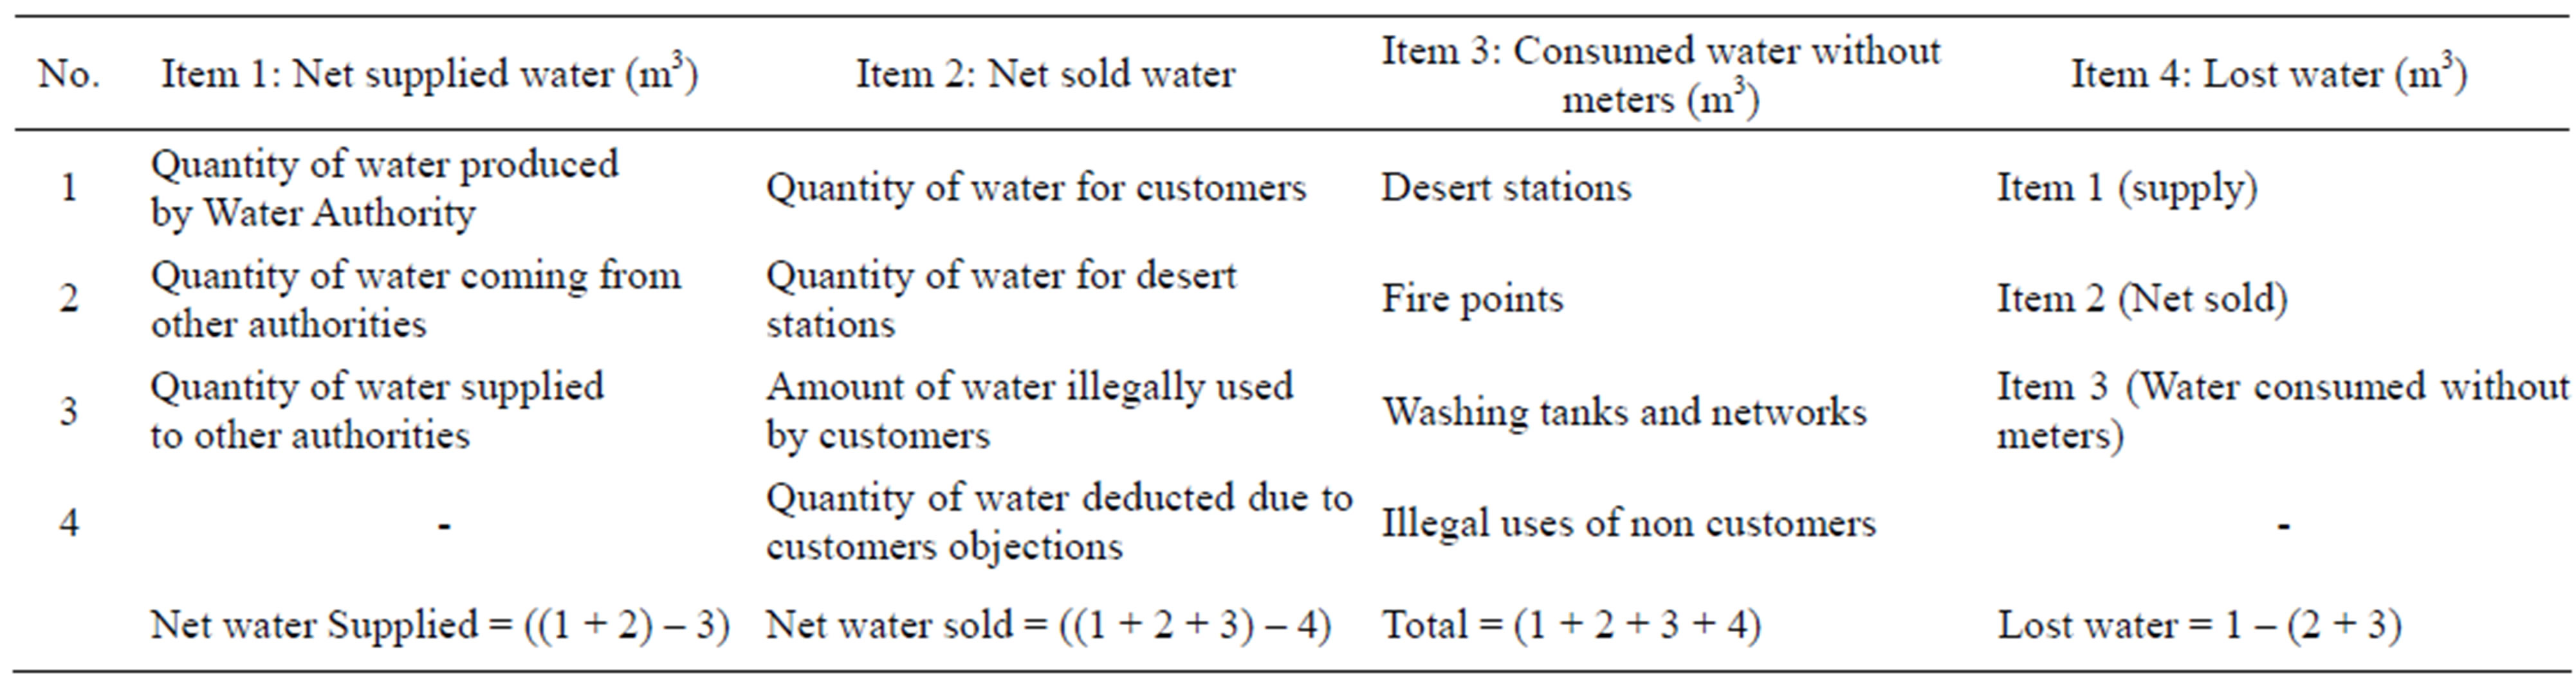
Table 10. Calculation of water losses (Source: Jordan Water Authority, Water Loss Department, unpublished report).

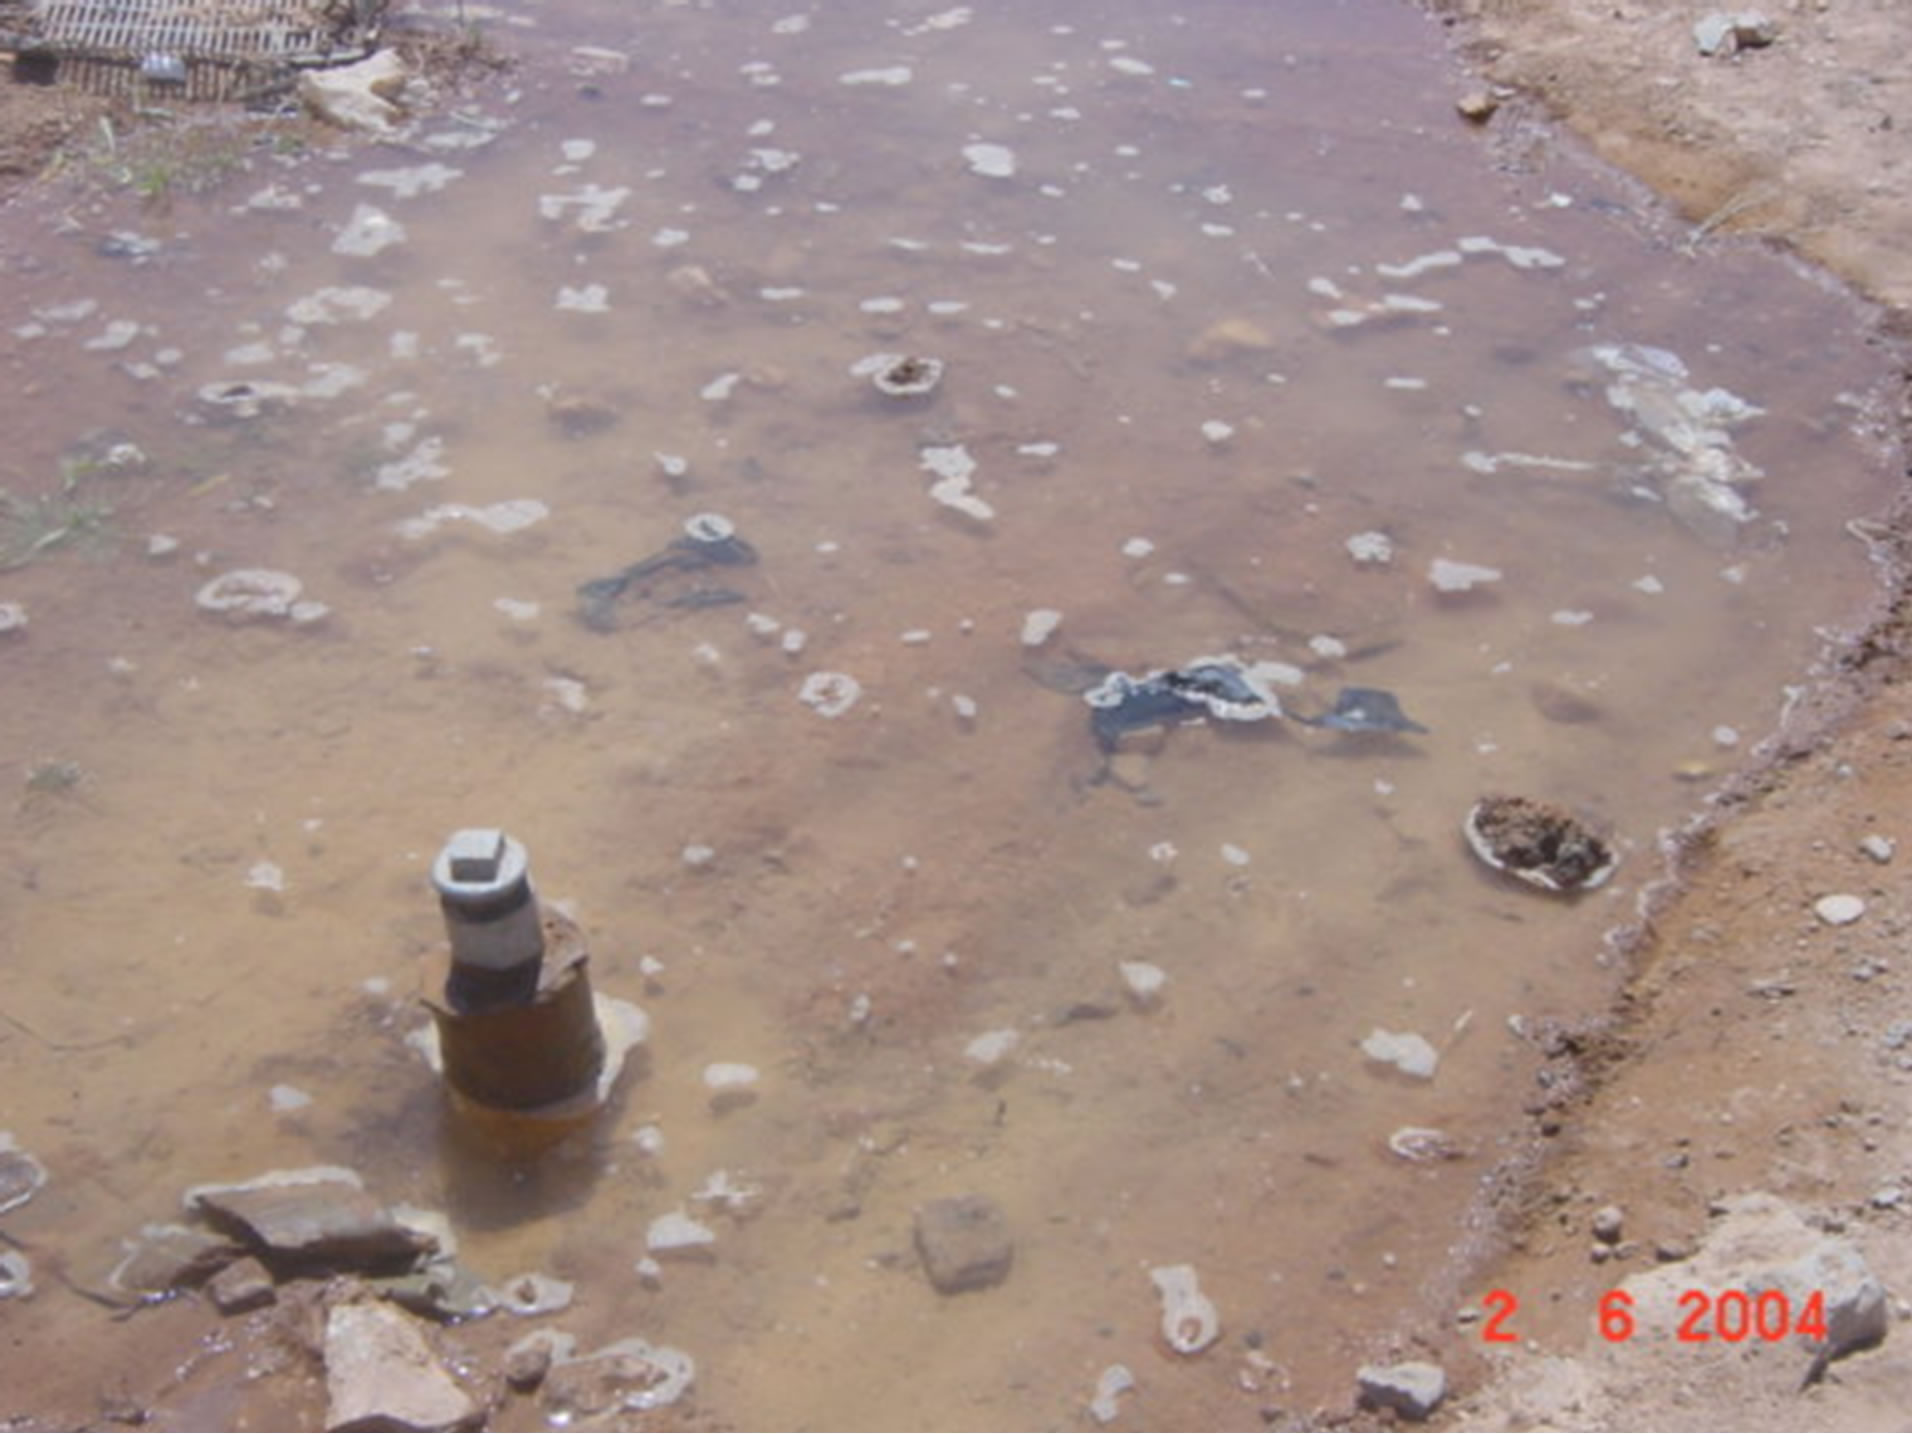
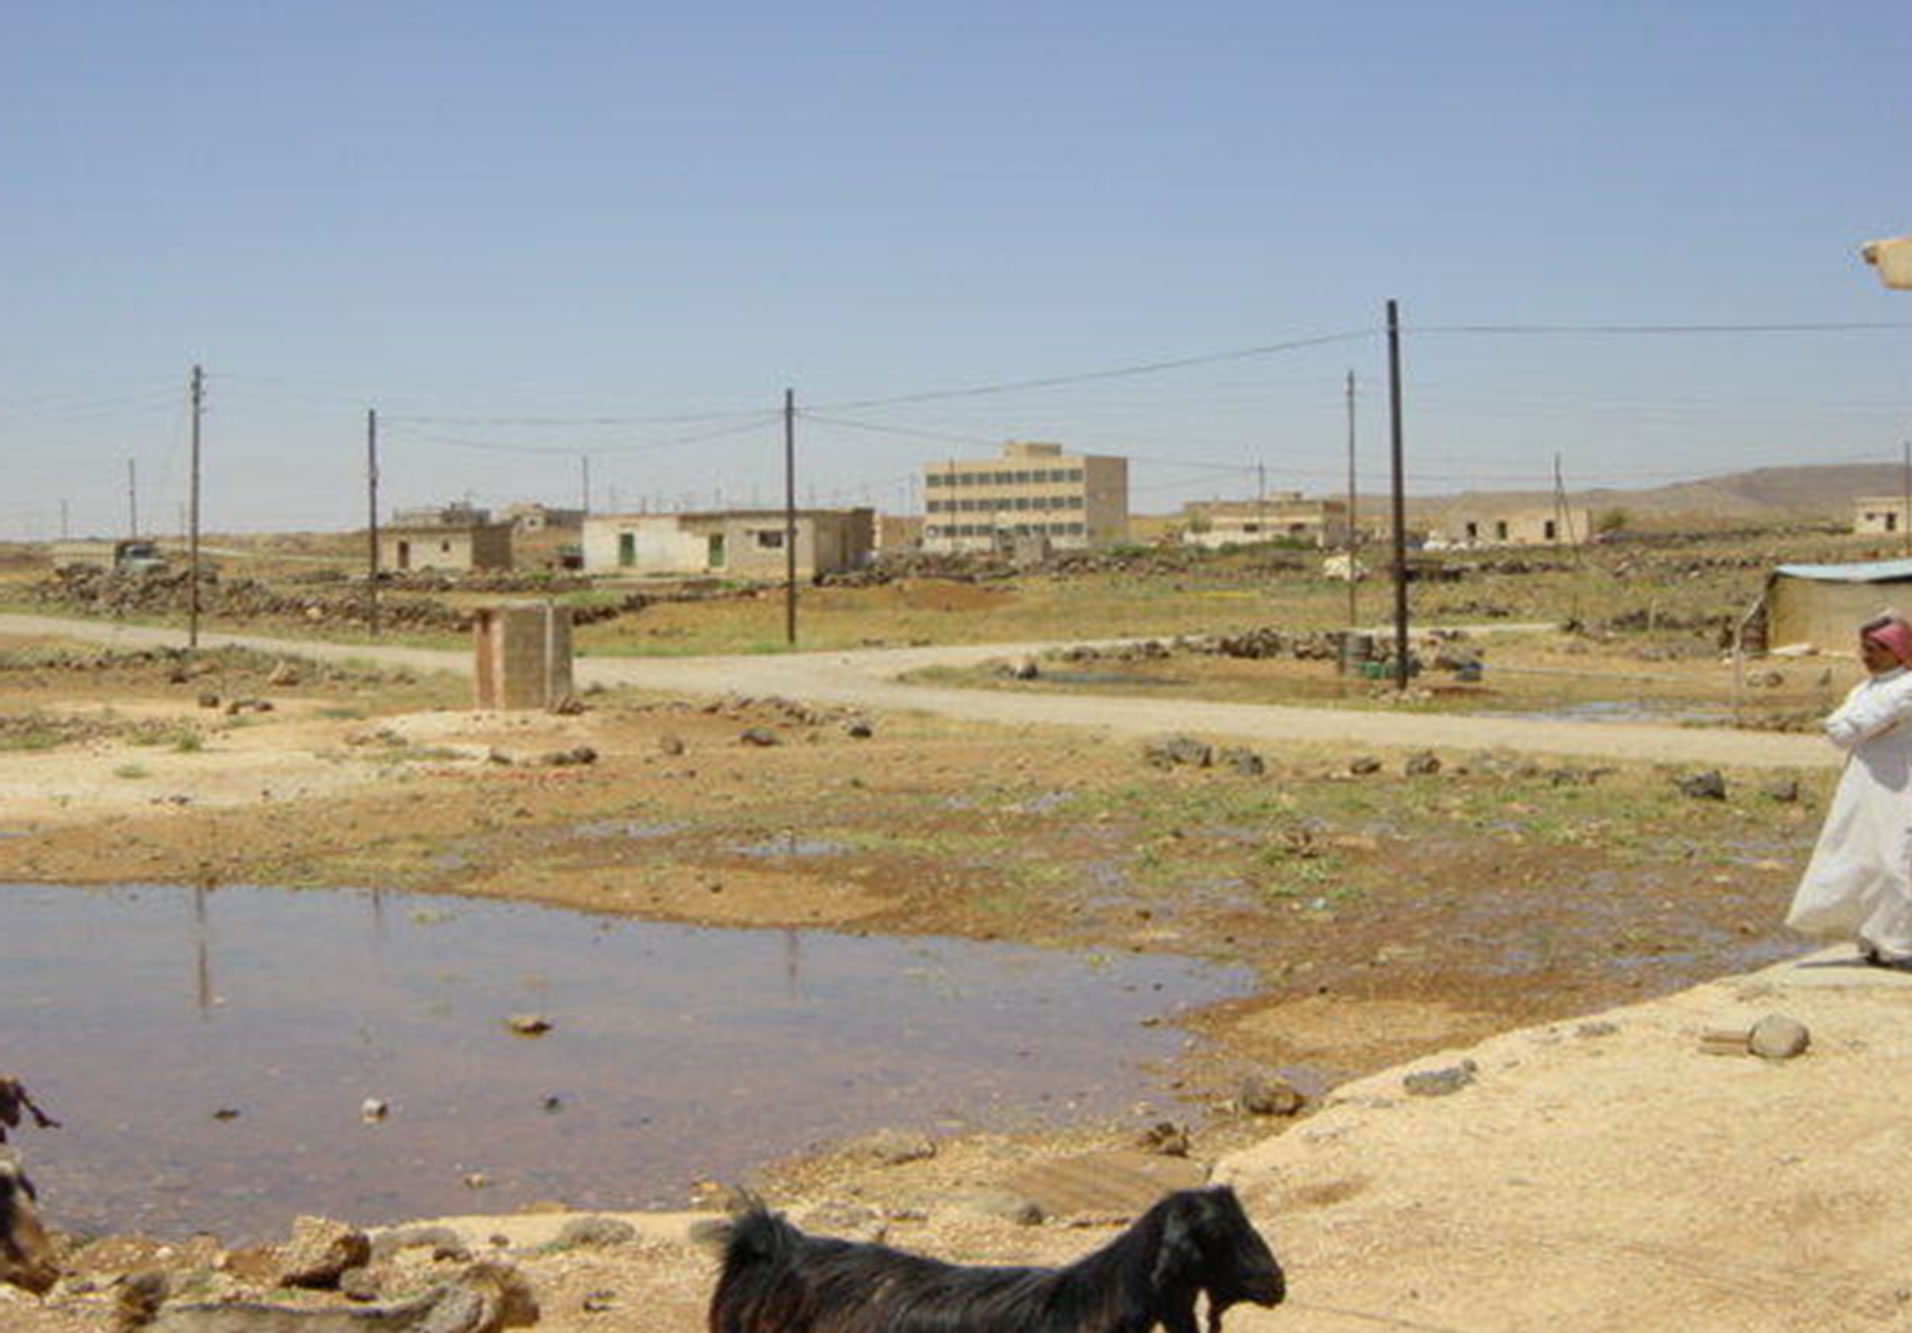
Figure 7. Examples of technical losses: up—broken pipe; middle—leaking pipe; down—breaking pipe to supply water to livestock.
Second method: calculating the ratio of income to the amount of water consumed, producing average revenue per cubic meter and the average of 5 USD/m3. Then this was multiplied by the amount of water loss;
Third method: calculating the cost of the water loss by dividing the total cost of the water extracted by the quantity of extracted water. This gives the unit cost of one cubic meter. This unit cost is multiplied by the quantity
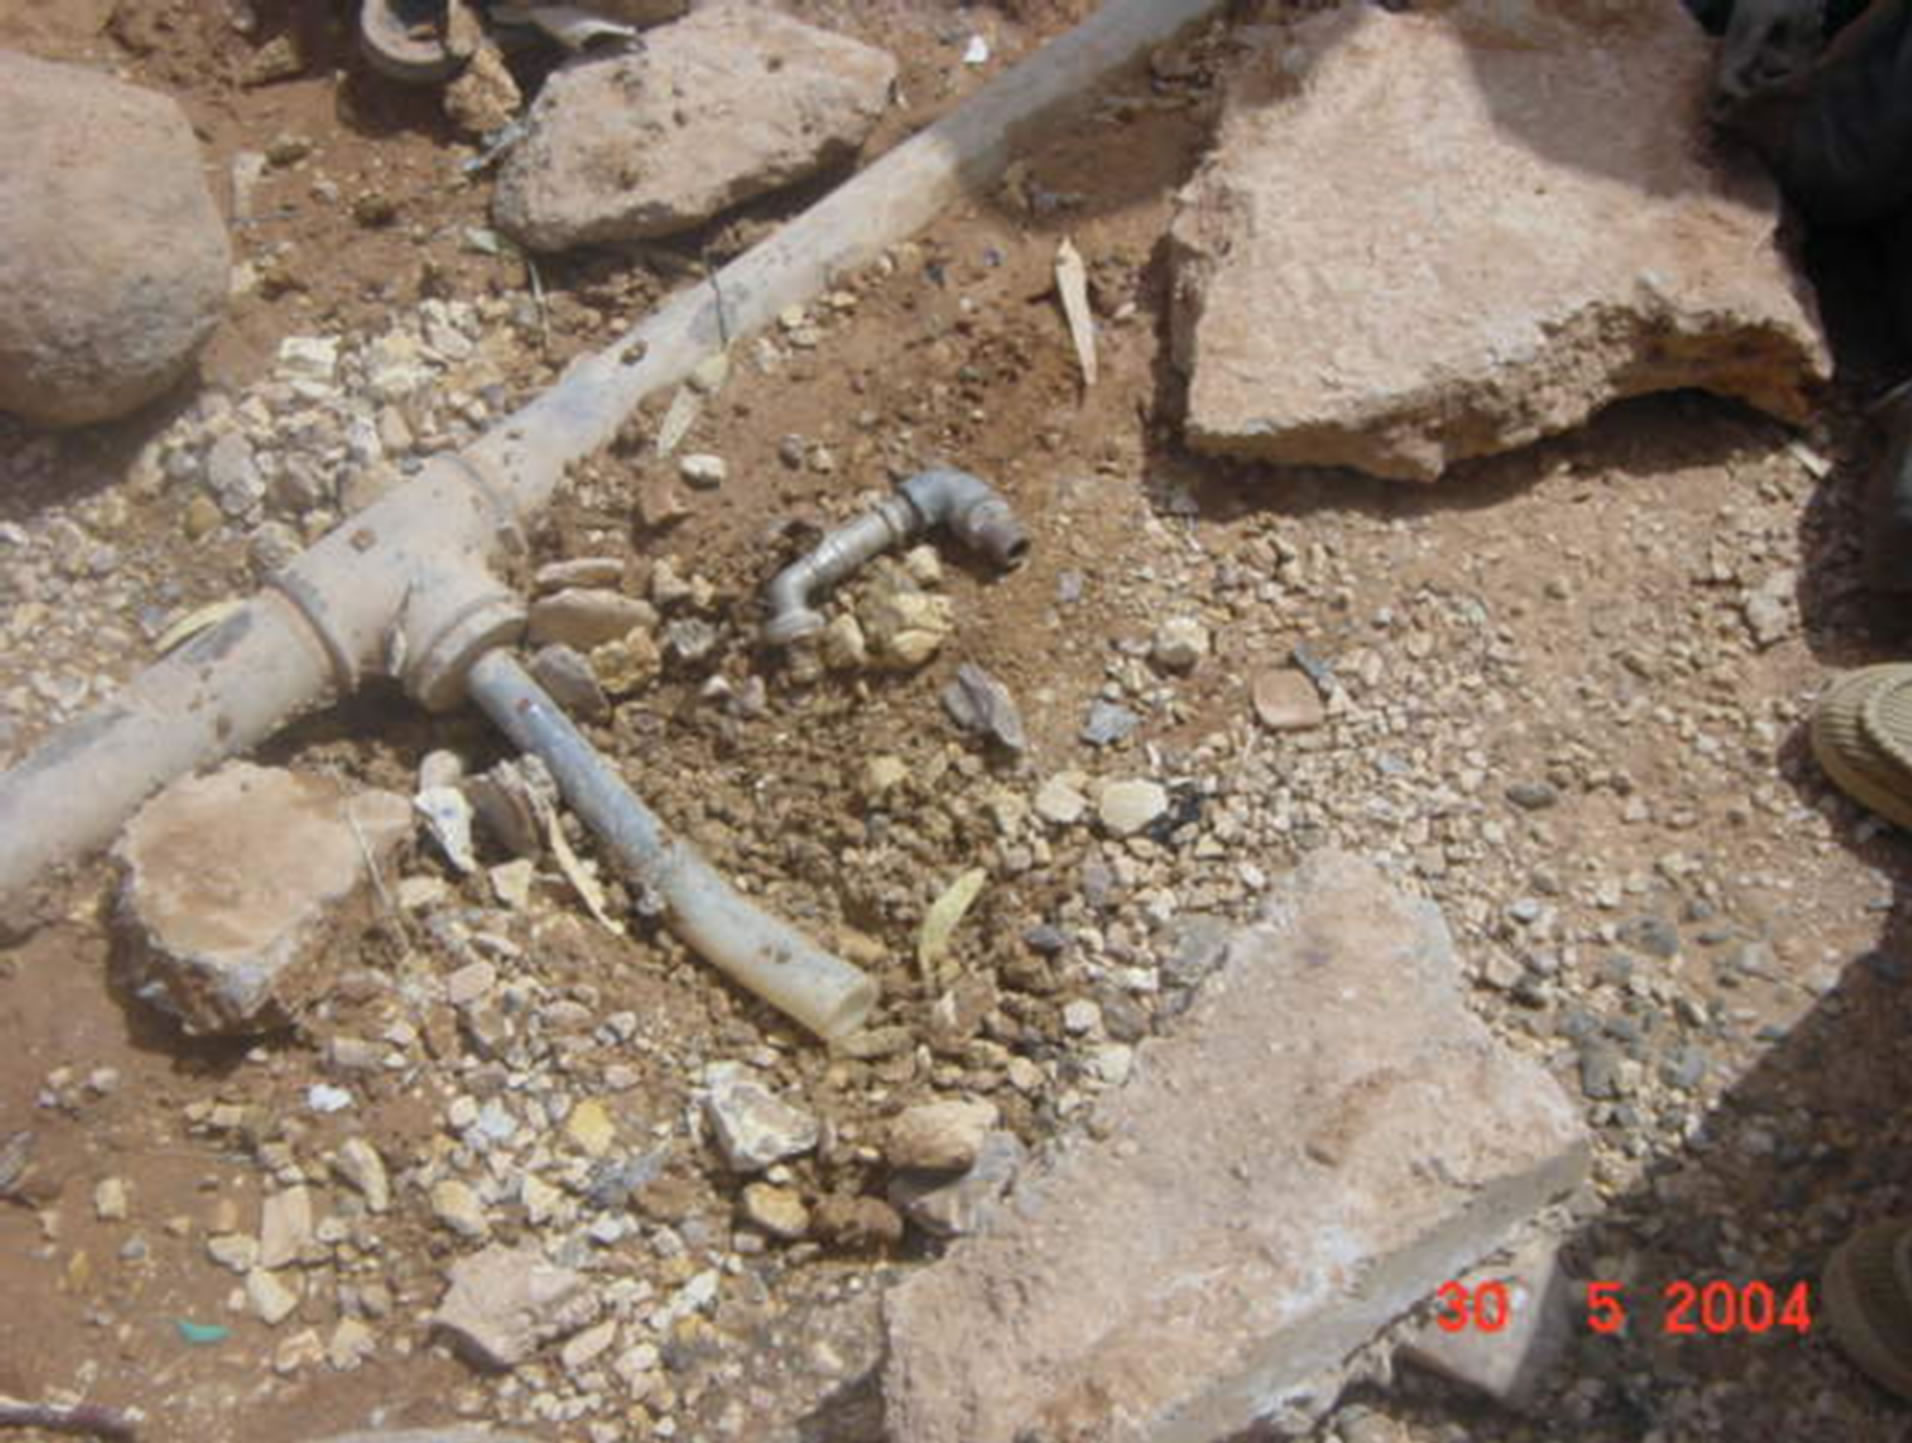
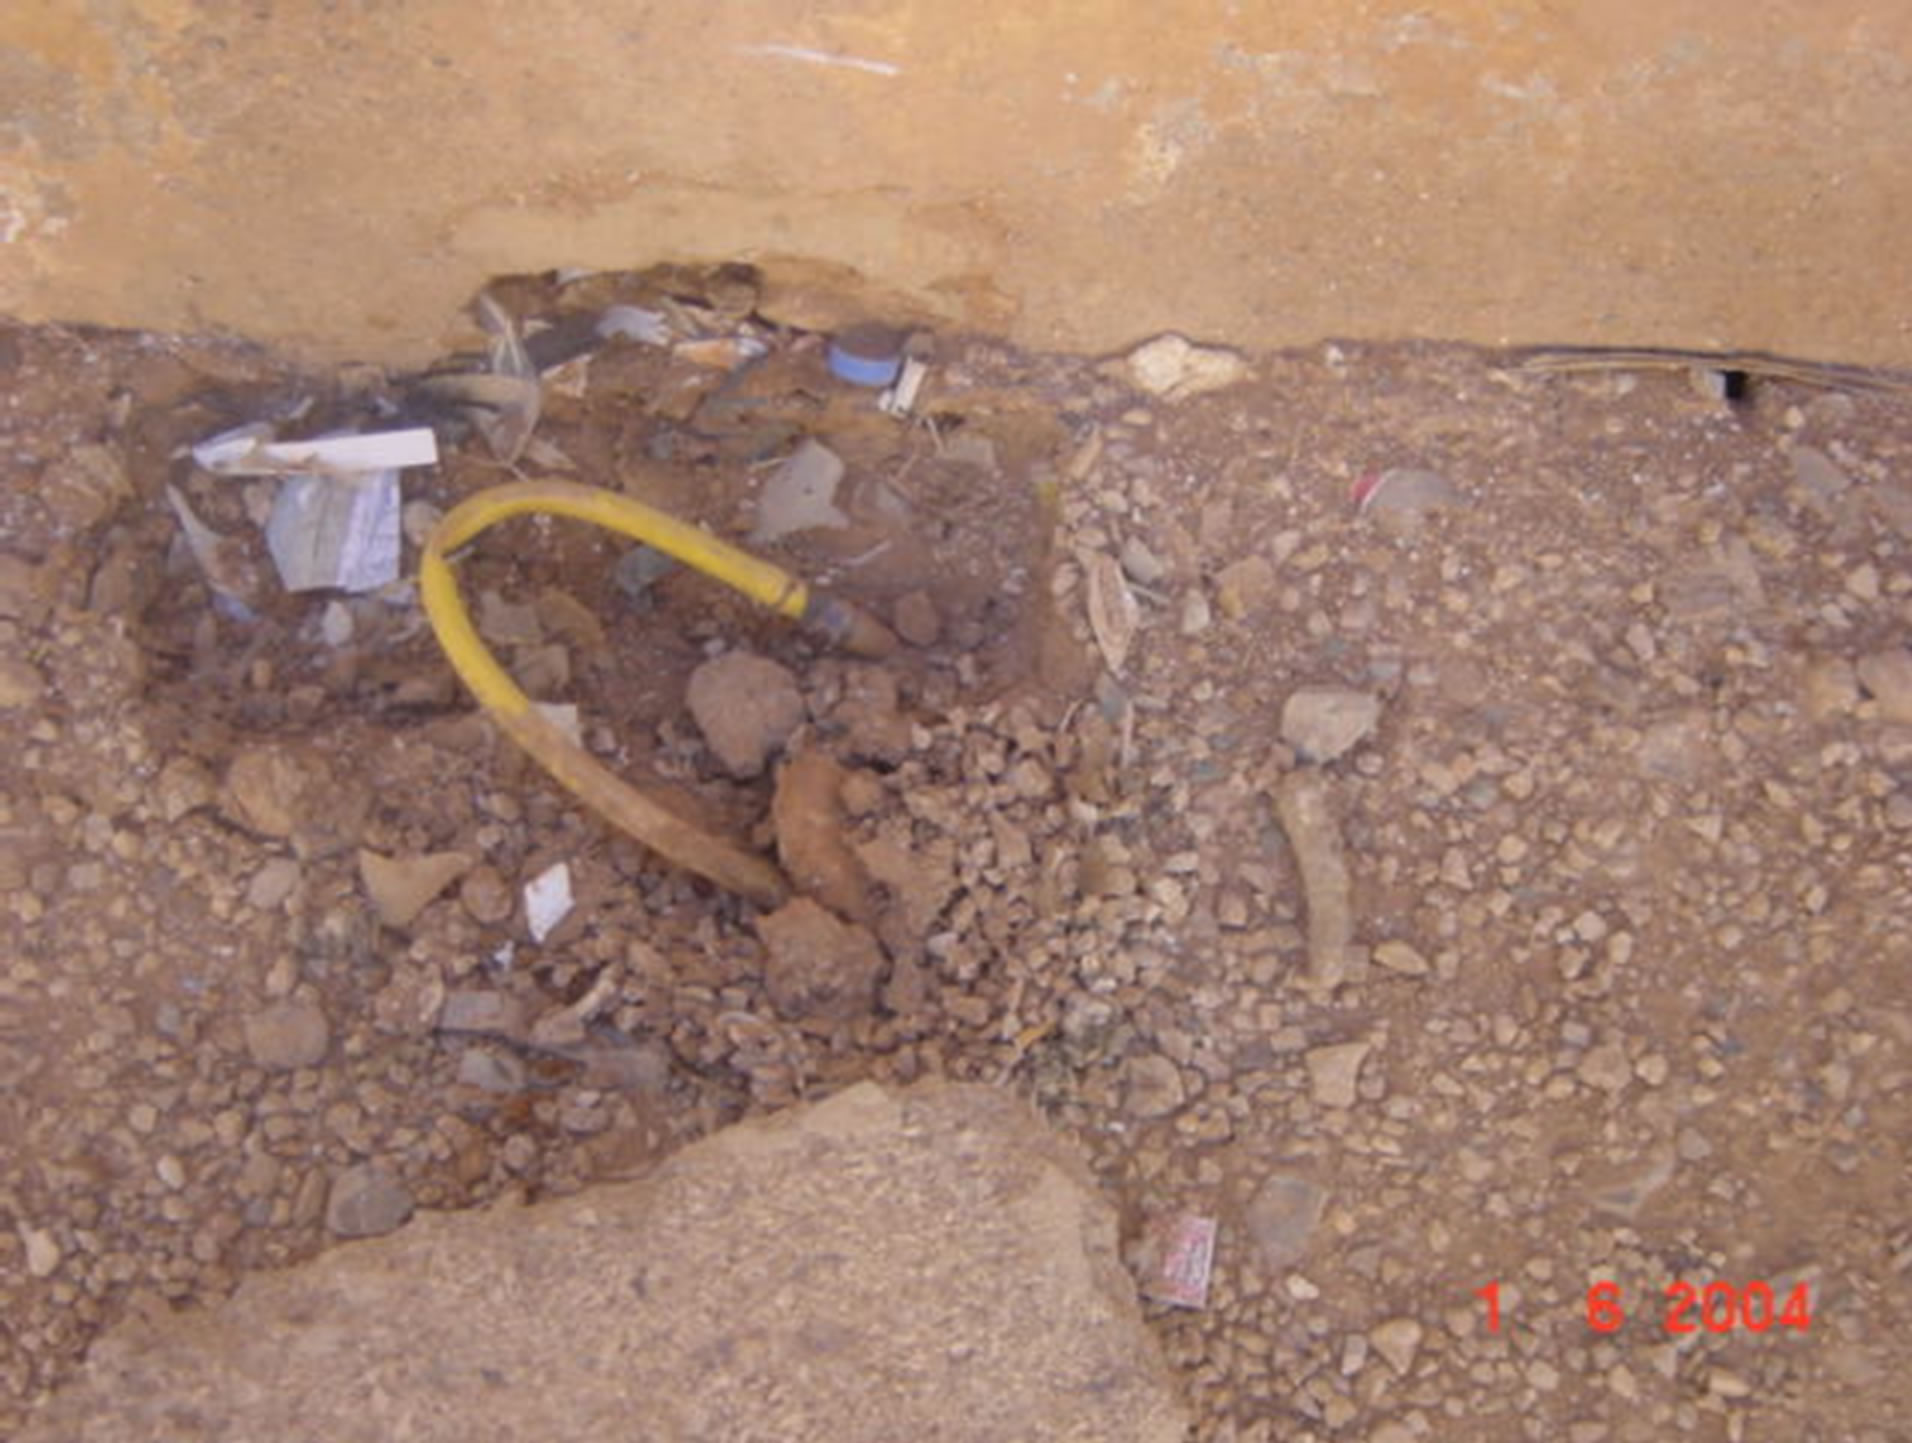
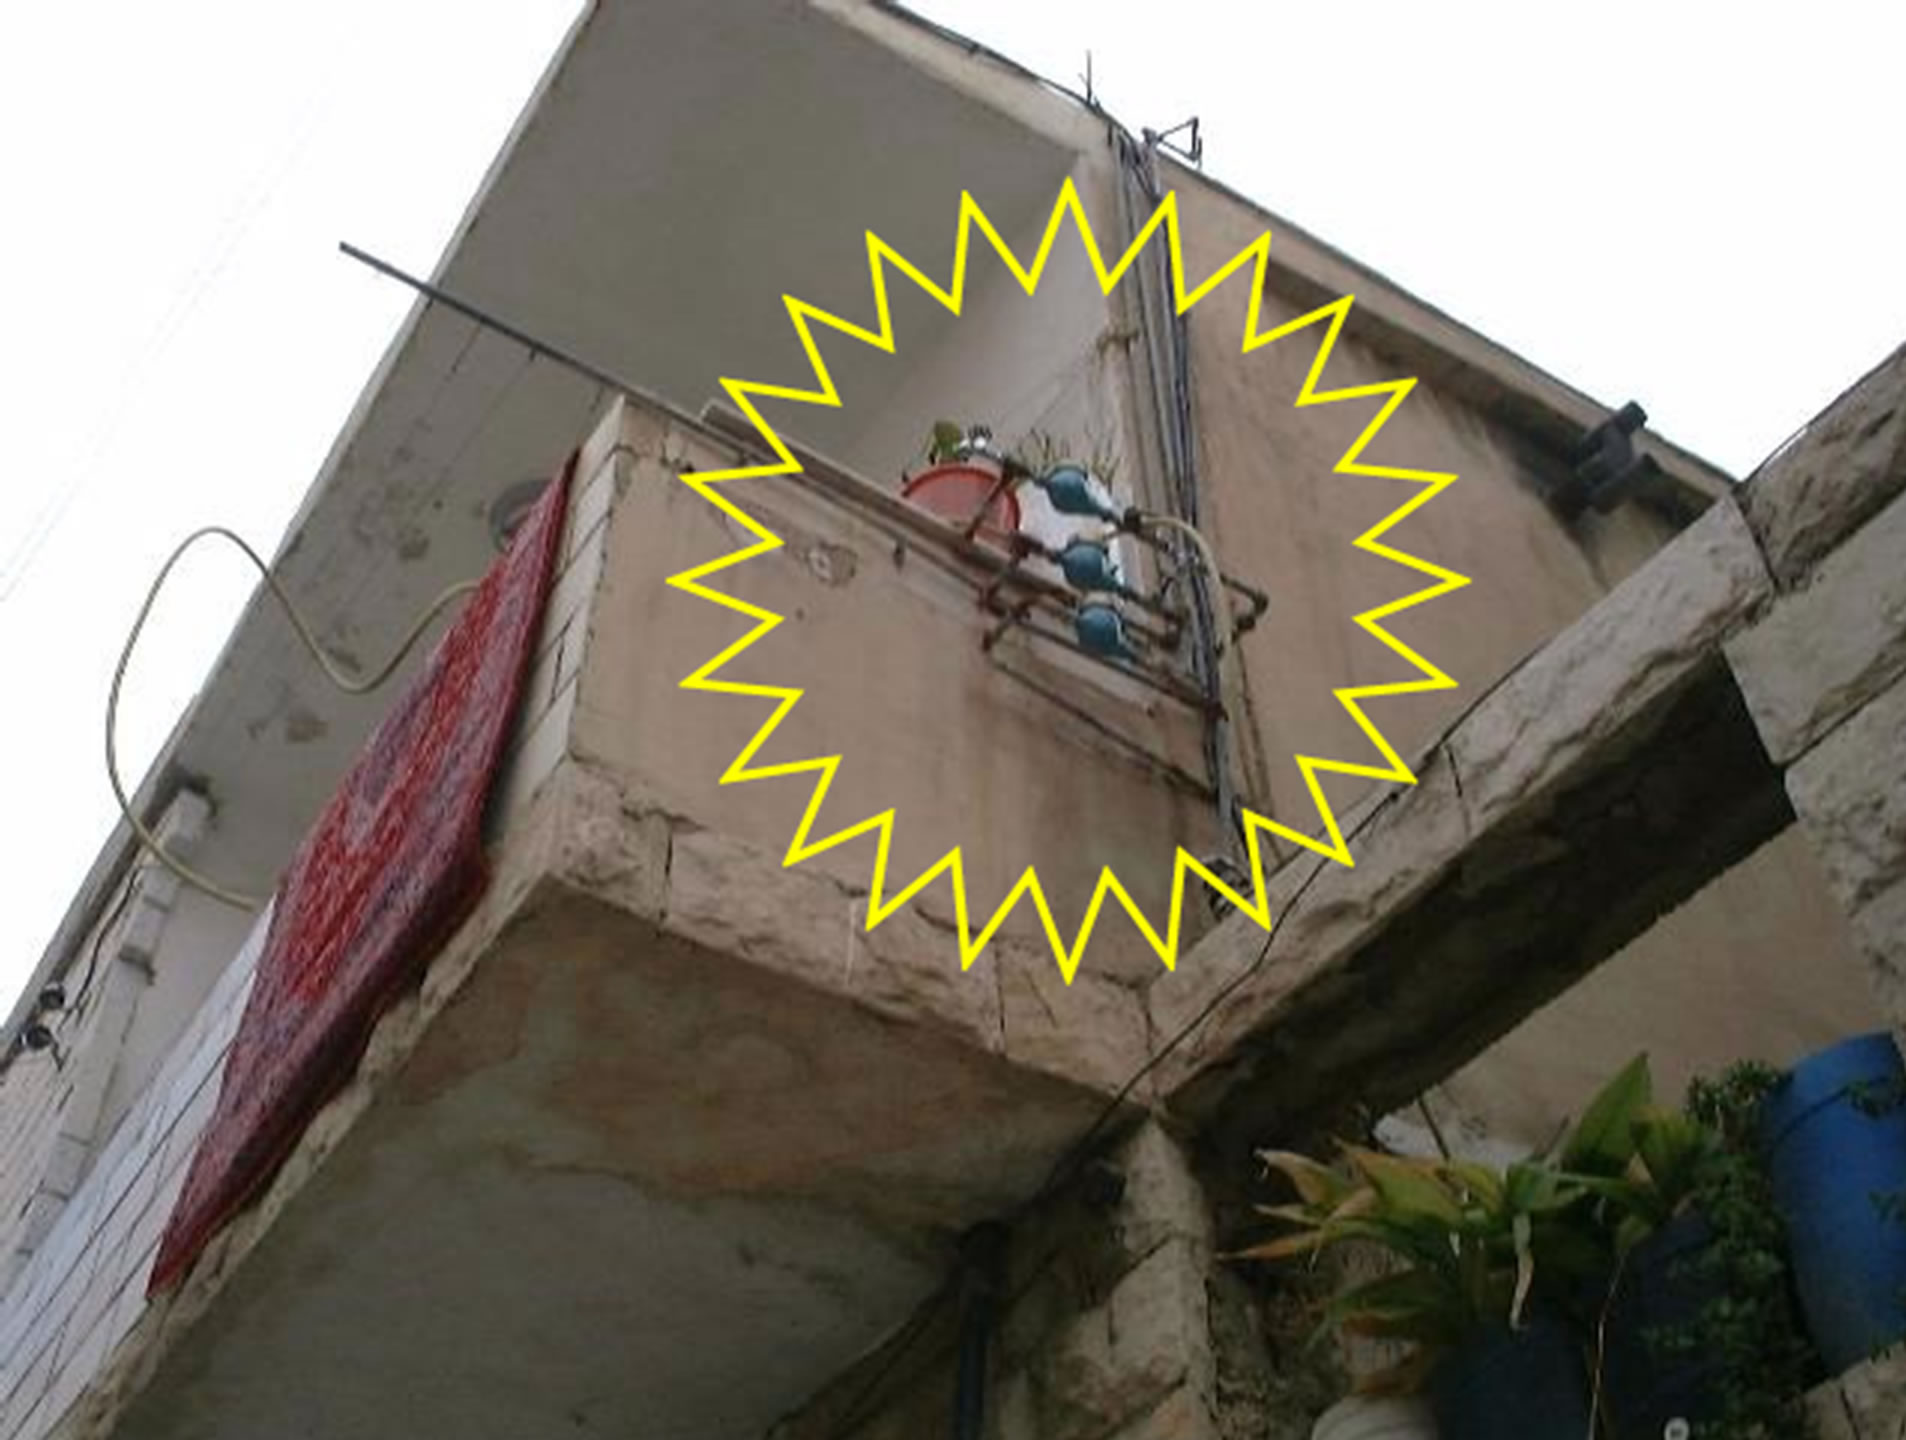
Figure 8. Examples of administrative loss in Mafraq: up—the meter is removed and replaced by a T-joint; middle—pipe connection passing the meter; down—connection to supply the housing unit before the meter.
of water lost;
Fourth method: calculating the loss using the tariff set by water authority. According to this tariff, the cost of one cubic meter is 0.7 USD (0.43 USD operational costs and 0.29 USD water cost).
Using the above four methods the cost of water lost in
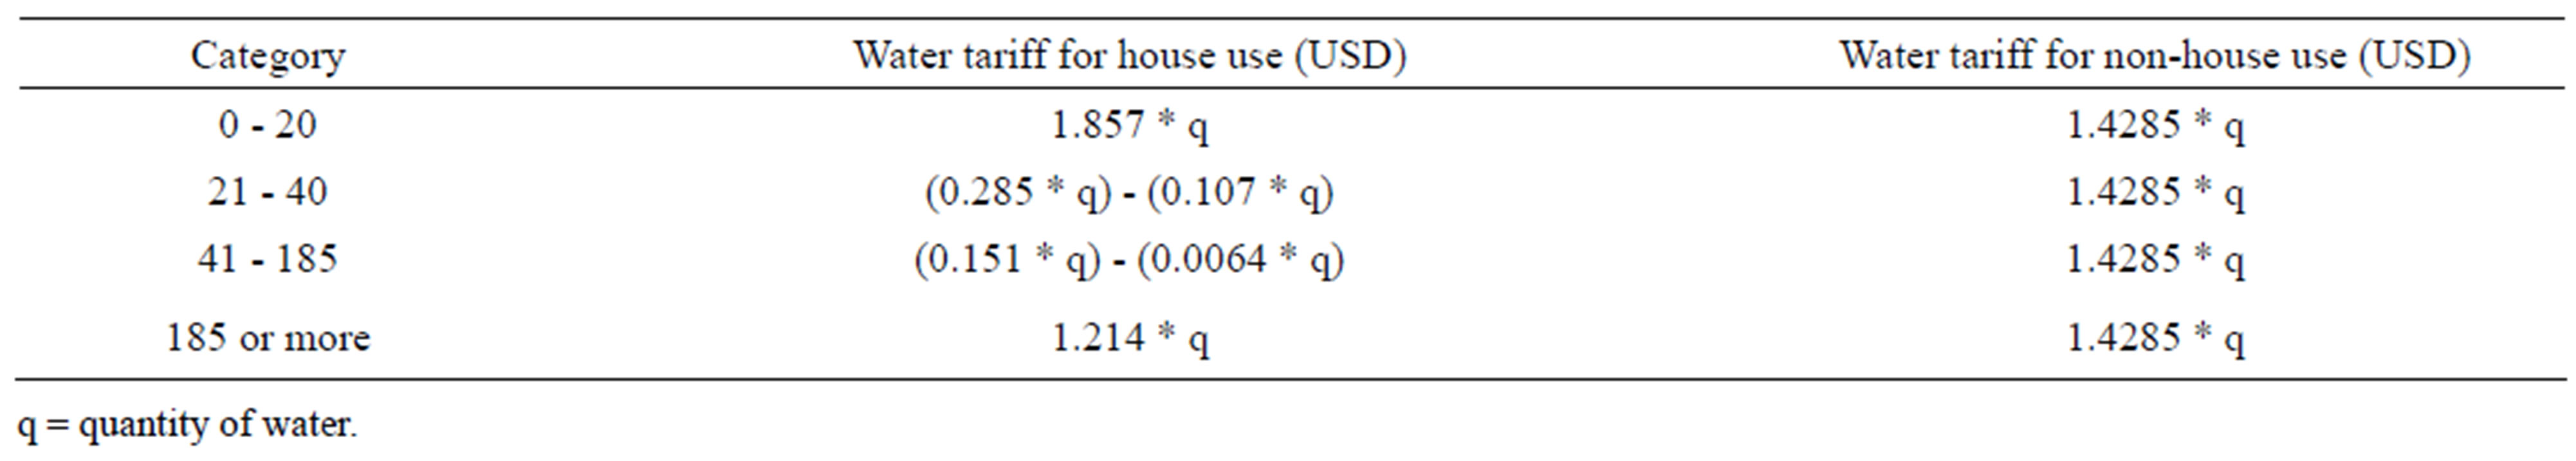
Table 11. Water tariff according to the Jordanian Ministry of Water Resources.
Mafraq Governorate was calculated for the year 2004 (Table 12). The estimated cost using the second method was the maximum cost (52,602,434), while the third method gave the minimum cost (3,610,244). This implies that the unit price of the lost water varies from 4.821 to 0.330 USD.
5. POTENTIAL SOLUTIONS
There are several methods, which can be used to minimize water loss. According to the situation in Mafraq water authority, it is possible to minimize the water loss as follows.
5.1. Technical Issues
There are some pipes that should be renewed or replaced. There are other pipes requires maintenance.
Meters should be installed on all the wells and to be regularly maintained.
Develop a mechanism to calculate the amount of water lost between sources and pumping stations during partial power failure.
Increasing Badia water stations: the quantity of water to be used in such stations should be measured. The existence of such stations will minimize the illegal use of water.
Police and water authorities should work together to minimize illegal water use.
5.2. Administrative Issues
Replacing broken meters with suitable meters;
Classifying the consumers according to their water consumption;
Constructing well trained maintenance personnel;
Enhancing application of governance in order to decentralize actions;
Training personnel to be field orientation and increase their capacity to make a decision in the field;
Use job description for the different technical staff as a reference for training;
Water awareness program should be adopted.
6. CONCLUSION
Mafraq Governorate has the maximum water loss rela-
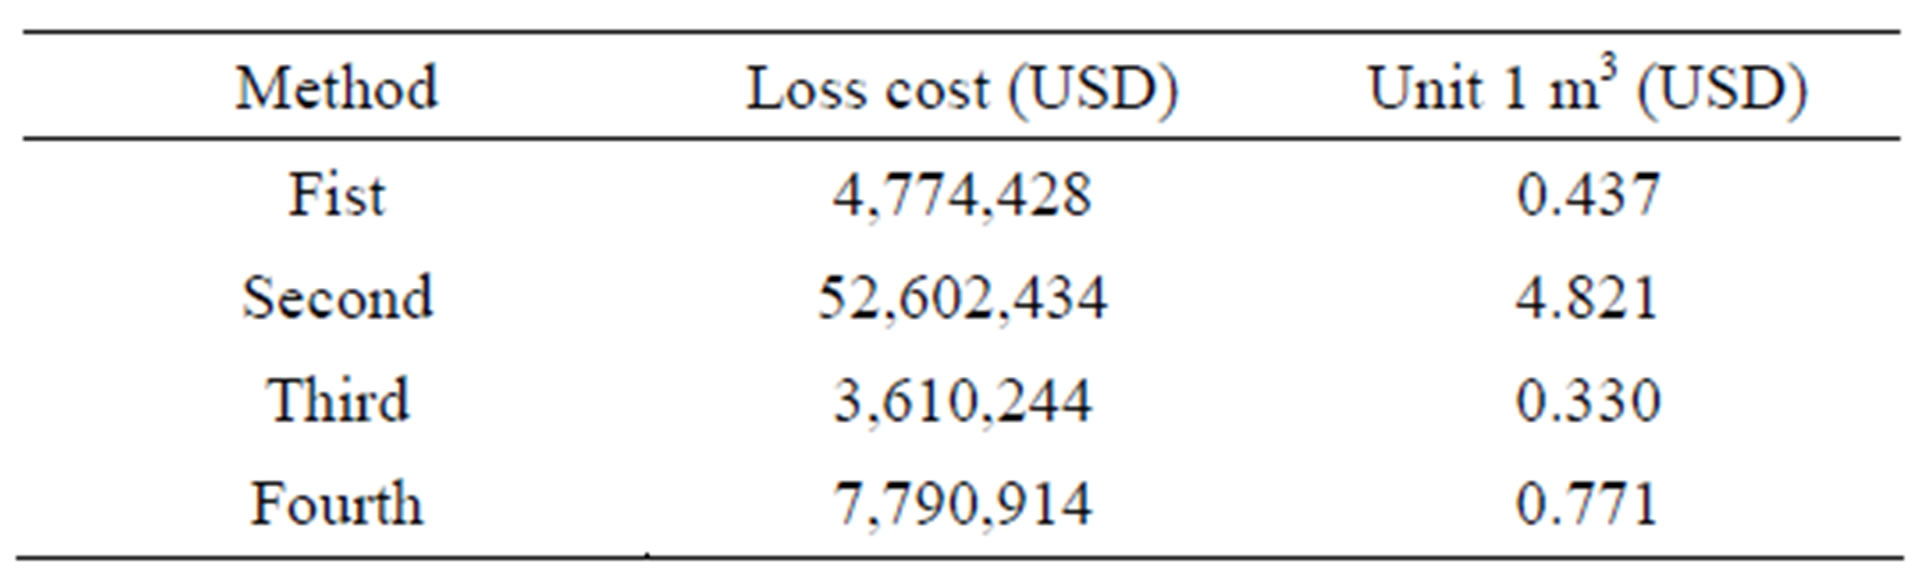
Table 12. Cost of water loss in Mafraq using four methods for the year 2004.
tive to other governorates in Jordan. Analysis of six years records from the Ministry of Water and Irrigation and Water Authority in Mafraq indicated that the average annual water loss reaches 12,839,140 m3. These losses are either technical or administrative losses. The cost of losses calculated using four different methods, which indicated that one cubic meter cost the water authority 0.33 to 4.82 USD. Prudent management and maintenance can reduce these losses tremendously.
7. ACKNOWLEDGEMENTS
The Jordanian Ministry of Water and Irrigation as well as the Water Authority of Mafraq kindly allowed the authors to read their records and supplied them with the required information.
The authors would like to thank Dr. Erik Vanhatalo, Luleå University of Technology, Sweden, for his support and valuable discussion and advice.
REFERENCES
- Al-Ansari, N.A. (1998) Water resources in the Arab countries: Problems and possible solutions. Water: A Looming Crisis?—UNESCO International Conference on World Water Resources at the Beginning of the 21st Century, Paris, 3-6 June 1998, 367-376.
- Salameh, E. and Udluft, P. (2001) Towards a water strategy for Jordan. Hydrogeologie und Mwelt, Wurzburg.
- Alkadhar, R., Sheely, W. and Al-Ansari, N.A. (2005) Jordan’s water resources, supply and future demands. Journal of International Water, 30, 294-302. doi:10.1080/02508060508691870
- MWI (Ministry of Water and Irrigation) (1998) The study on water resources management in the Hashemite Kingdom of Jordan—Interim report. Ministry of Water and Irrigation, Amman.
- MWI (Ministry of Water and Irrigation) (2001) Annual report. http://www.emwisjo.org/Intro_wtr_Resourceshtm#Water%20Resources
- World Bank (1997) Water sector review: Report No. 17095-JO. World Bank, Washington DC.
- MWI (Ministry of Water and Irrigation) (2005) Report on administrative consumption. MMU Unit-MWI, Amman.
- Charalambous, B. (2002) Leakage management: A practical approach. Water Board of Lemesos, Cyprus, 326.
- WAJ, SAFEGE, SIGMA (1998) Analysis of water systems in the Mafraq Governorate, final report: Volume 1: Main report. The French Government, Paris. http://www.emwisjo.org/Intro_wtr_Resourceshtm#Water%20Resources
- Akel, N. (2005) Water crises and industrial production. 1st Edition, Moasasat al Murshed for Advertisement and Publications, Amman.
- Sukar, W. (2001) Water loss training course. JICA in Water Authority of Jordan, Amman.
- Shinoda, B. (2005) Sources of drinking water loss. The Arabic Center for Studies and Consultancy Work, Cairo.