Natural Science
Vol.4 No.8A(2012), Article ID:21654,16 pages DOI:10.4236/ns.2012.428081
Three-dimensional seismic attenuation tomography of Egypt
![]()
1National Research Institute of Astronomy & Geophysics, Cairo, Egypt; *Corresponding Author: elsayed_fergany@hotmail.com
2Department of Geosciences, Universidad Nacional de Colombia, Bogota, Colombia
Received 21 May 2012; revised 20 June 2012; accepted 5 July 2012
Keywords: Seismic Coda Waves; Attenuation Tomography; Seismicity; Tectonic; Geothermal; Geologic Epoch
ABSTRACT
The main purpose of this paper is assessing the three-dimensional (3-D) seismic tomography beneath Egypt to reveal the laws of the tectonic activity, dynamic features of the crust and the upper mantle as well as the thermal structure. Thecoda wave attenuation ( ) was obtained using the single scattering theory for the central frequencies of interest laid between 1 and 24 Hz. A regionalization of the estimated
  values was performed by means of a generalized inversion technique.The obtained spatial distribution of 3-D attenuation results reveals high contrasts between East and West Egypt. A remarkable contrast in the attenuation levels was compared with the tectonic structures, geothermal gradient and heat flow features. The highest attenuations are concentrated in the east and north western offshore regions at central frequency 1.5 Hz that draw a good matching with the seismic and thermal features of Egypt. Smaller attenuation levels were detected with young sediments of the Nile Valley from South to the northern triangle of Nile Delta basin except seismic active areas. Low or normal attenuation was detected at western desert where there is a stable and simple shelf. We can conclude that the extended highest attenuation joins to the strong seismic sources and geothermal structures at lower frequency and the centralized high attenuation takes place at moderate seismic sources at a higher frequency. The 3D attenuation maps can draw not only tectonic and geothermal structures but also the general geologic structure map.
1. INTRODUCTION
There are many reasons to study the attenuation of seismic waves. Variations in regional attenuation (1/Q) can help with structure and tectonic interpretation [1]. Local and regional distance attenuation of seismic phases is important in earthquake hazard prediction. Quantifying seismic wave attenuation and correcting for its effects improves source parameter studies, which will aid in discrimination of small nuclear tests from naturally occurring earthquakes [2-4]. At the same time as developments in theoretical models for relating scattering with coda wave amplitudes were advancing the study of seismic wave attenuation in the Earth’s lithosphere during the last decade, quantitative estimations of the attenuation parameters were carried out in many regions of the world. The decay rate of the coda amplitudes ( ) estimated within the framework of the single-scattering theory [5,6] has also proved useful for seismologists because the simplicity of its measurement allows the study of geographical and temporal variations relatively easily. The physical meaning of
  has been debated for many years [7]. At present, it is known that whereas some theoretical and experimental model studies have confirmed that it only measures the intrinsic absorption [8-10], the field observations show that in general
  consists of intrinsic absorption (
 ) and total attenuation (
 ) [11]. Knowledge of regional values of
  and its spatial variation is of considerable interest in relation to tectonics and seismicity, being an important subject in seismic risk analysis and engineering seismology [12,13].
Egypt is located on the southeastern part of the Eastern Mediterranean region (northeastern corner of the African continent) and bounded by three active tectonic plate margins: the African-Eurasian plate margin, the Red Sea plate margin, and the Levant transform faultas shown in Figure 1. The Eastern Mediterranean Sea is characterized by high seismicity and complex tectonics. In Egypt no full-scale systematic investigation of tomographic seismic attenuation has been conducted. Only some specific regions have been studied for 1D : Sinai Peninsula [14], North Egypt [15] and Gulf of Suez [16].
In this work, study of the 3D attenuation in the crust and the upper mantle will help us to understand more truly the tectonic activity, dynamic features of the crust and the upper mantle, as well as the thermal structure. Waveform data of 397 local and regional earthquakes (1997-2008) in the moment magnitude (3 - 5.5) recorded by 63 seismic stations belonging to the Egyptian National Seismic Network (ENSN) have been used in this study. We have utilized the single back scattering model developed by [5] and extended by [6,17] for estimation of coda wave attenuation quality factor, . For the inversion, a regionalization of the estimated
  values was performed by means of a generalized inversion technique. Several synthetic tests were done to evaluate the distribution efficiency of the events and stations. Following [12], one way to regionalize for Qc is based on the work of [18] who, expanding on the work of [5,6], realized that the first order scatterers responsible for the generation of coda waves at a given lapse time are located on the surface of an ellipsoid having earthquake and station locations as foci. The 3D
  was calculated for each central frequency ranged from 1.0 to 24 Hz avoiding the unreliable results of the marginal area.
The results clearly reveal a remarkable high contrast in the attenuation levels dependent frequency at different depths in different zones of Egypt. The remarkable high contrasts in the attenuation levels were compared with the tectonic structures geothermal gradient and heat flow data. Generally the high attenuation contrasts are concentrated in the Eastern Egypt and north western offshore region that draw a good matching with the seismic map of Egypt and thermal features. A smaller attenuation levels was detected with young sediments of the Nile Valley from South to the northern triangle of Nile Delta basin except seismic active areas. Low or normal attenuation was detected at western desert where there is a stable and simple shelf.
2. TECTONIC AND GEOTHERMAL FRAMEWORK
The tectonic deformations within Egypt are related to the regional and local tectonic forces. Egypt is located on the southeastern part of the Eastern Mediterranean region (northeastern corner of the African continent) and bounded by three active tectonic plate margins: the African-Eurasian plate margin, the Red Sea plate margin, and the Levant transform fault. The Eastern Mediterranean Sea is characterized by high seismicity and complex tectonics. Several geodynamic models have been adapted to explain the tectonic process in this region [19-21]. Figure 1 shows the tectonic boundaries and compiled tectonic elements of the Eastern Mediterranean Region by [22-24]. Seismicity data (mb ≥ 3) was compiled after [25] from (1900-1964) and ISC (1964-2005).
Generally the major part of tectonic deformation within Egypt is remote and took place along the Red Sea-Gulf of Suez, Gulf of Aqaba and offshore on the Mediterranean Sea to the south of the Hellenic and Cyprean arcs due to the rifting along the Red-Sea-Gulf of Suez, left lateral movement along the Gulf of Aqaba and the subduction of the African plate beneath the Eurasian plate. Recent seismicity data clarify that, all inland seismic activity in Egypt lies conformable over the pre-existing E-W and WNW-ESE or NW-SE faults. There is a clear correlation between the principal areas of current geothermal development [26,27] and the seismically active boundaries of the moving segments of lithosphere defined by the plate tectonic models of the earth [28].
Spatial distribution of earthquake epicenters indicates that Egypt suffered from both interplate and intraplate earthquakes. Most earthquake activity (more than 70%) has been concentrated in northern Egypt along the northern Red Sea and its two branches Suez rift and AqabaDead Sea transform. The crustal thickness for the whole Egypt is between 20 and 34 km. Its thickness thins abruptly towards the Red sea coast 20 km. The crust decreases from 34 km in the western desert to 28 km at the Mediterranean Sea Coast. According to the epicenteral distribution of earthquakes and tectonic setting, seven local seismic zones labeled from 1 to 7 were recognized by [29] in Figure 1 as follows:
1) Gulf of Suez-northern part of the Eastern Desert zone; 2) Gulf of Aqaba zone; 3) East MediterraneanCairo-Fayum Pelusiac zone; 4) Egyptian Mediterranean Coastal Dislocation zone; 5) Southwest Cairo zone; 6) Abu-Dbab zone; 7) Aswan zone.
[31] estimated preliminary heat flow values ranging from 42 to 175 m·Wm–2 have been estimated for Egypt from numerous geothermal gradient determinations with a reasonably good geographical distribution, and a limited number of thermal conductivity determinations. Figures 2 and 3 show the spatial distribution of the borehole temperature logging sites and water sample locations for the heat flow study. For northern Egypt and the Gulf of Suez, gradients were calculated from oil well bottom hole temperature data; east of the Nile, and at three sites west of the Nile, gradients were calculated from detailed temperature logs in shallow boreholes. Withone exception, the heat flow west of the Nile and in northern Egypt is estimated to be low, 40 - 45 m·Wm–2, typical of a Precambrian Platform province. A local high, 175 m·Wm–2, is probably due to local oxidational heating or water movement associated with a phosphate mineralized zone. East of the Nile, however, including the Gulf of Suez, elevated heat flow is indicated at several sites, with a high of 175 m·Wm–2 measured in a Precambrian granitic gneiss approximately 2 km from the Red Sea coast.

Figure 1. Tectonic boundaries and shallow seismicity pattern (h ≤ 60 km) of the Eastern Mediterranean Region. AEG = Aegean Sea; Al = Alexandria City; CY = Cyprus; ERA = Eratosthenes Seamount; FL = Florence; IB = Ionian Basin; MR = Mediterranean Ridge; LEV = Levantine Basin; LF = Levant Fault (after [30]).
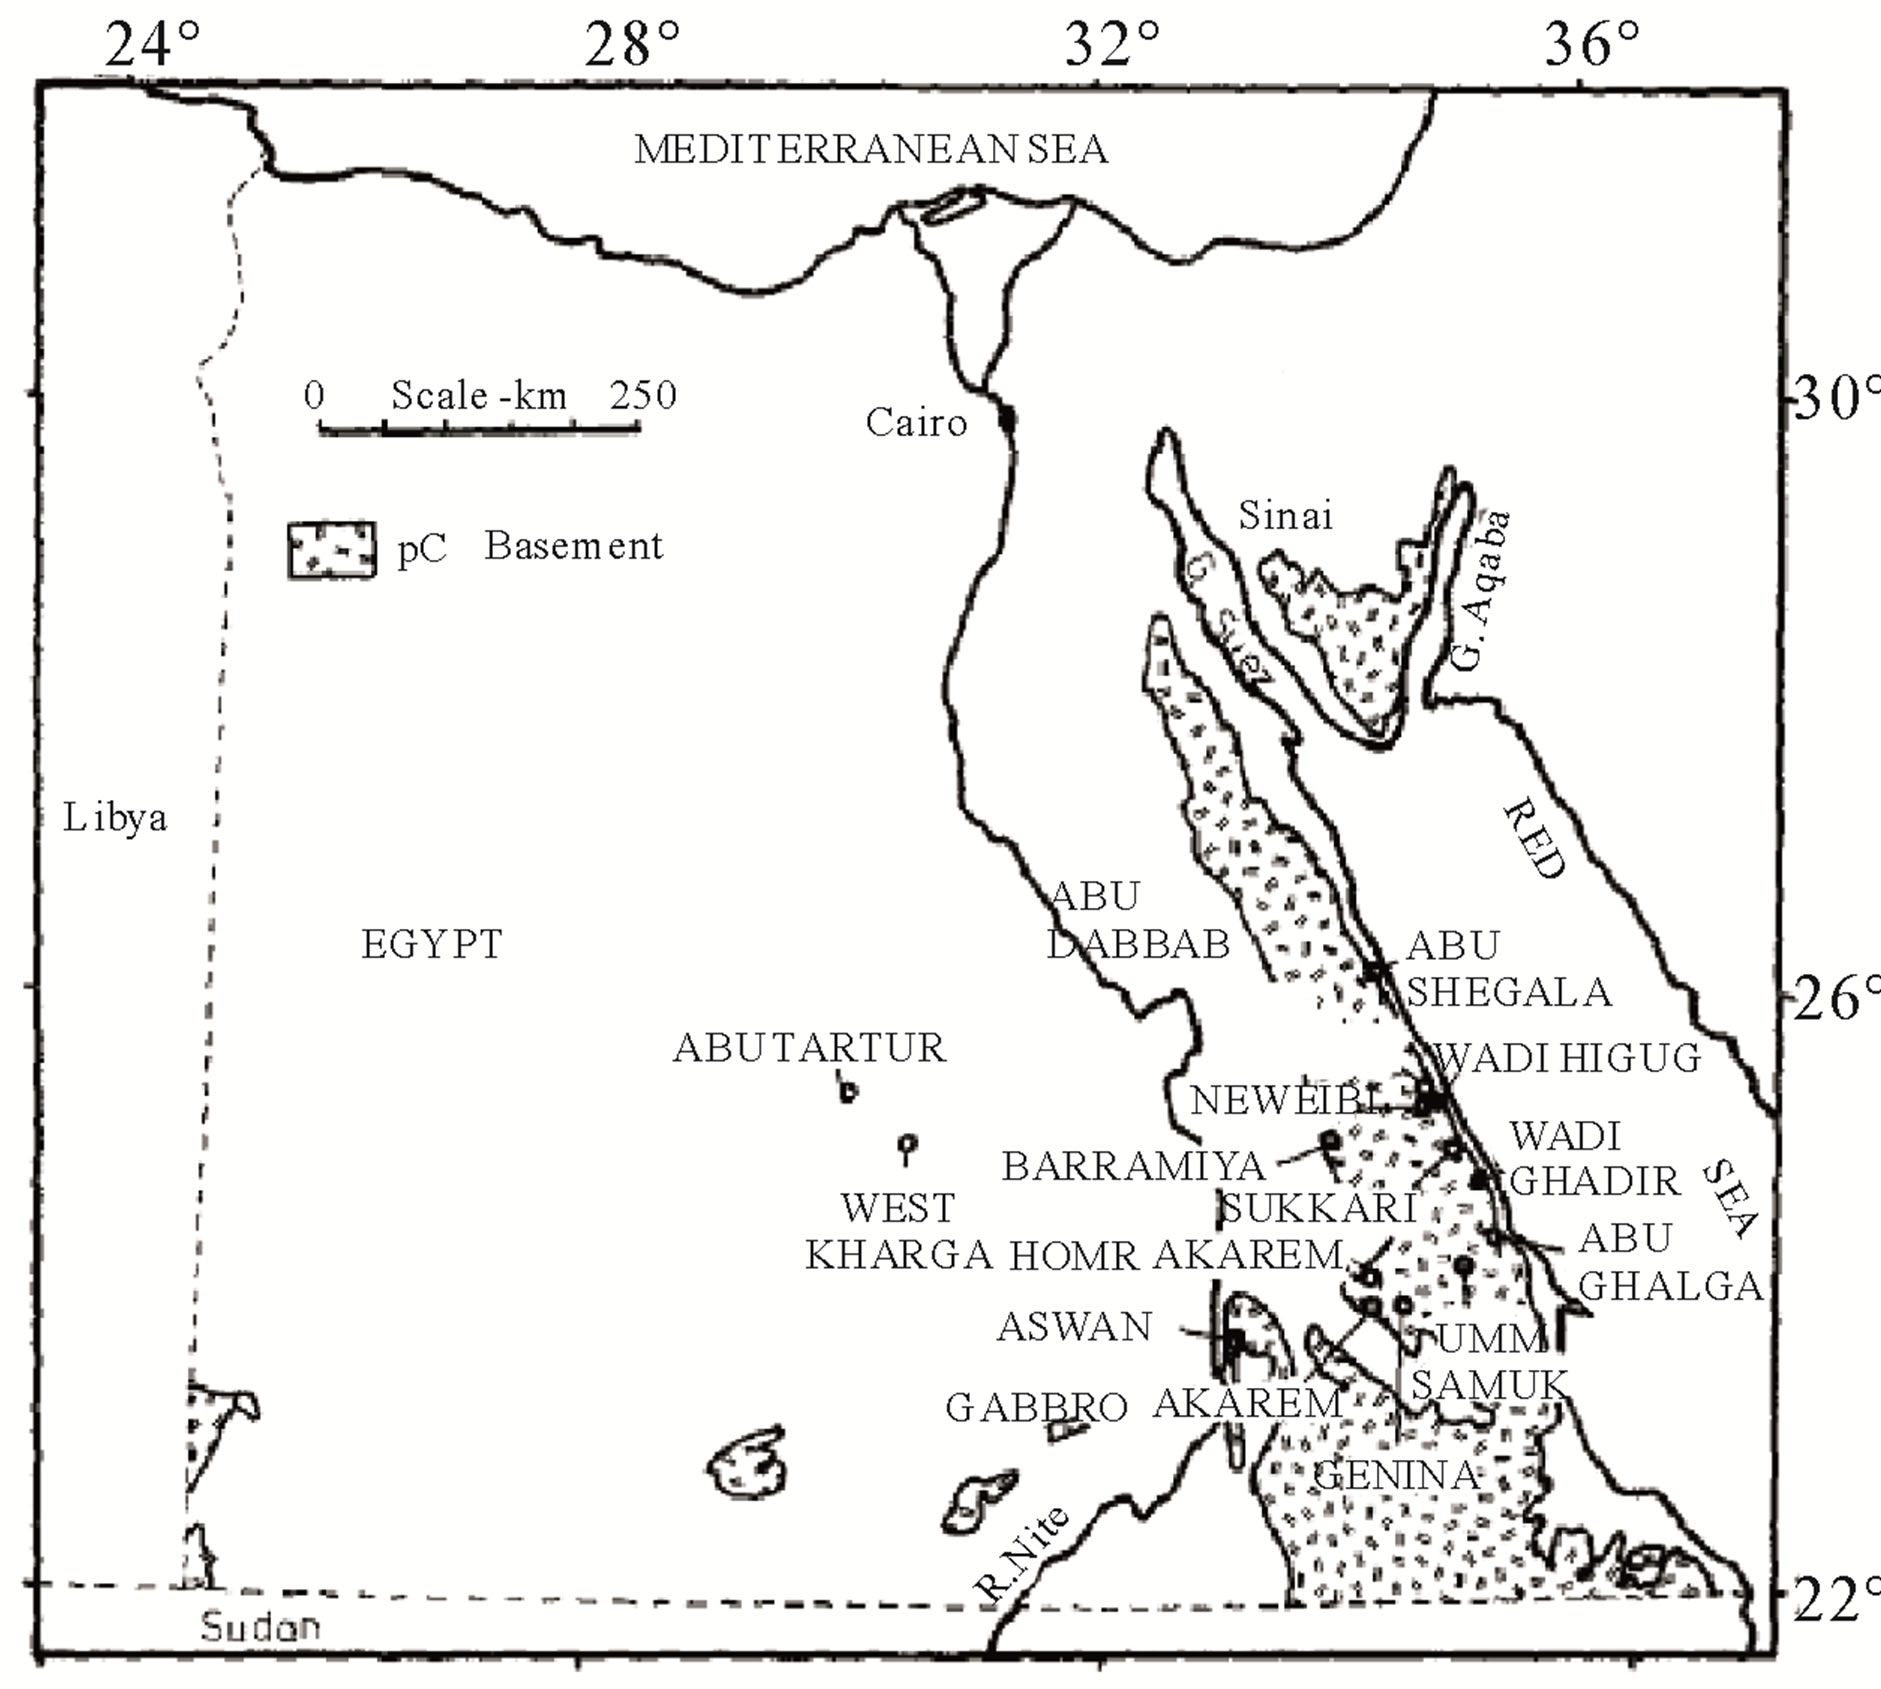
Figure 2. Locations of borehole temperature logging sites in Egypt excluding oil well data sites [31].
Egypt geothermal gradient data and Preliminary heat flow values were summarized in Tables 1 and 2 by [31]. These data indicate potential for development of geothermal resources along the Red Sea and Gulf of Suez coasts. Microearthquake monitoring and gravity data indicate that the high heat flow is associated with the opening of the Red Sea.
3. DATA
Waveform data of 397 local and regional earthquakes (1997-2008) in the moment magnitude (3 - 5.5) recorded by 63 seismic stations belonging to the Egyptian National Seismic Network (ENSN)have been used in this study. The ENSN starts operating in August 1997 and implemented in 2003. Seismological stations are composed byshort period stations (STS1 and L4C seismometer type) with natural frequency 1 Hz and broadband stations (STS2 and Trillium seismometer type) as shown in
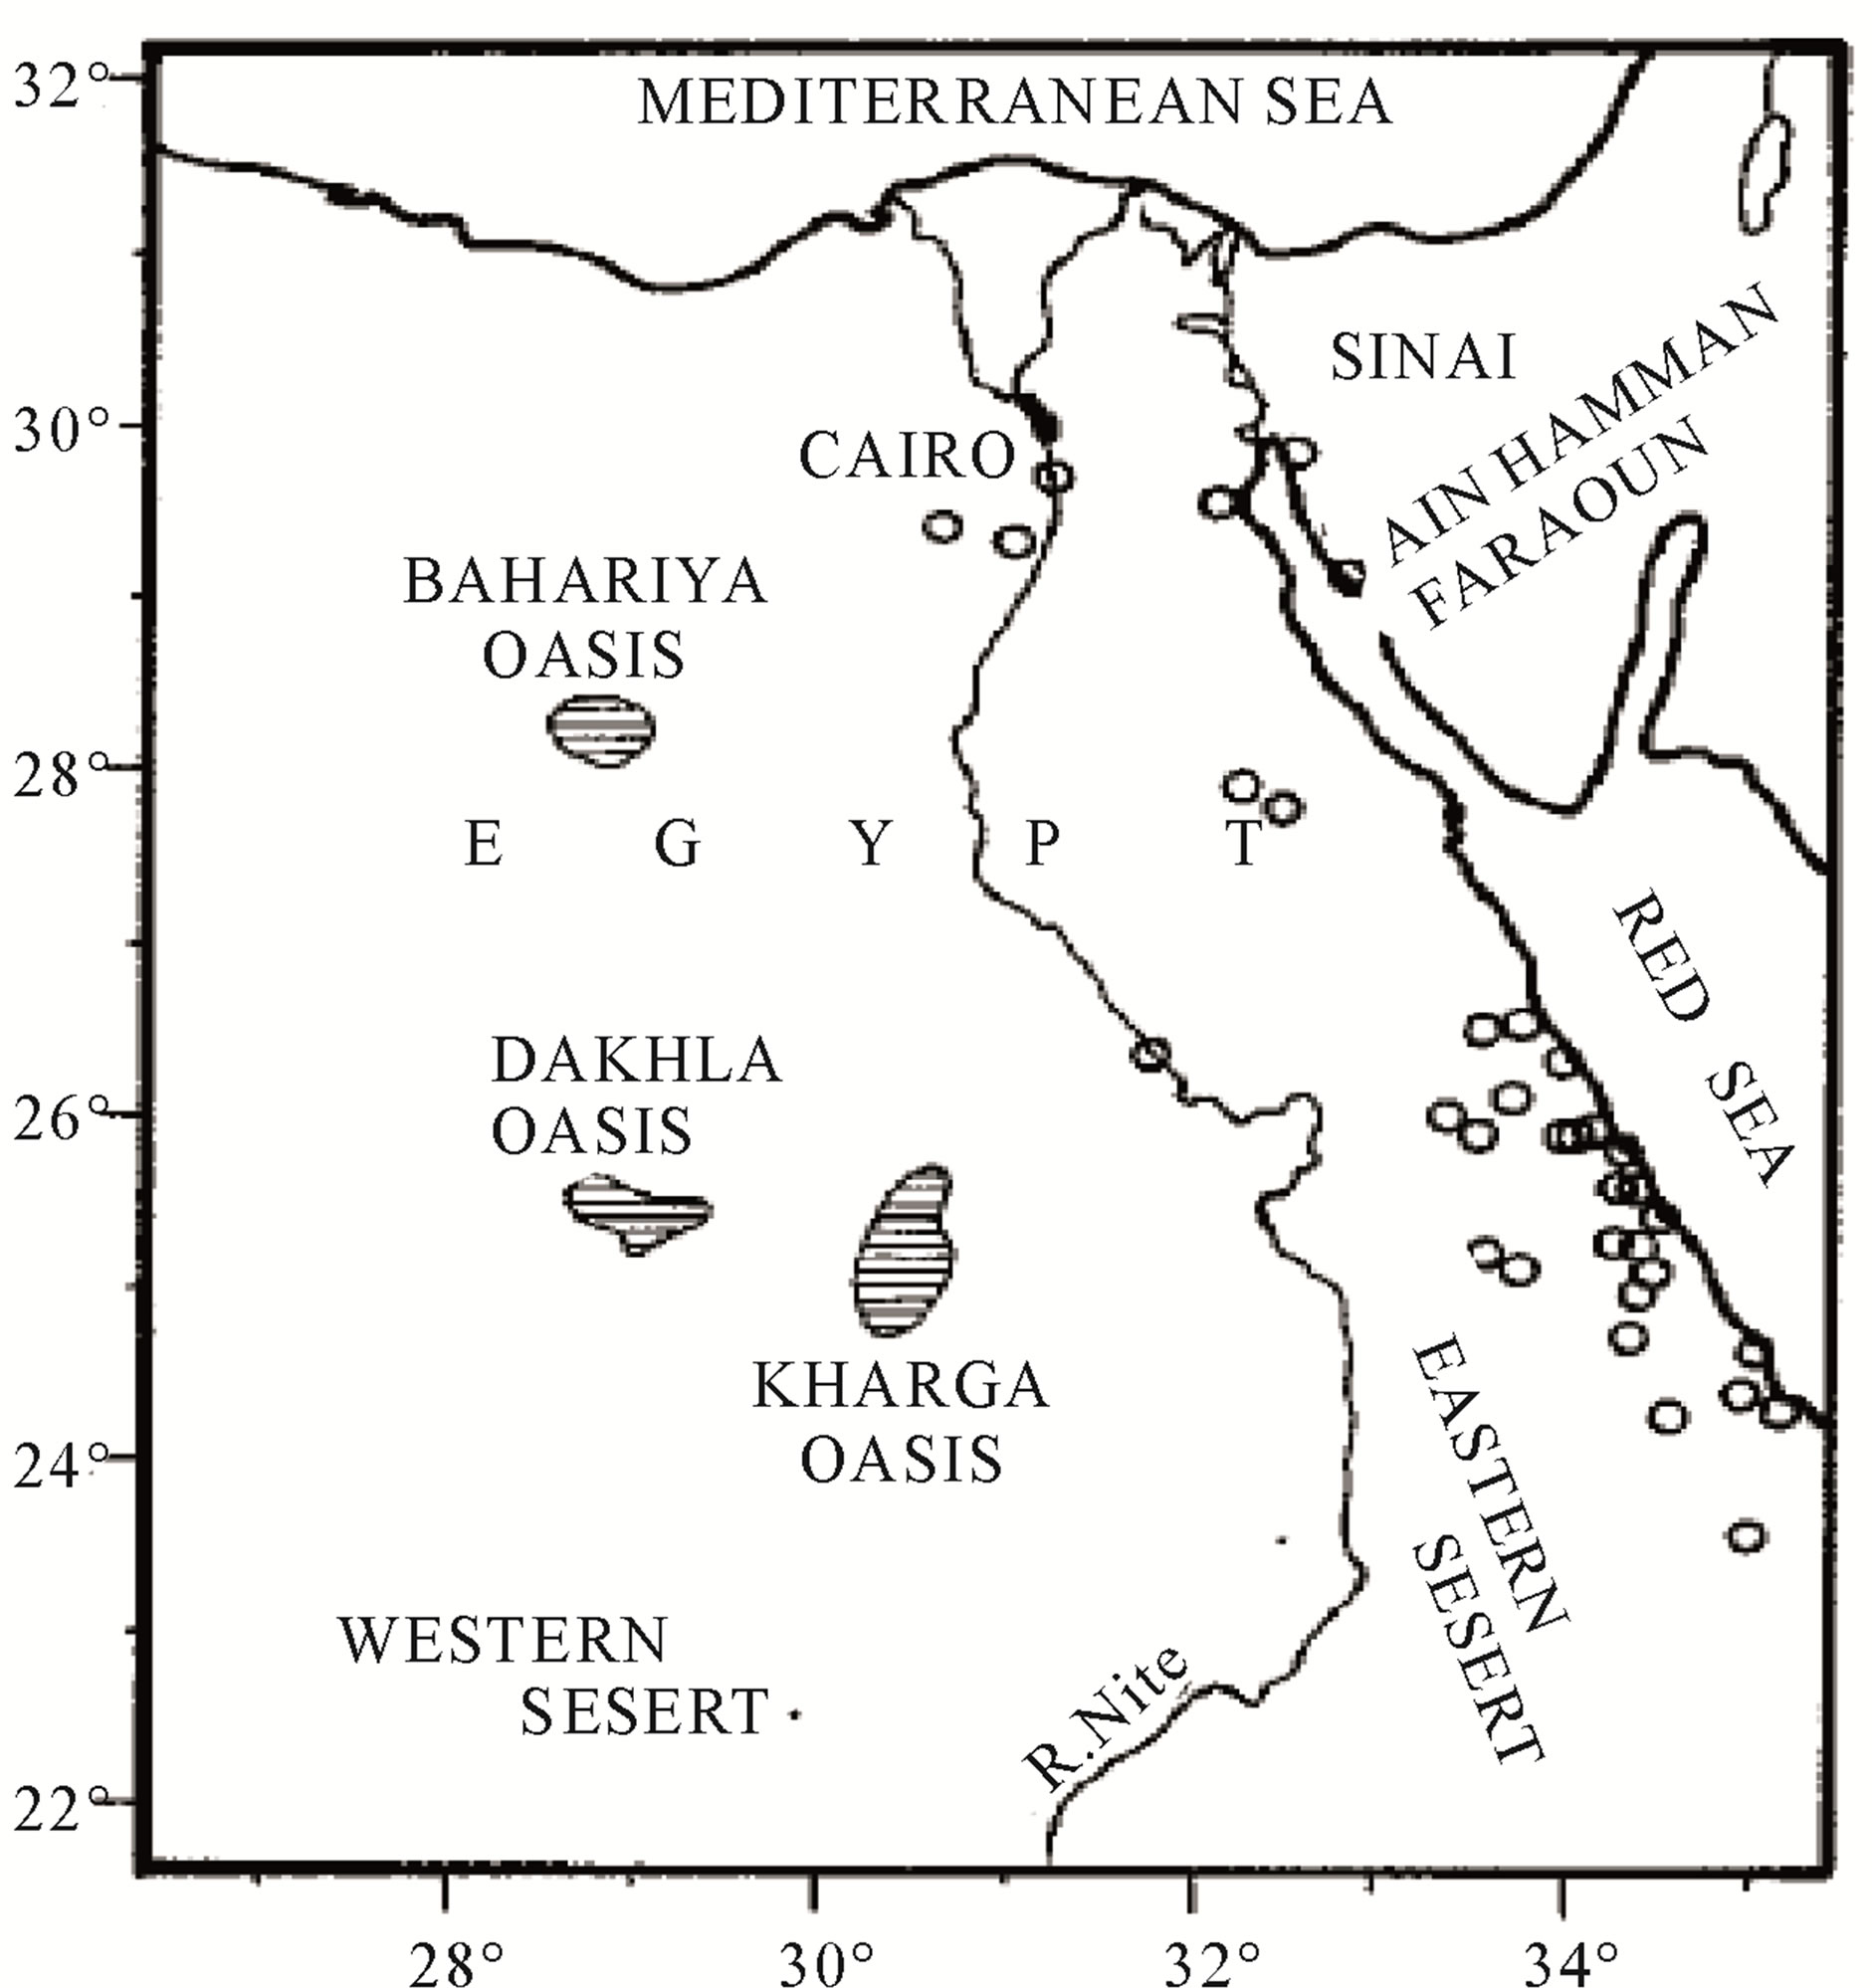
Figure 3. Map of water sample locations for the water geothermometry study. Open circles indicate single or multiple sample sites. The ruled areas indicate major oases from which multiple samples were collected [31].
Figure 4. The seismological acquisition at the ENSN is a fully automated and network system dedicated to the digital acquisition and real-time processing of seismological data. All digital recording instruments are equipped with velocity sensors and 24-bit analogue-to-digital converter. The data are digitized at a sampling rate of 100 samples/sec. Figure 5 shows the spatial distribution map of the earthquakes that used in this study.
4. METHODOLOGY
4.1. Qc Estimation
We have utilized the single back scattering model developed by [5] and extended by [6,17] for estimation of coda wave attenuation quality factor, . This model is based on the following assumptions:
1) Scattering is a weak process and doesn’t produce any secondary (multiple) when it encounters anther scatter. This so call Born approximation, which violates the energy conservation law but has been accepted in various physical problems and used successfully in high frequency seismic waves analysis.
2) As the coda waves arrive long time after arrival of all direct waves (p, s and surface waves) the source and
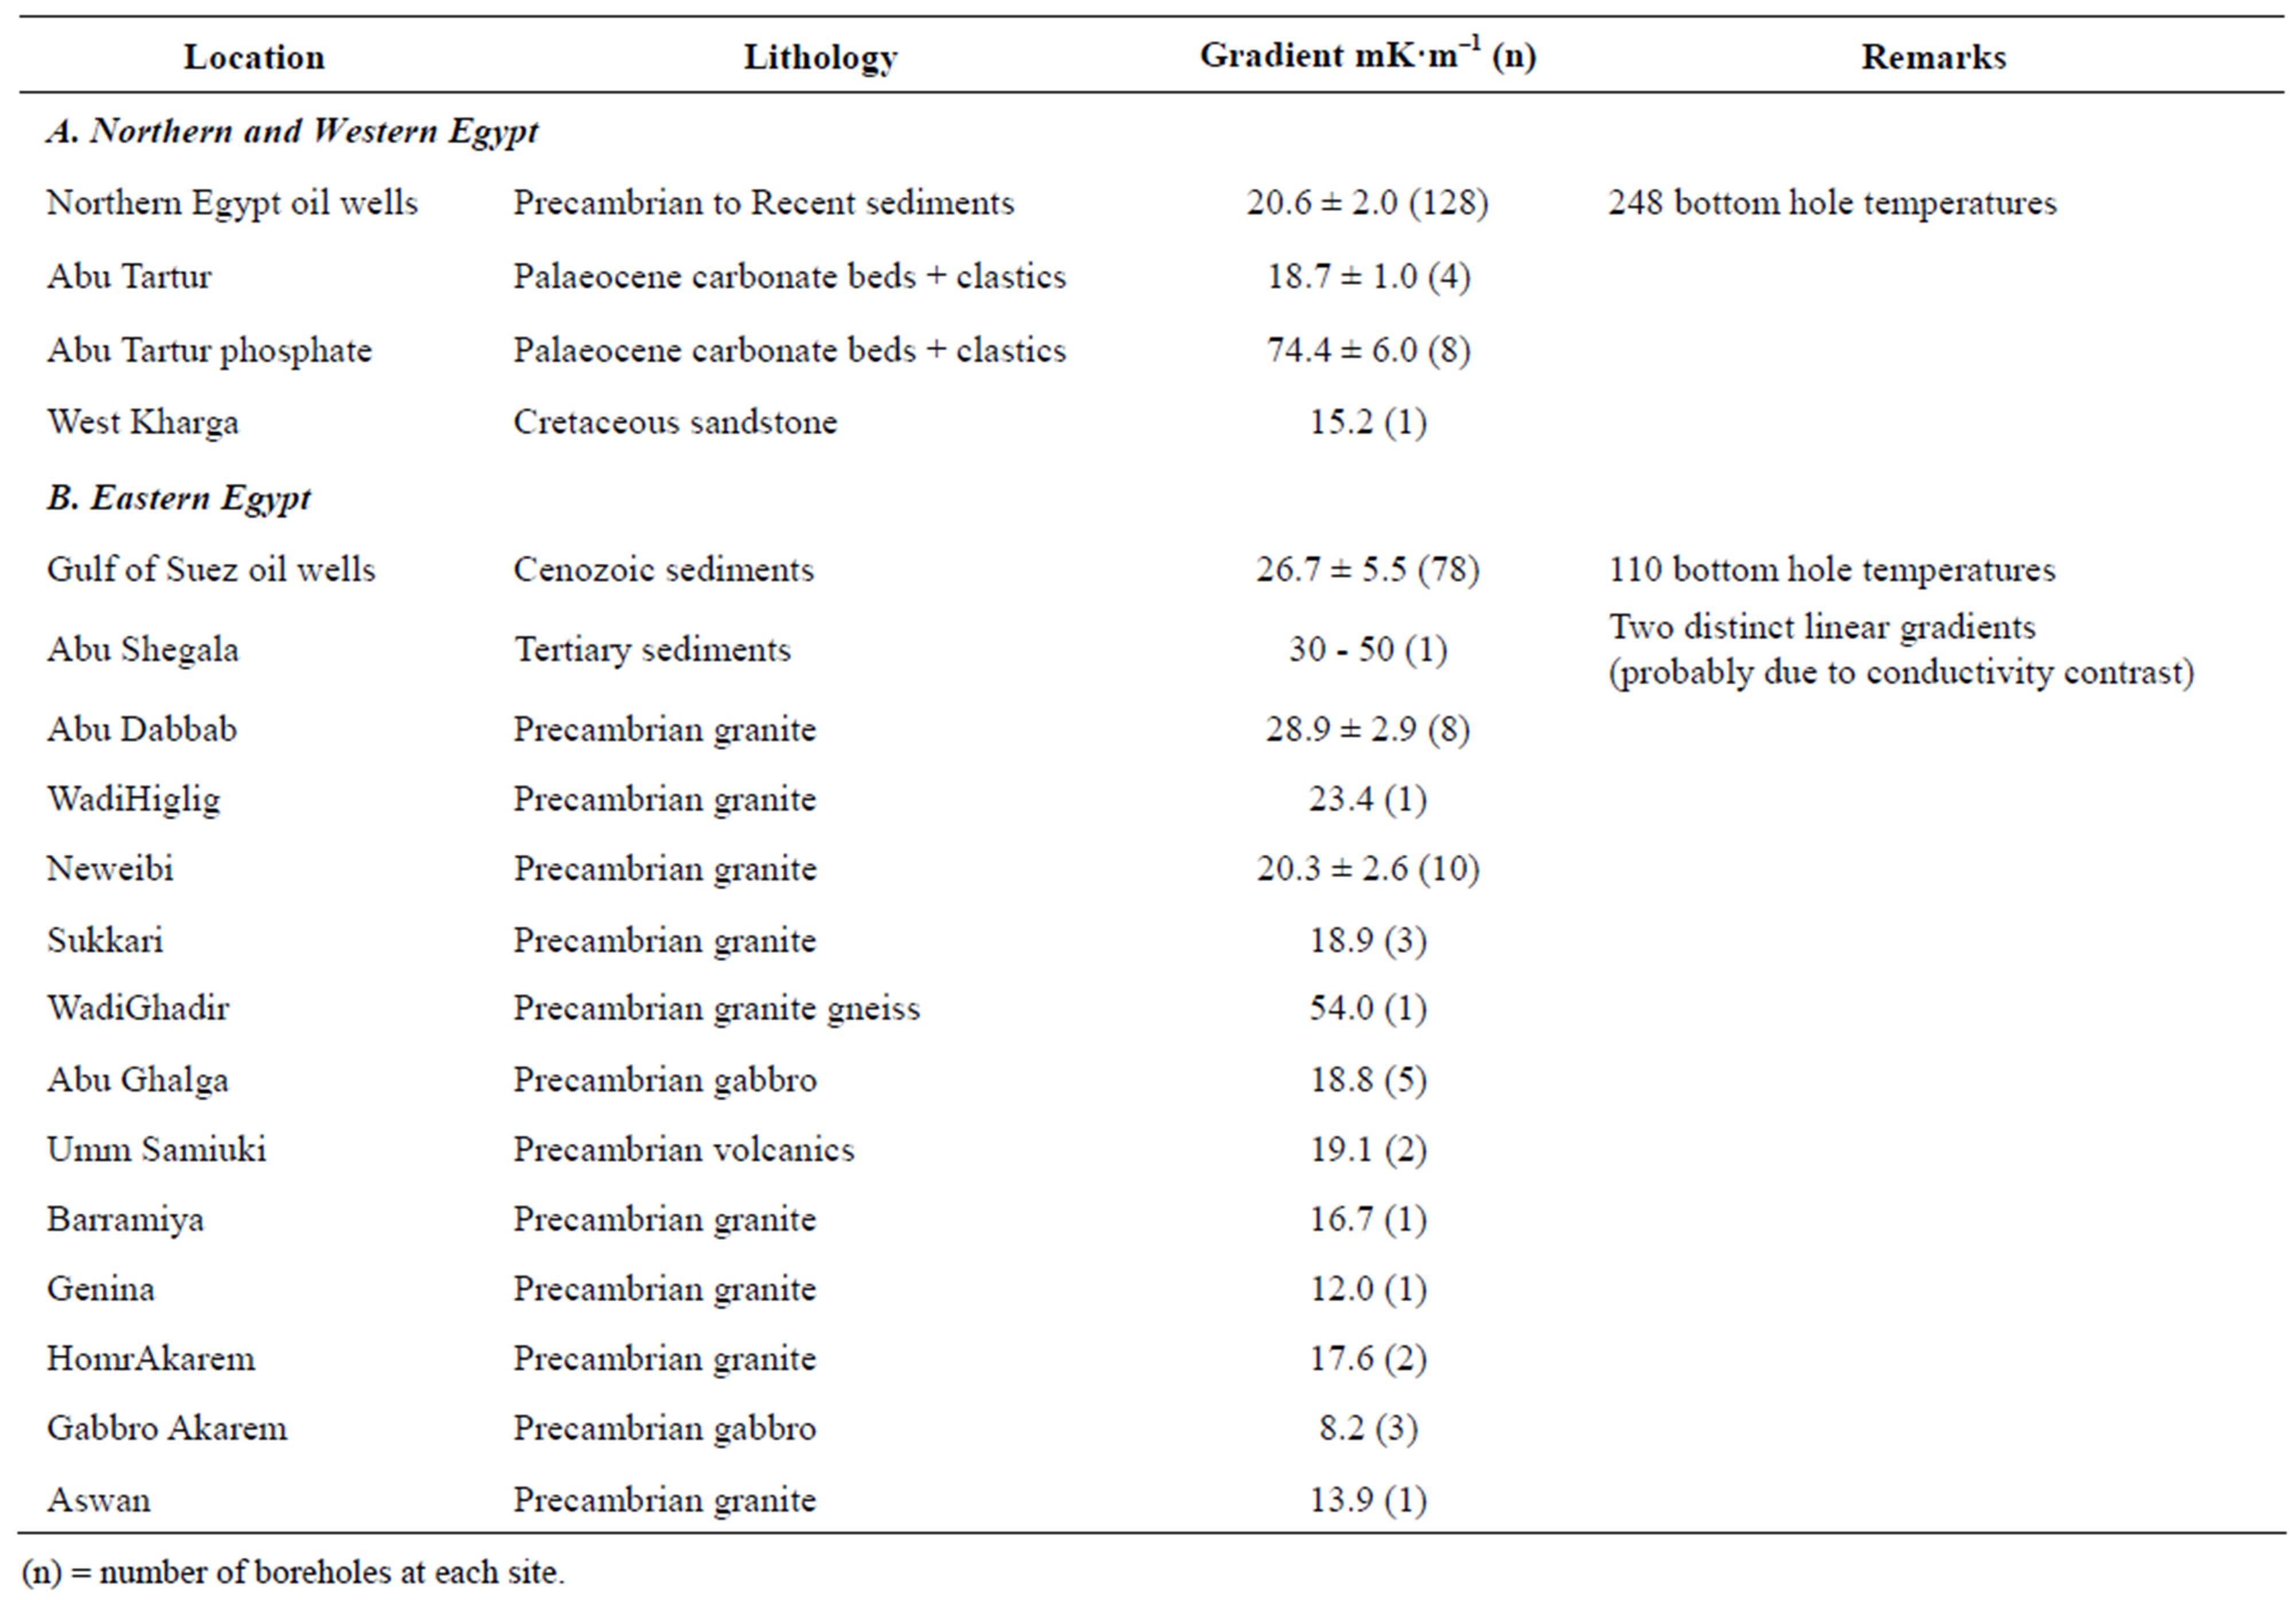
Table 1. Egypt geothermal gradient data [31].

Table 2. Preliminary Eastern Egypt heat flow values [31].
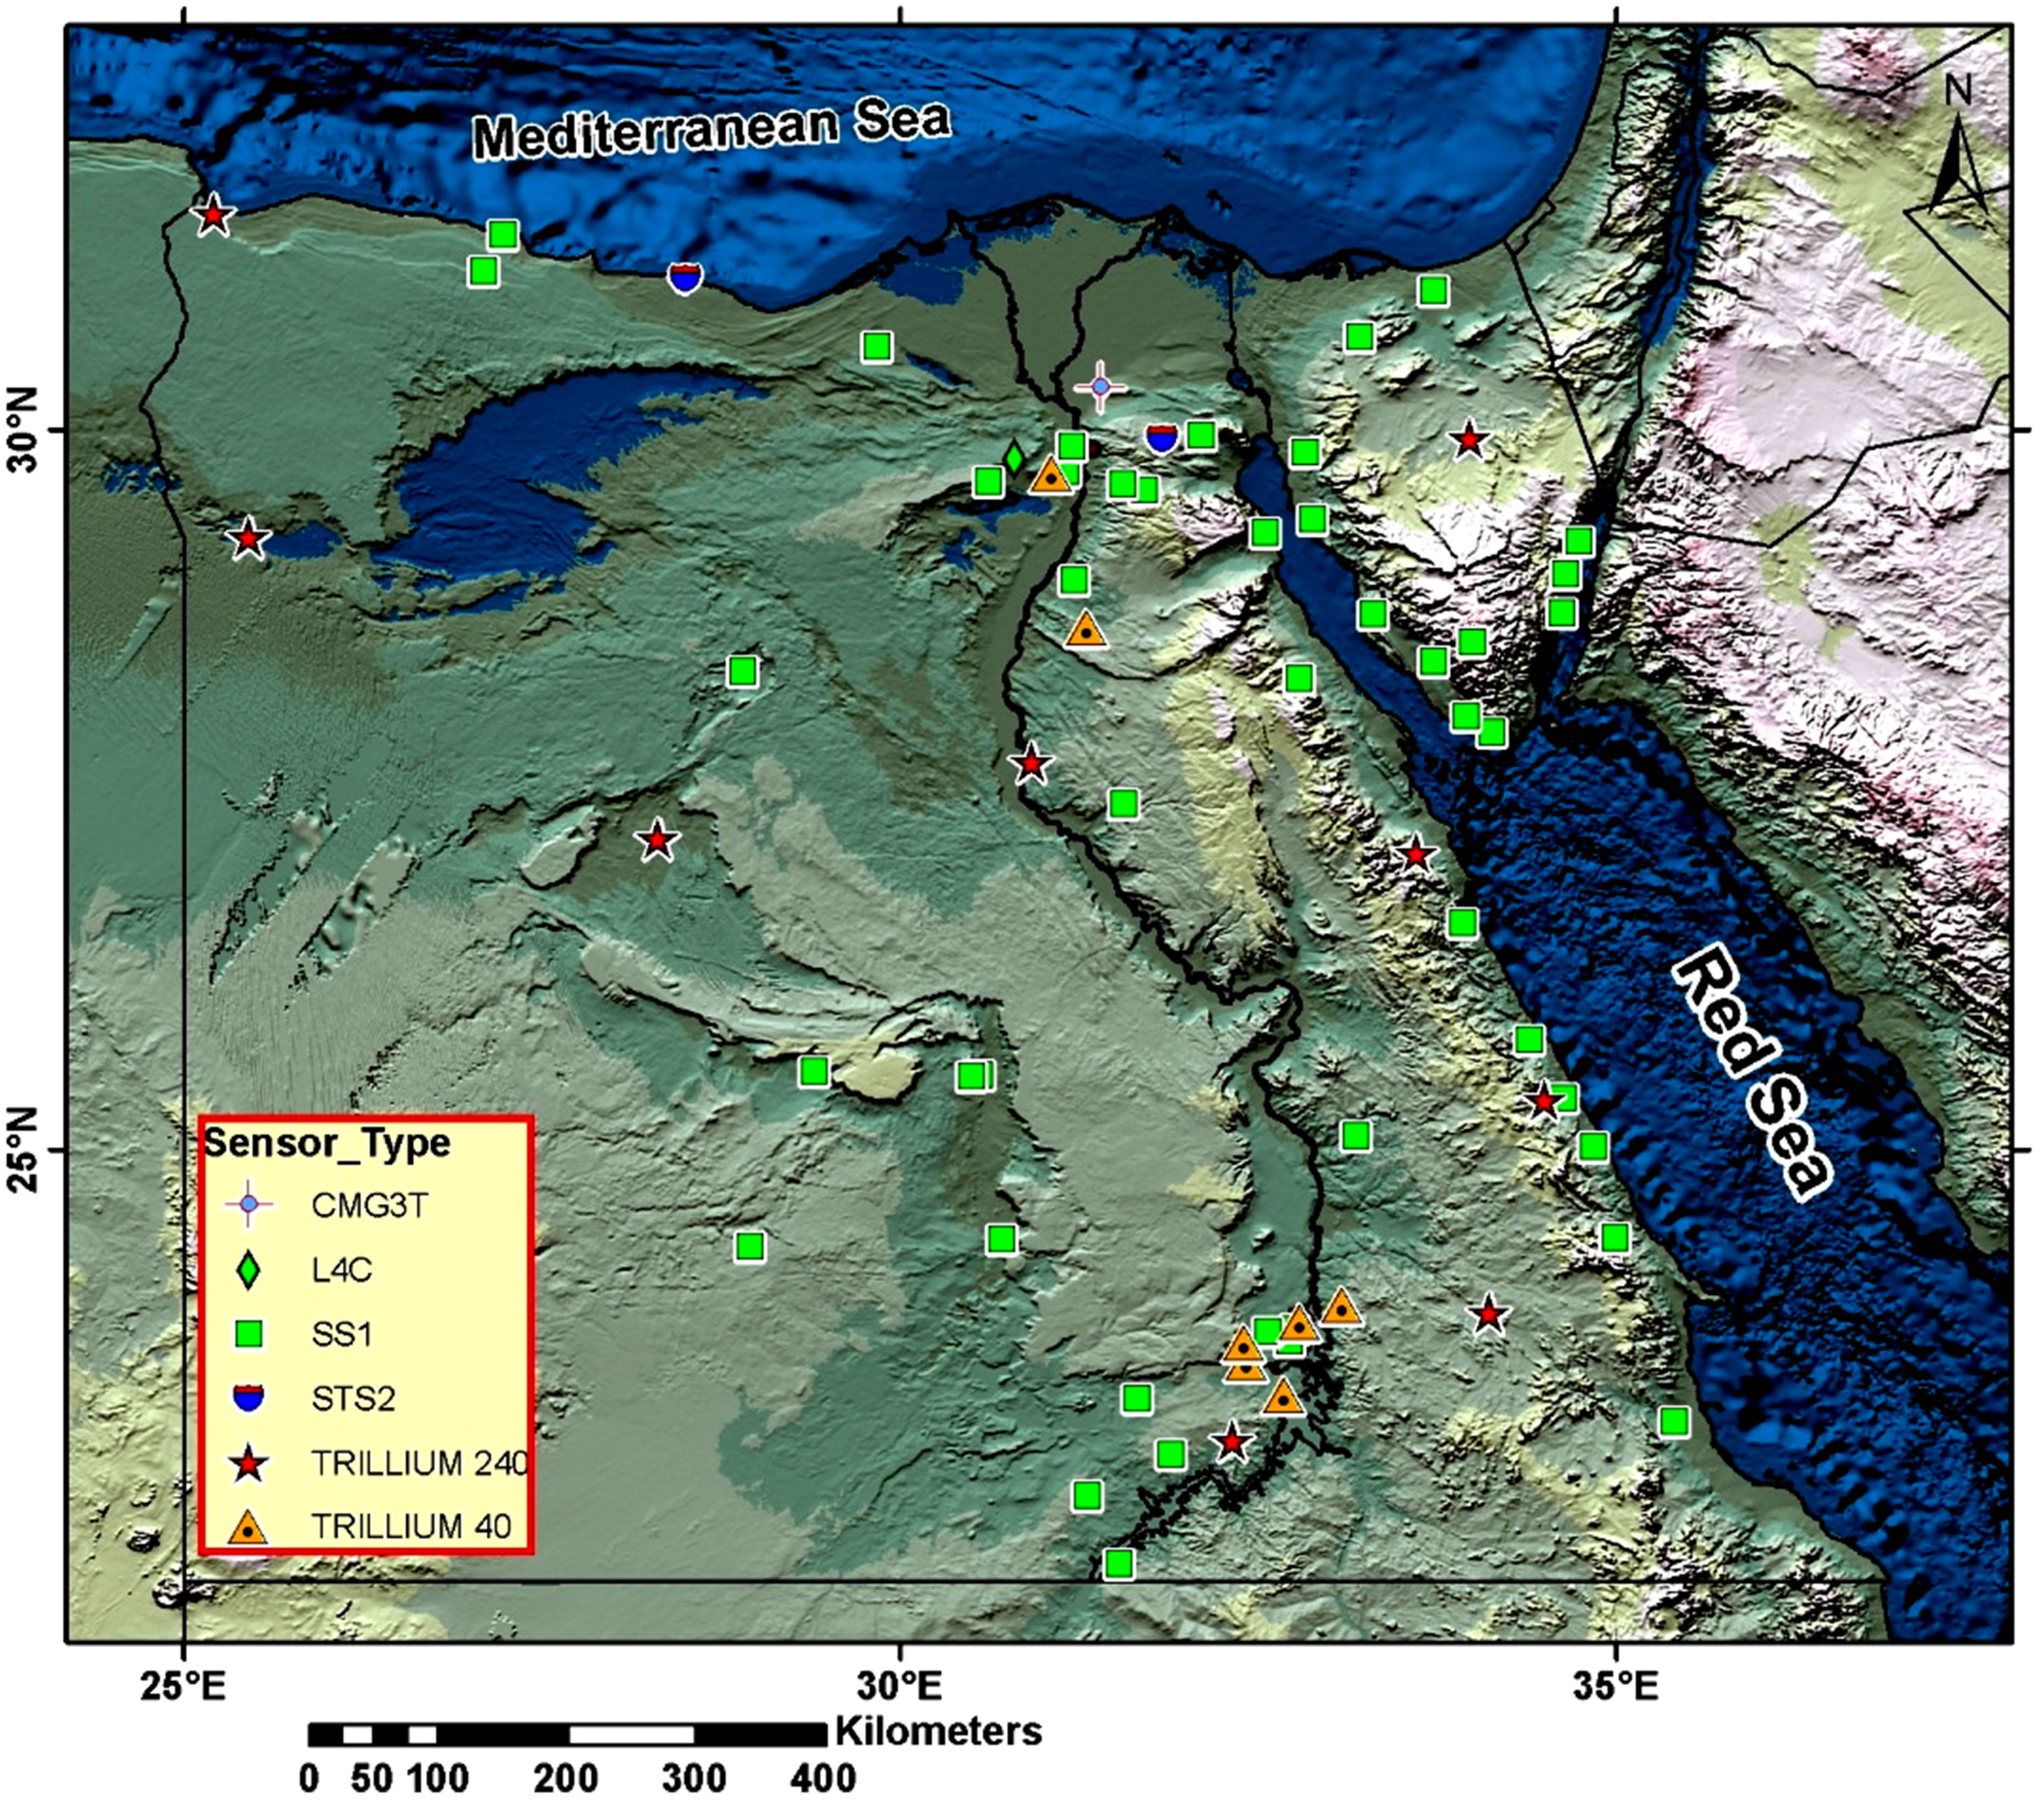
Figure 4. Distribution map of Egyptian National seismic network. L4C is short period station, SS1 is short period station, STS2 is very broadband station, TRILIUM 240 very broadband station, TRILIUM 40 is broadband station.
receiver are assumed to be placed at one point (for coincident).
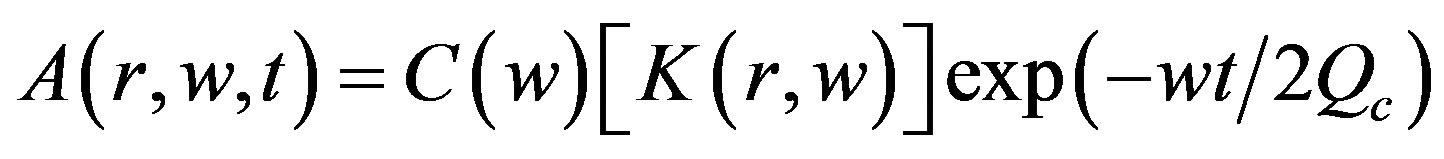
According to [5,6,17], the time dependence of root mean square coda wave amplitude,  , on a bandpass-filtered seismogram can be written as:
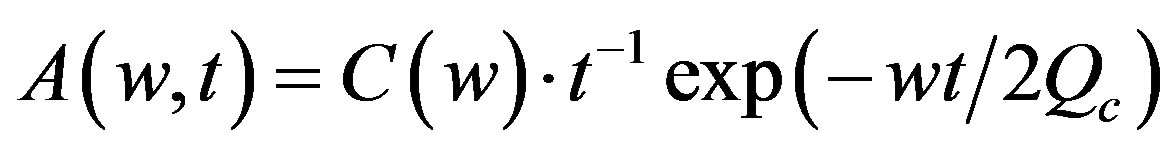 . (1)
. (1)
where Qc is the attenuation quality factor as a function of frequency,  is a correction factor for the geometrical spreading, and
  takes into account these terms of source and site amplification. This model is believed to be more appropriate for small local earthquake than multiple—scattering model [32].
[17] developed the model where root mean square
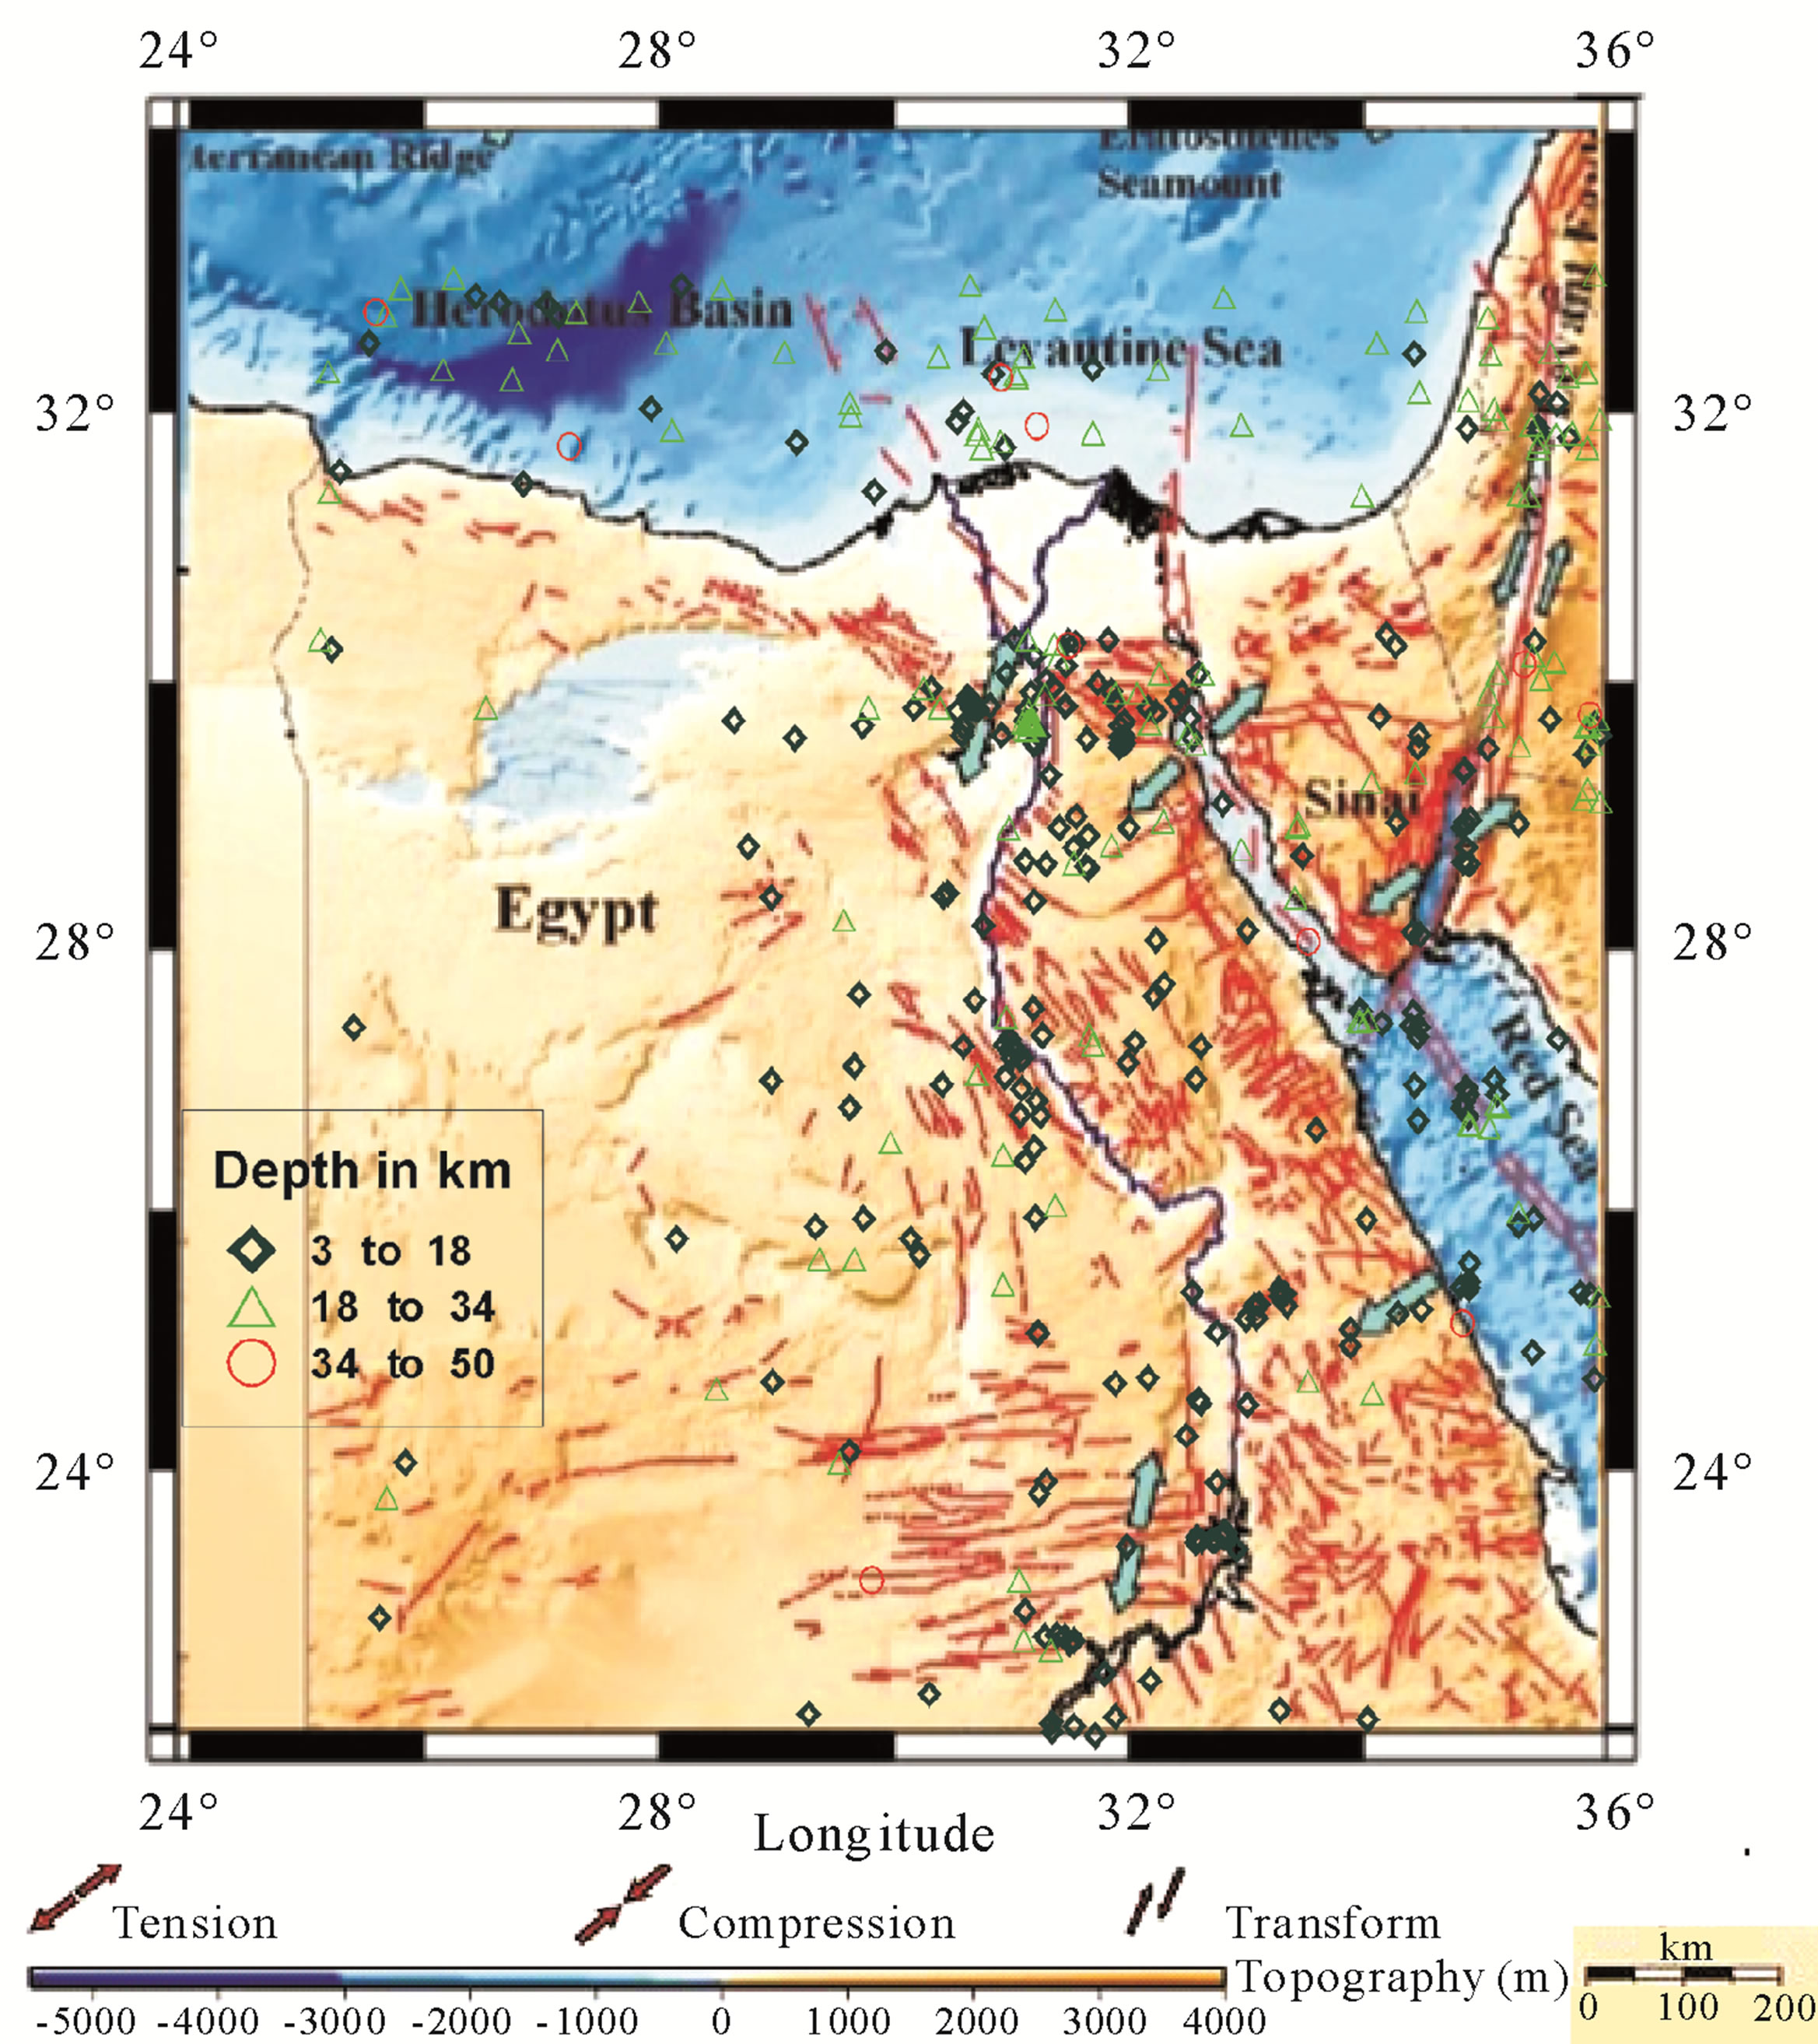
Figure 5. Spatial distribution map of the earthquakes used in this study.
coda wave amplitude at lapse time t may be written as:
 . (2)
. (2)
where,  (ts is the travel time of S wave) and r is station-source distance; K(r, x) is a function of x and r, defined as:
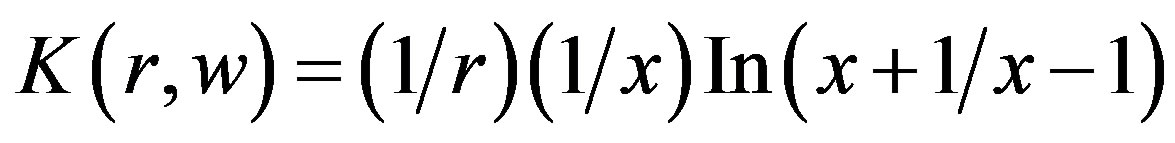 (3)
(3)
By taking the natural logarithms of Eq.2 and re-aranging terms, we obtain the following equation:
 (4)
(4)
For narrow bandpass-filtered seismograms,  is constant. Therefore, by using a linear regression of terms on the left side of Eq.4 vs t, Qc can be determined from the slope of the fit, which is equal to
 . The base line correction is done to all traces and the band pass filtered over the central frequencies 1.5, 3, 6, 9, 12, 15, 18 and 24 Hz is applied. For each frequency band, the amplitude to noise window of 10 s before the P-wave arrival is also computed. Then, Qc was estimated for each epicenter-station path by means of a least-squares regression using a 10, 20, 30, 40 and 50 s time windows on the linear part of
 .
.
4.2. Regionalization: A 3D Approach
Following [12], one way to regionalize for Qc is based on the work of [18] who, expanding on the work of [5,6], realized that the first order scatterers responsible for the generation of coda waves at a given lapse time are located on the surface of an ellipsoid having earthquake and station locations as foci. According to [33], in the ellipsoidal volume sampled by coda waves at a time t, the large semi-axis is defined as and the small semi-axis as
 where r is the source-receiver distance of the ellipsoid. We have confirmed the volume sampled by coda waves in the case of single isotropic scattering, simulating numerically the movement of many particles, which represents the propagation of S-wave energy, using a Monte Carlo method. The basic assumptions for the numerical simulation are: 1) the scattering is isotropic; 2) scattered waves are incoherent and point-like scatterers are randomly distributed with a uniform density; 3) a short duration point-like source radiates S waves spherically; 4) there are no conversions between P and S waves, which travel with a constant S wave velocity. The assumptions and procedure are described in [6]. Figure 6" target="_self"> Figure 6 shows the simula-
 (a)
(a)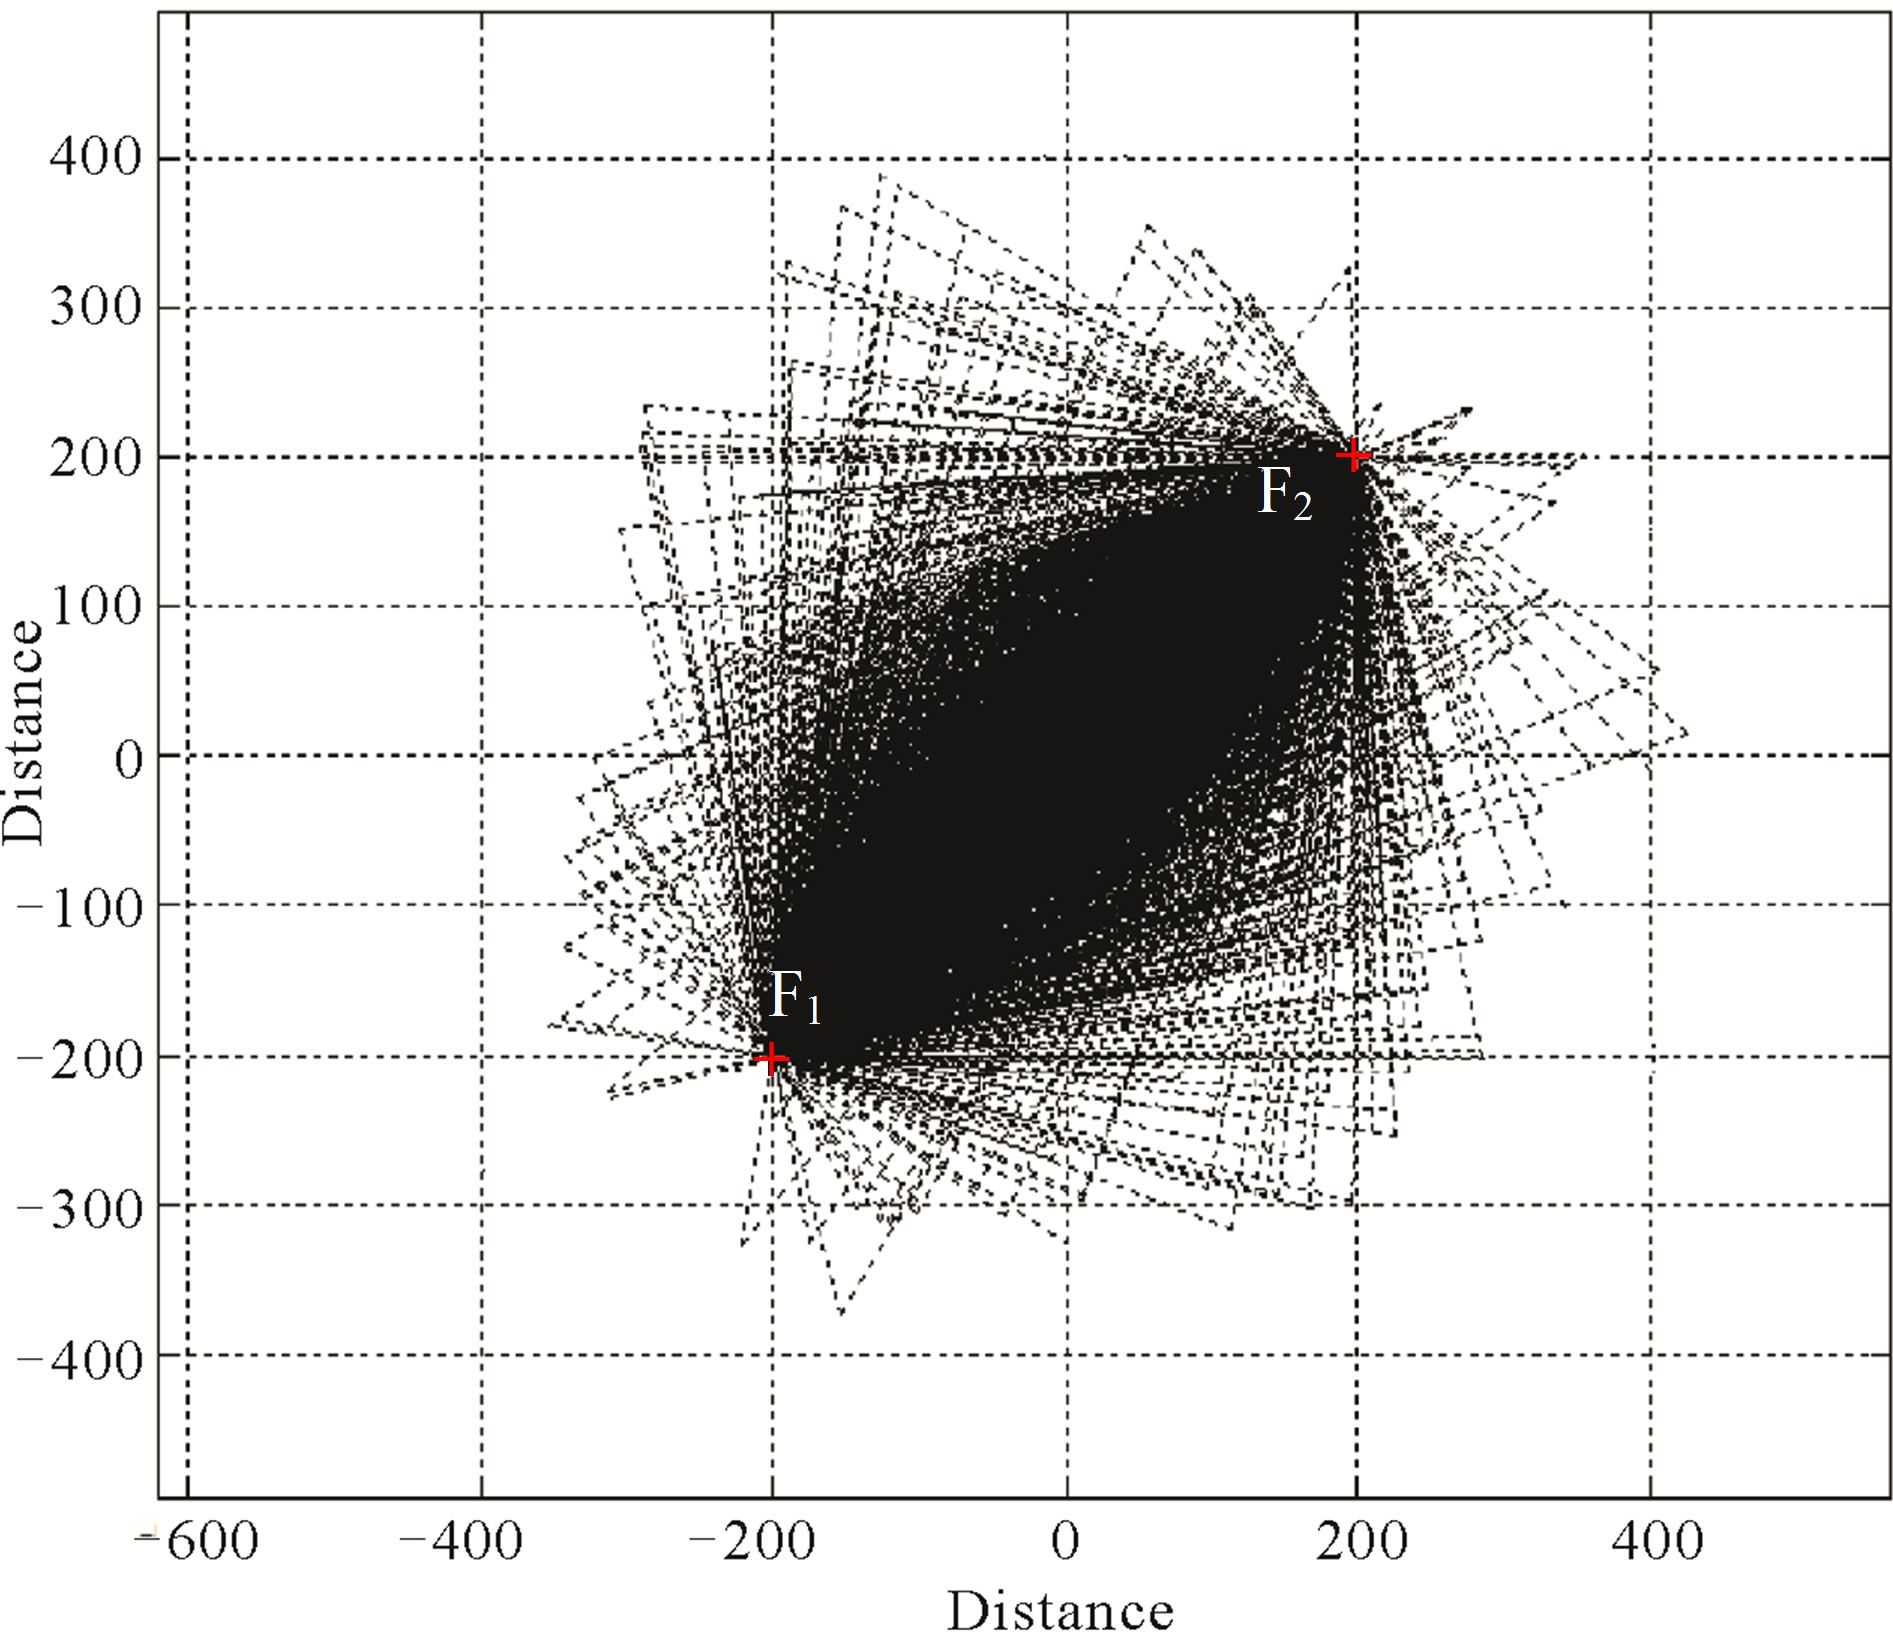 (b)
(b)
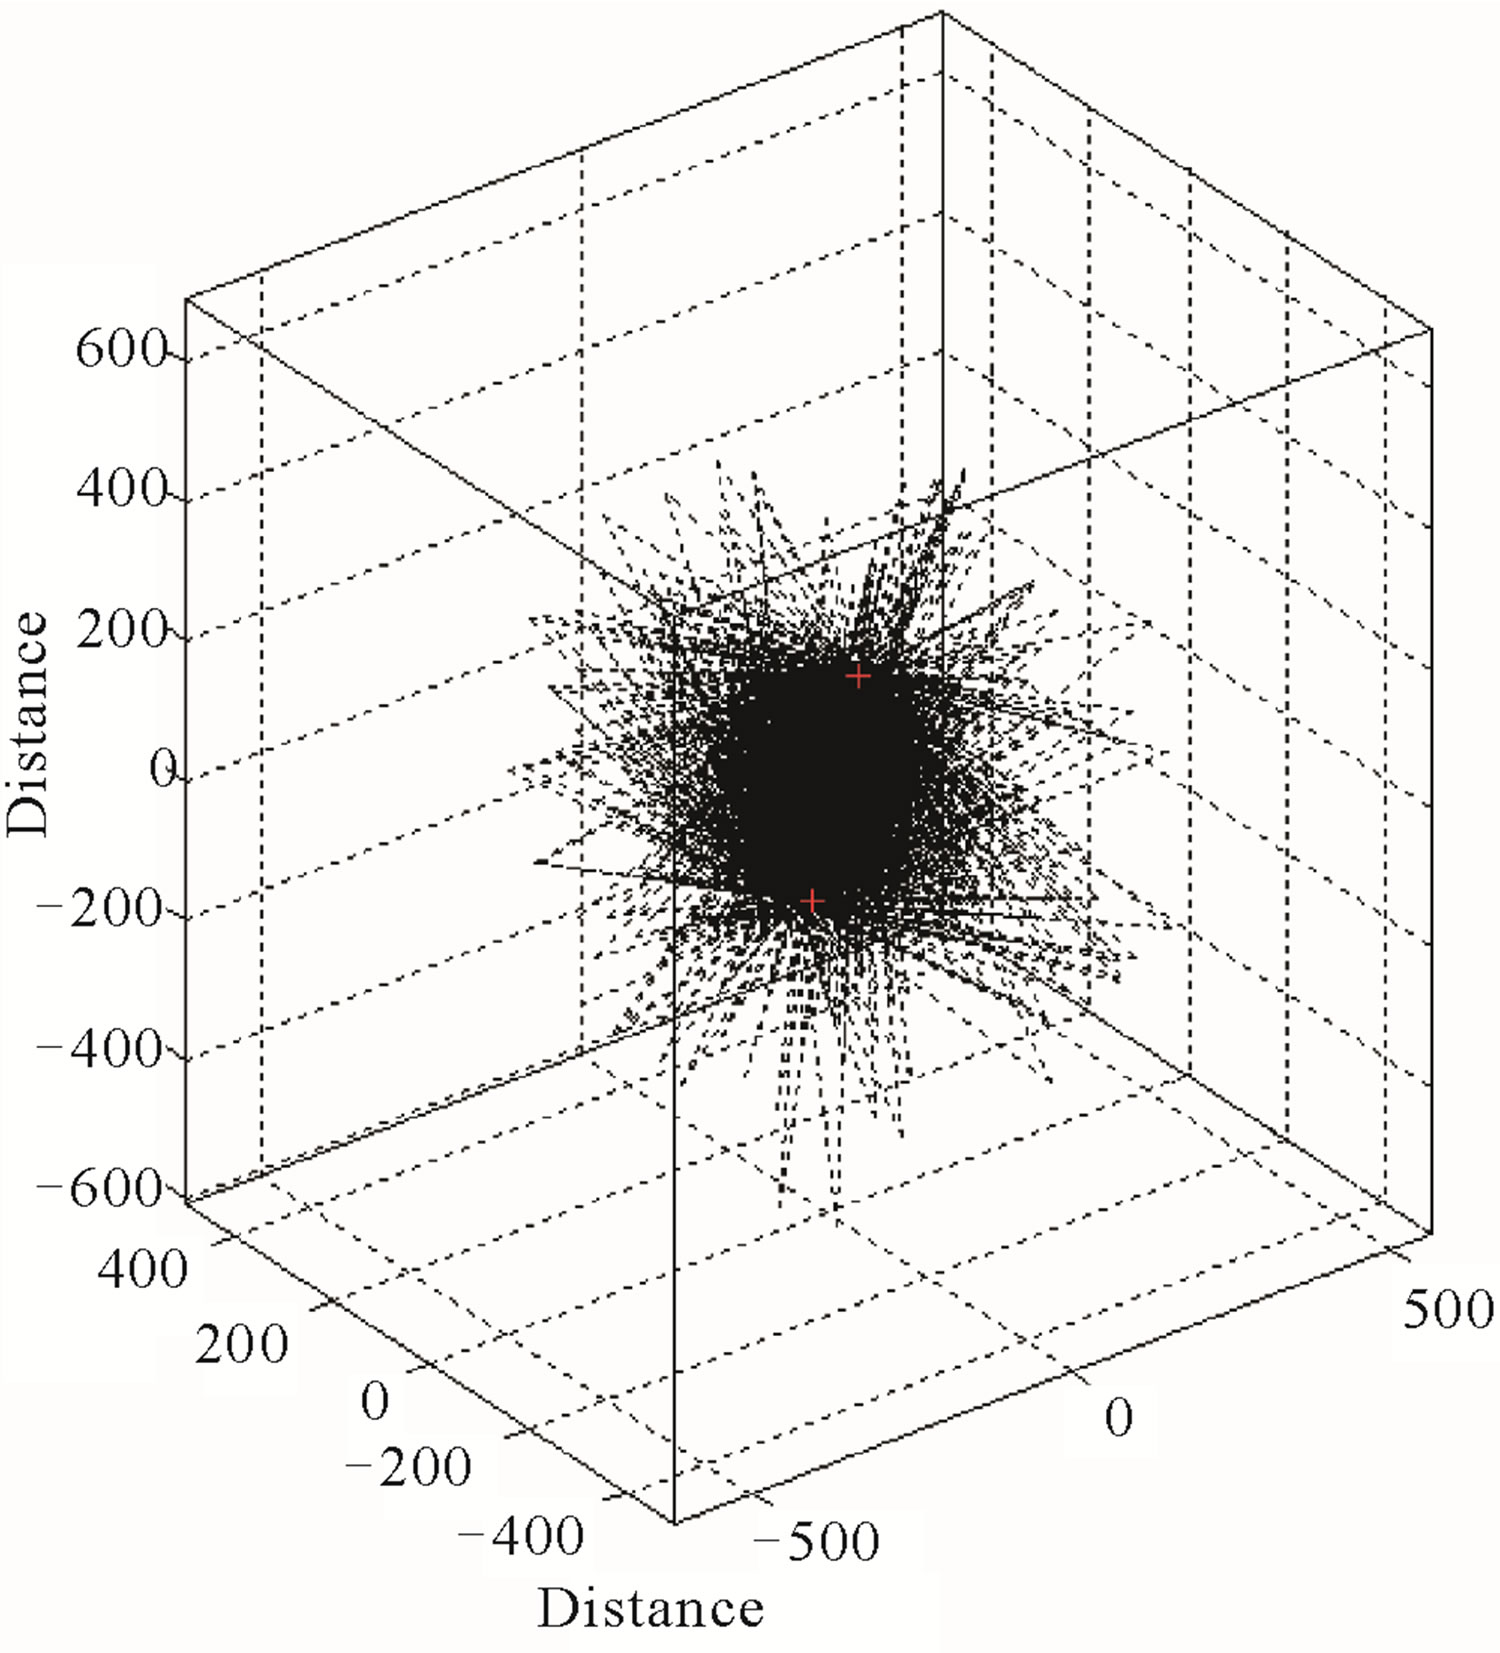
Figure 6. Monte Carlo simulation of the volume sampled in the scattering process in the case of single scattering. For the simulation, an arbitrary coordinate system centred at (0, 0, 0) km was chosen, with a hypocenter (F1) located at (–200, –200, 0) km and one station (F2) at (200, 200, 0) km. A lapse time of 100 s and a velocity of 3.5 km/s were considered. (a) Horizontal projection of the Monte Carlo simulation; (b) 3D perspective of the Monte Carlo simulation.
tion test for the case of single scattering. It can be observed that, in the first order scattering the sampled volume in the attenuation process is closer to the segment defined by the hypocentre-station path that delineate an ellipsoid with foci hypocentre (F1) and station (F2). Consequently, we have assumed that the average sampled volume can be represented by tav = tstart + Δtwin/2, where tav is the average lapse time for the first order scattering, tstart is the starting lapse time, and Δtwin is the window length. Then, by knowing the volumes of the ellipsoids as a function of time, a generalized inversion for regional Qc canbe performed.
For the purpose of inversion, we define a geographic grid around the seismic station that also encloses the hypocenter. Then, we recognize that each measured Qc is an average estimate Qav (or Qapparent) for the volume sampled by the ellipsoid given by:
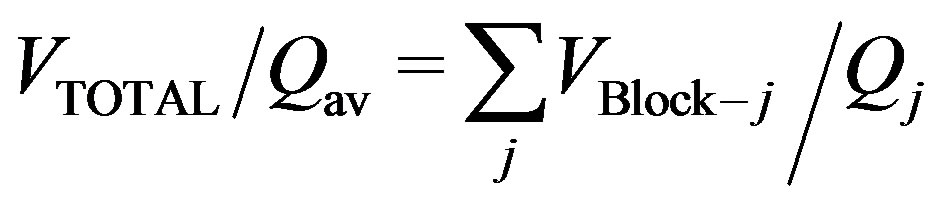 (5)
(5)
where VBlock–j is the fraction of volume (block) in an ellipsoidal region with the true attenuation coefficient Qj (or Qtrue). Assuming a constant velocity of propagation, the volume travelled by a ray that leaves the hypocenter, moves out to the ellipsoid defined by the observation time of the coda, and is scattered to the receiver, can be determined. Eq.5 can be written as:
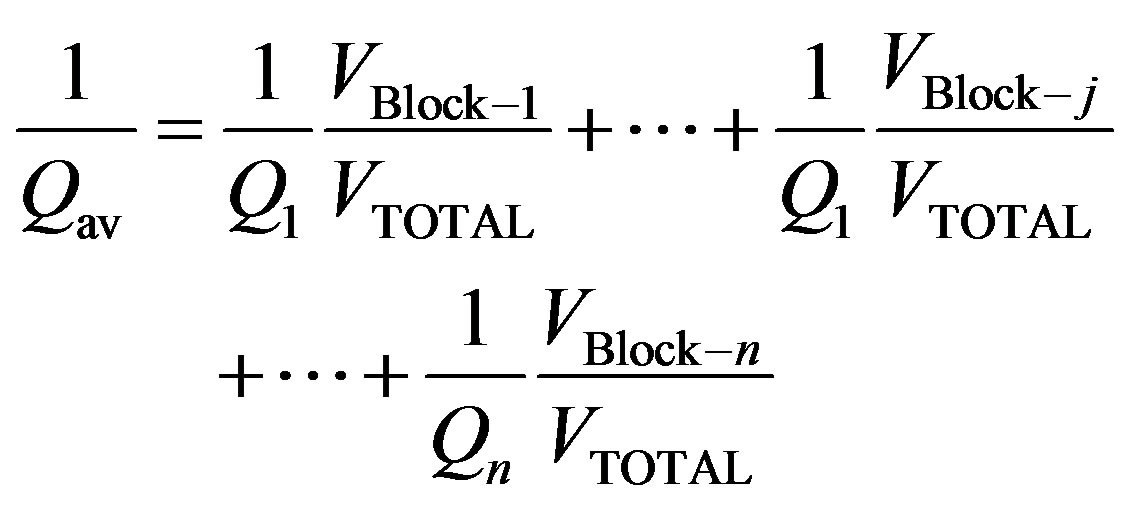 (6)
(6)
where, the ratio VBlock–j/VTOTAL is just the volume fraction associated to the total scattered wave travel path spent in the j-th block.
If the process is repeated for each station-hypocenter pair, the entire region is sampled. Eq.6 is of the form
 (7)
(7)
where ,
,  ,
, .
.
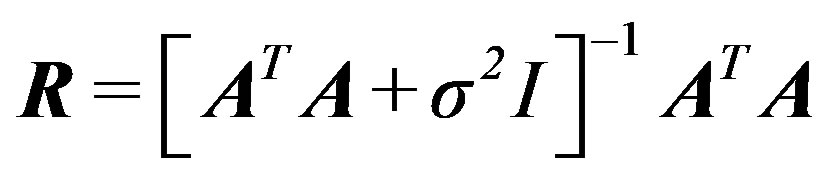
Then, a least squares estimate of the xi is given by the compact matrix equation
 (8)
(8)
where A is a (k × n) coefficient matrix, X is a (n × 1) vector, Y is a (k × 1) vector and k is the number of station-hypocentre pairs. A solution of Eq.8 is estimated using the damped least square technique of [34]. According to this technique the solution and resolution matrices can be found with next equations
 (9)
(9)
 (10)
(10)
The method described above was used for the regionalization of Qc in several synthetic tests and in the area of interest.
4.3. Synthetic Tests
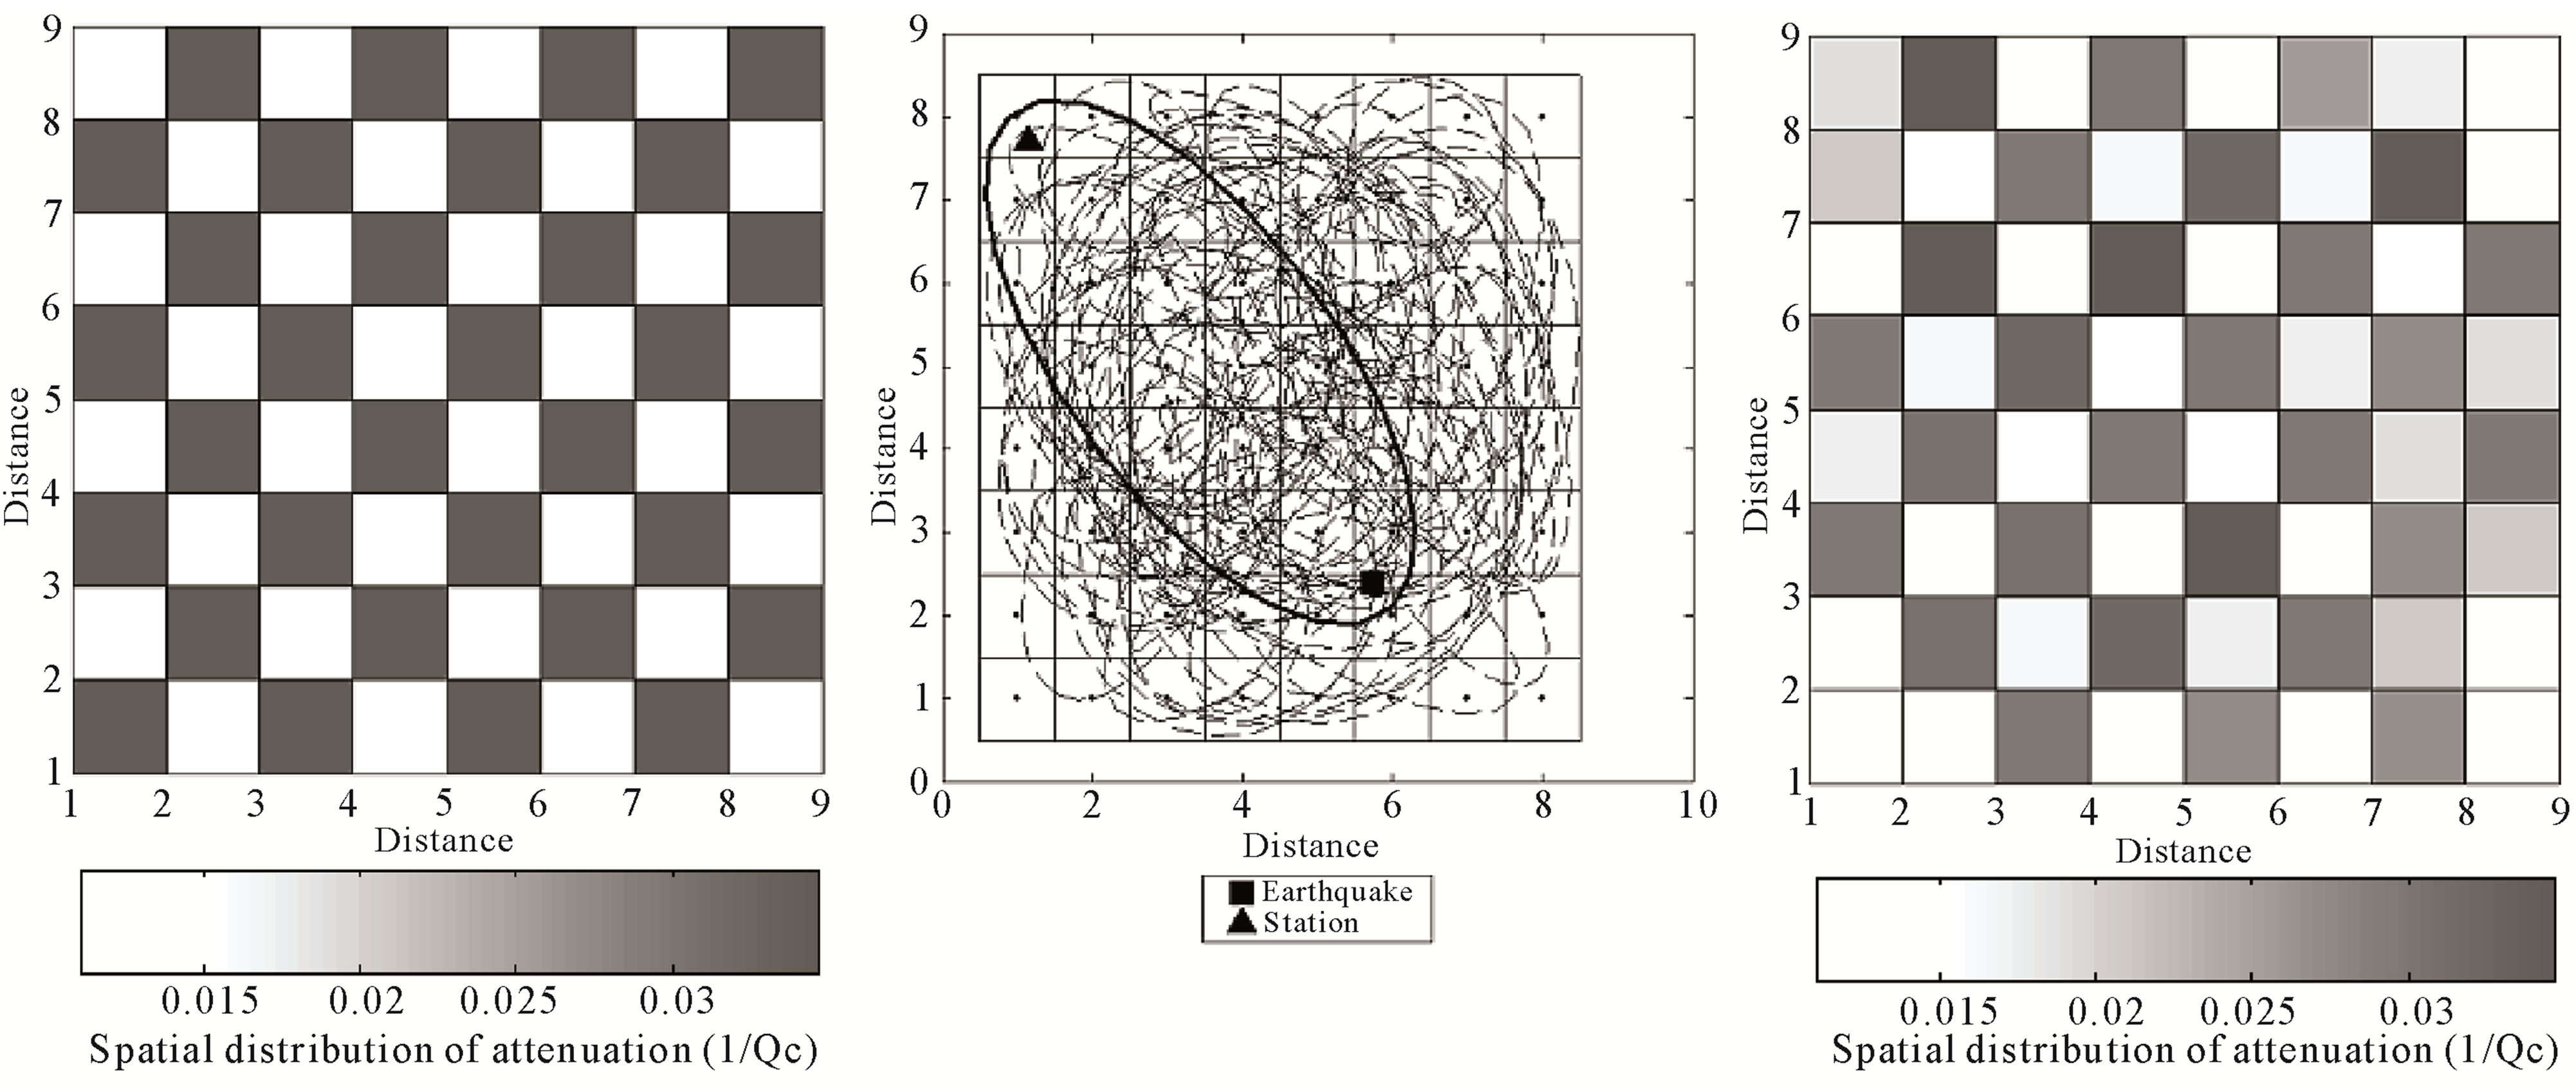
We have done several tests to evaluate the efficiency of this procedure. First we solved the problem in 2D for a distribution of regular attenuation anomalies in an area where many station-epicenter pairs were well dispersed. Figure 7" target="_self"> Figure 7(a) shows a chessboard test of 8 × 8 cells with two Qc values (Qc = 30 and Qc = 90). On this attenuation distribution 500 random ellipses were calculated, that allowed sampling the model mainly in the central zone (Figure 7(b)). Then we calculated elliptical areas and their Qav (pondered by the distribution attenuation areas) associated with every hypothetical station-epicenter pair. The area fractions in a grid of regular cells permitted building an equation system as:
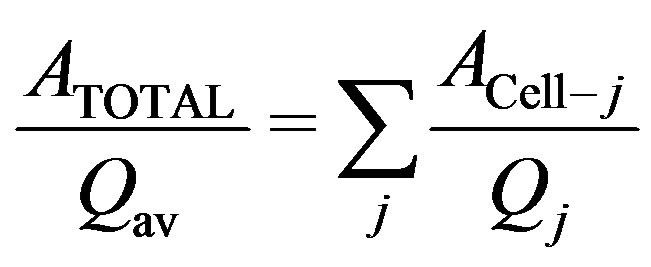 (11)
(11)
Figures 7(c)-(e) represent respectively the inverted model, the number of Ellipses per Cell (EPC) and the resolution diagonal elements matrix (RDE) of Equation 10. In cells covered with enough ellipses the solution is reliable and true attenuation values (1/Qc) were well restored.
However, we wished to know how is the behavior of available data (earthquakes and stations) to determine the presence of attenuation anomalies. A new test was
 (a)
(a)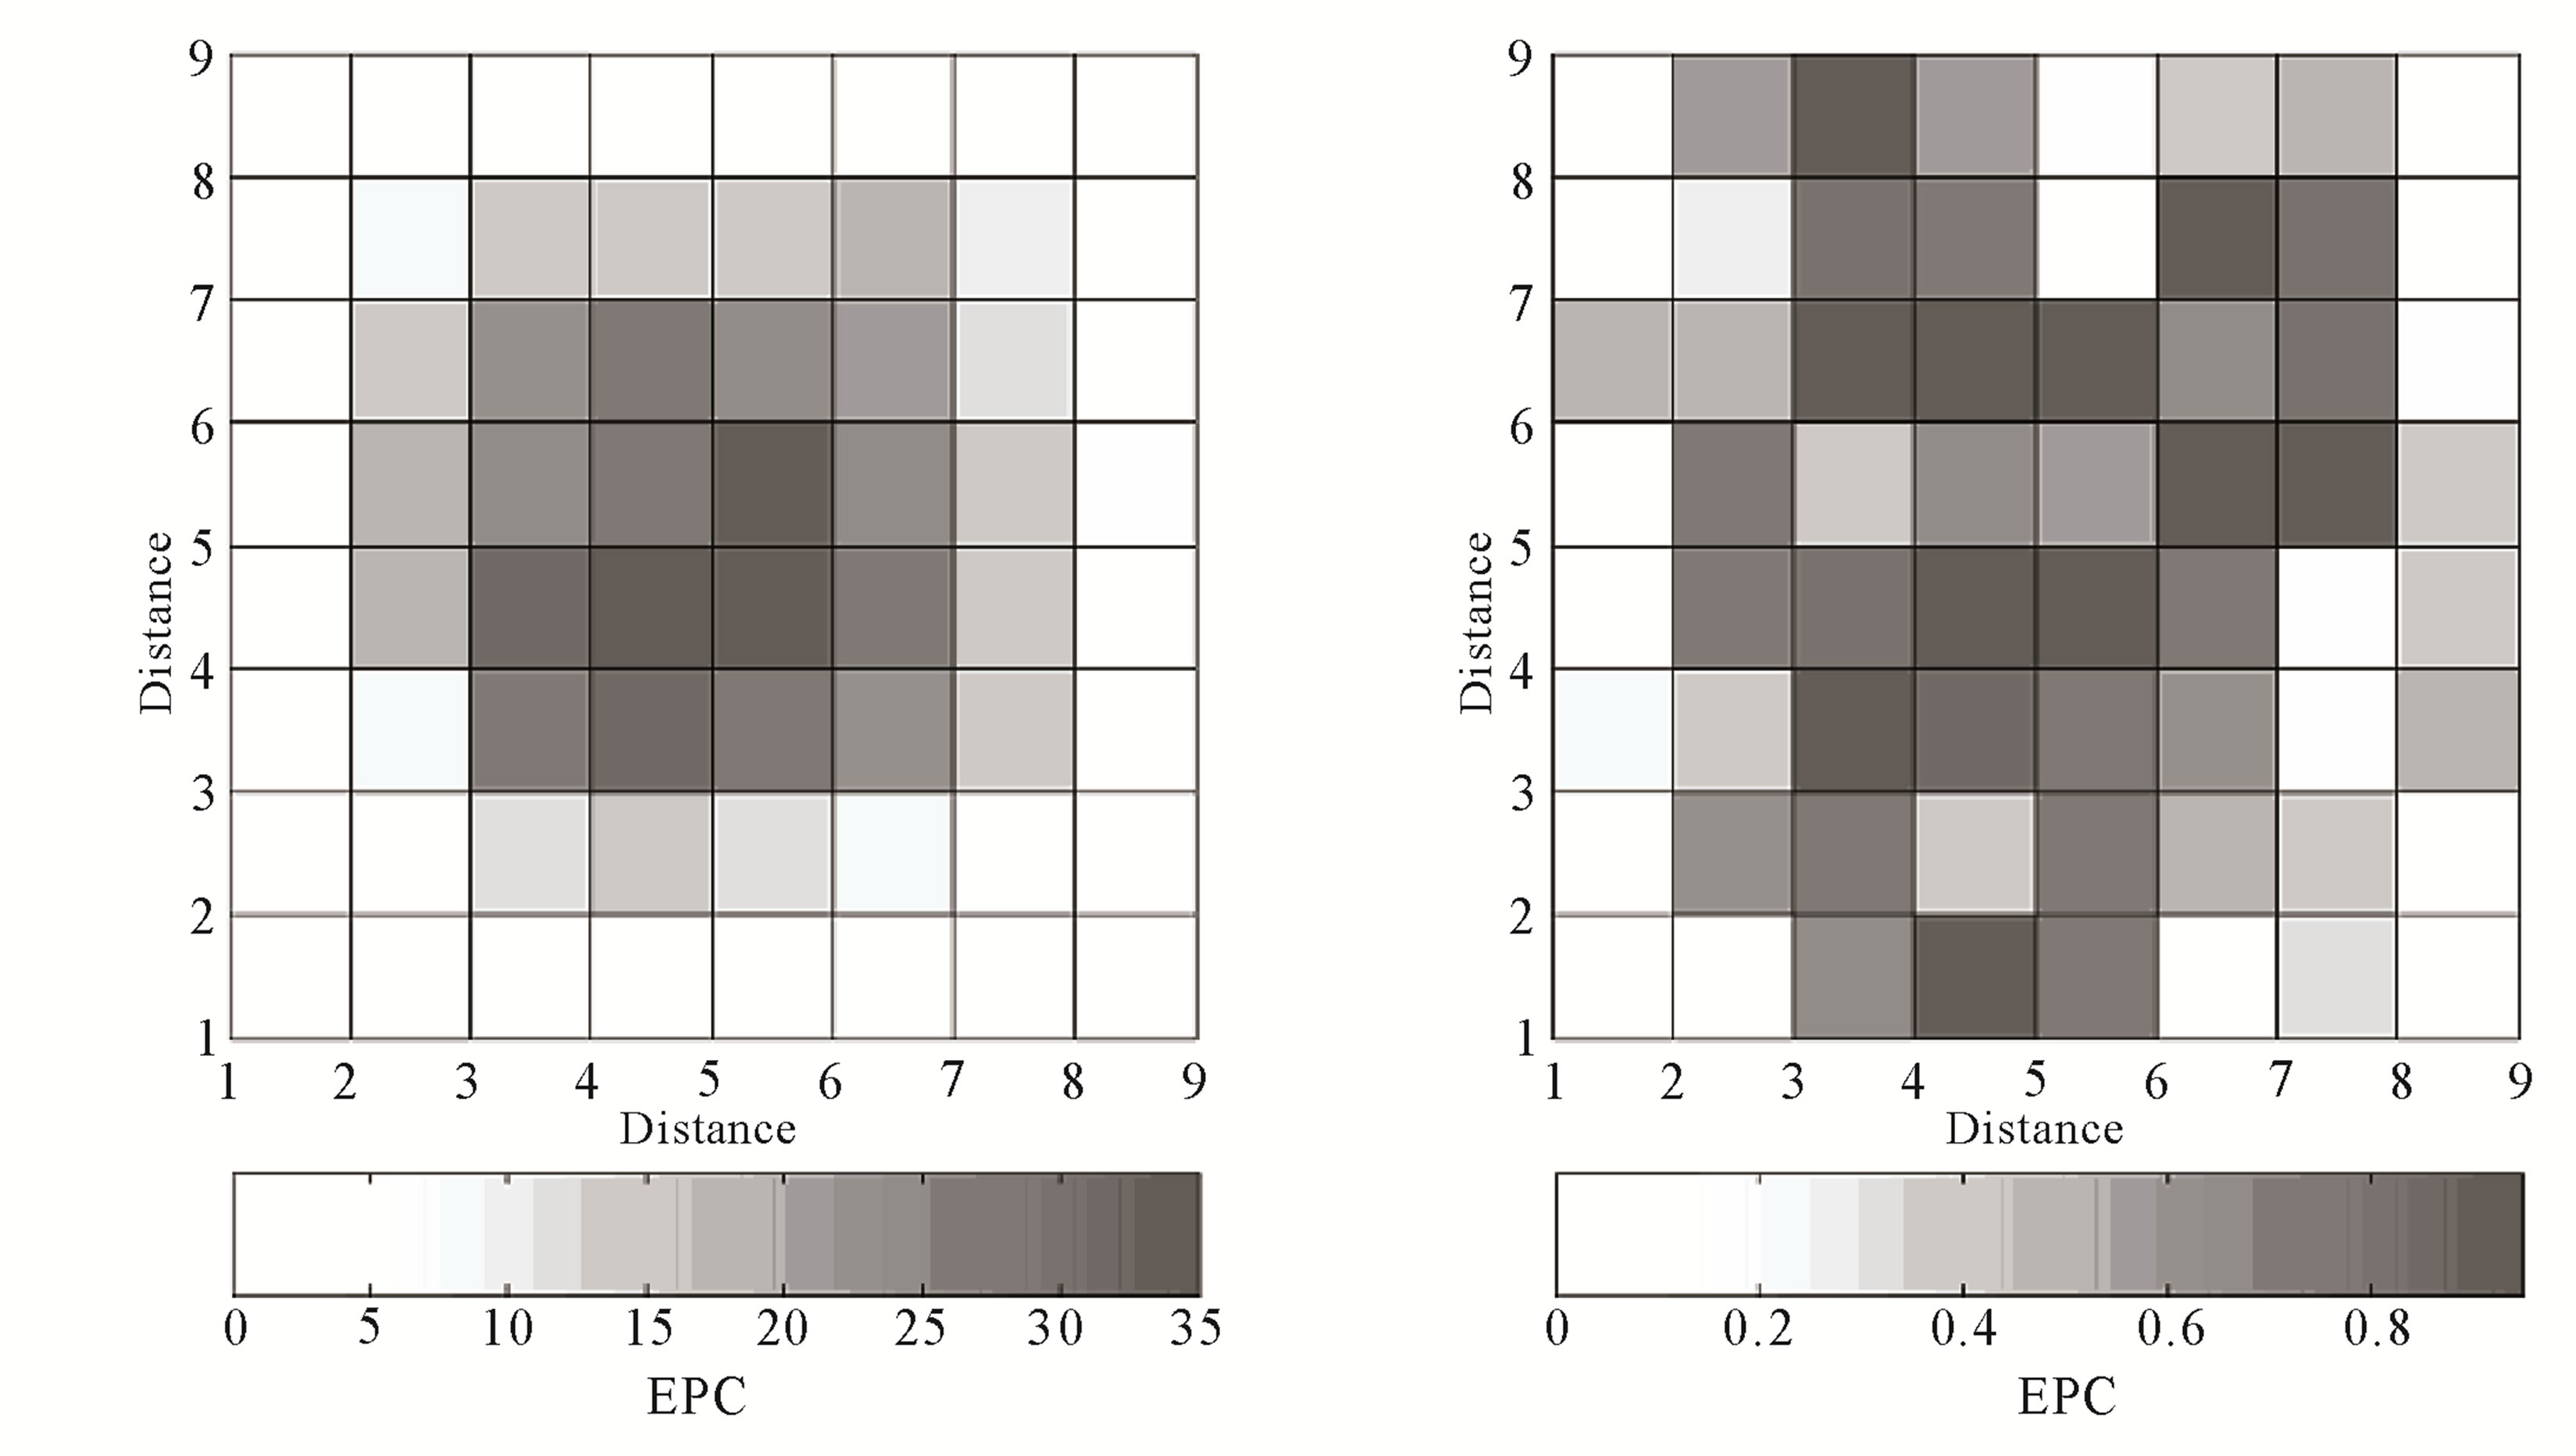 (b)
(b)
Figure 7. Synthetic test in a chessboard of 8 × 8 nodes. (a) Original attenuation distribution associated to two different values; (b) Random ellipses with variable foci distances; (c) Inversion of attenuation; (d) Frequency of sampled cells (EPC); (e) Distribution of RDE.
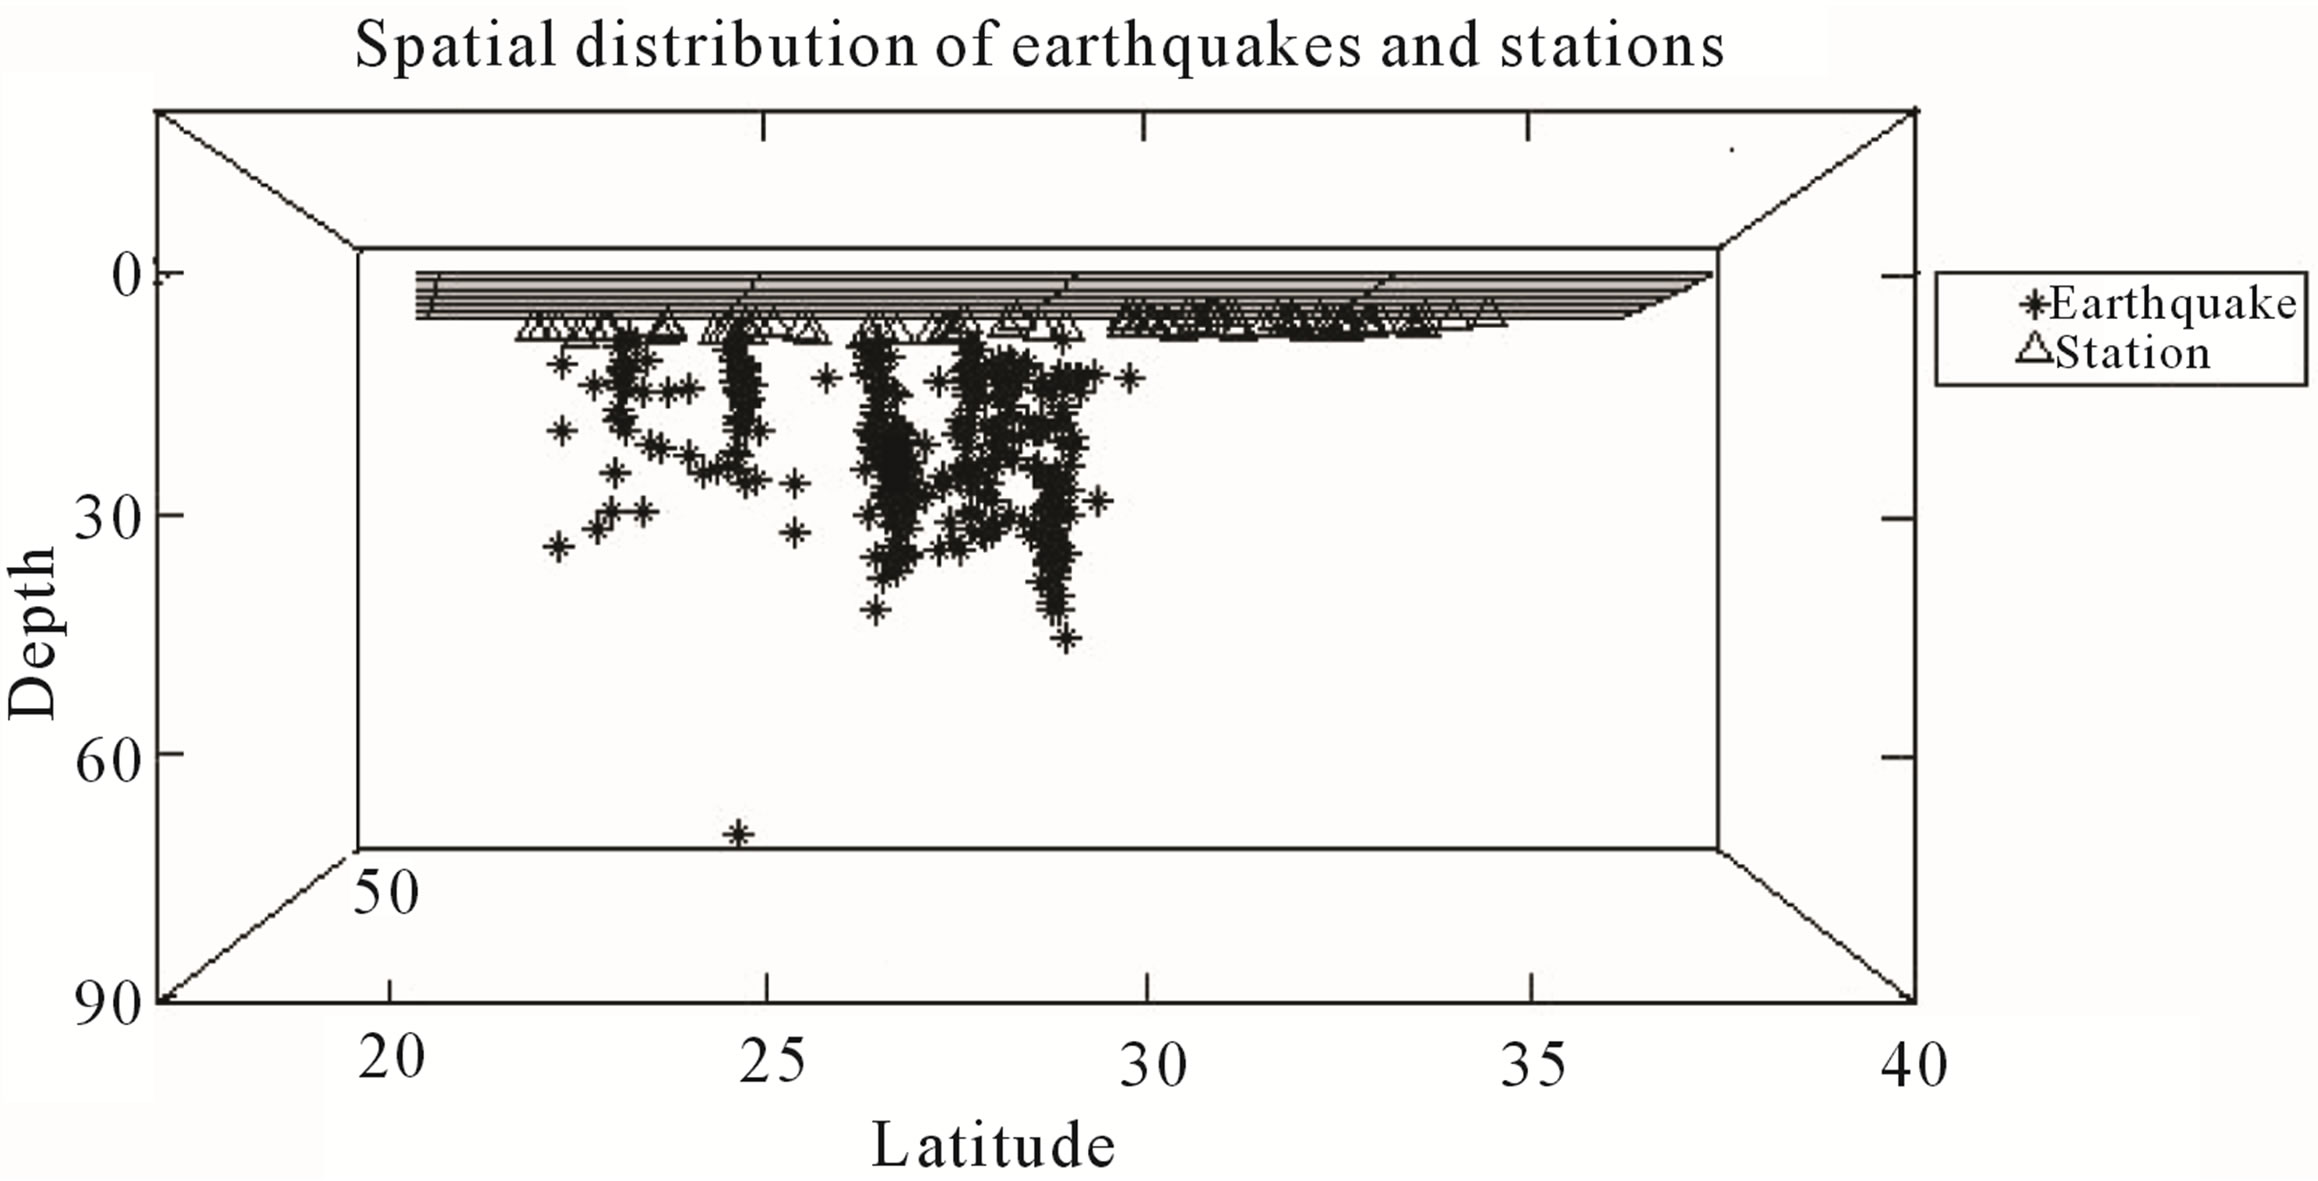
considered in order to evaluate the inversion performance with the same structure used in last test with all station-earthquake couples related with the available data. Figure 8(a) shows distribution of stations and earthquakes located mainly between 0.0 and 50.0 km depth. Figures 8(b)-(d) show the distribution of sampling ellipsoids in the study area. This distribution of foci allowed us to have sampled volumes that cover almost all Egypt of the study area in the latitude range between 22.00˚N and 35.00˚N; longitude range between 25.000˚E and 36.000˚E, and depth range located between 0.0 and 50.0 km approximately. The distribution of RDE values shows that in the marginal areas the results would not bereliable.
 (a)
(a)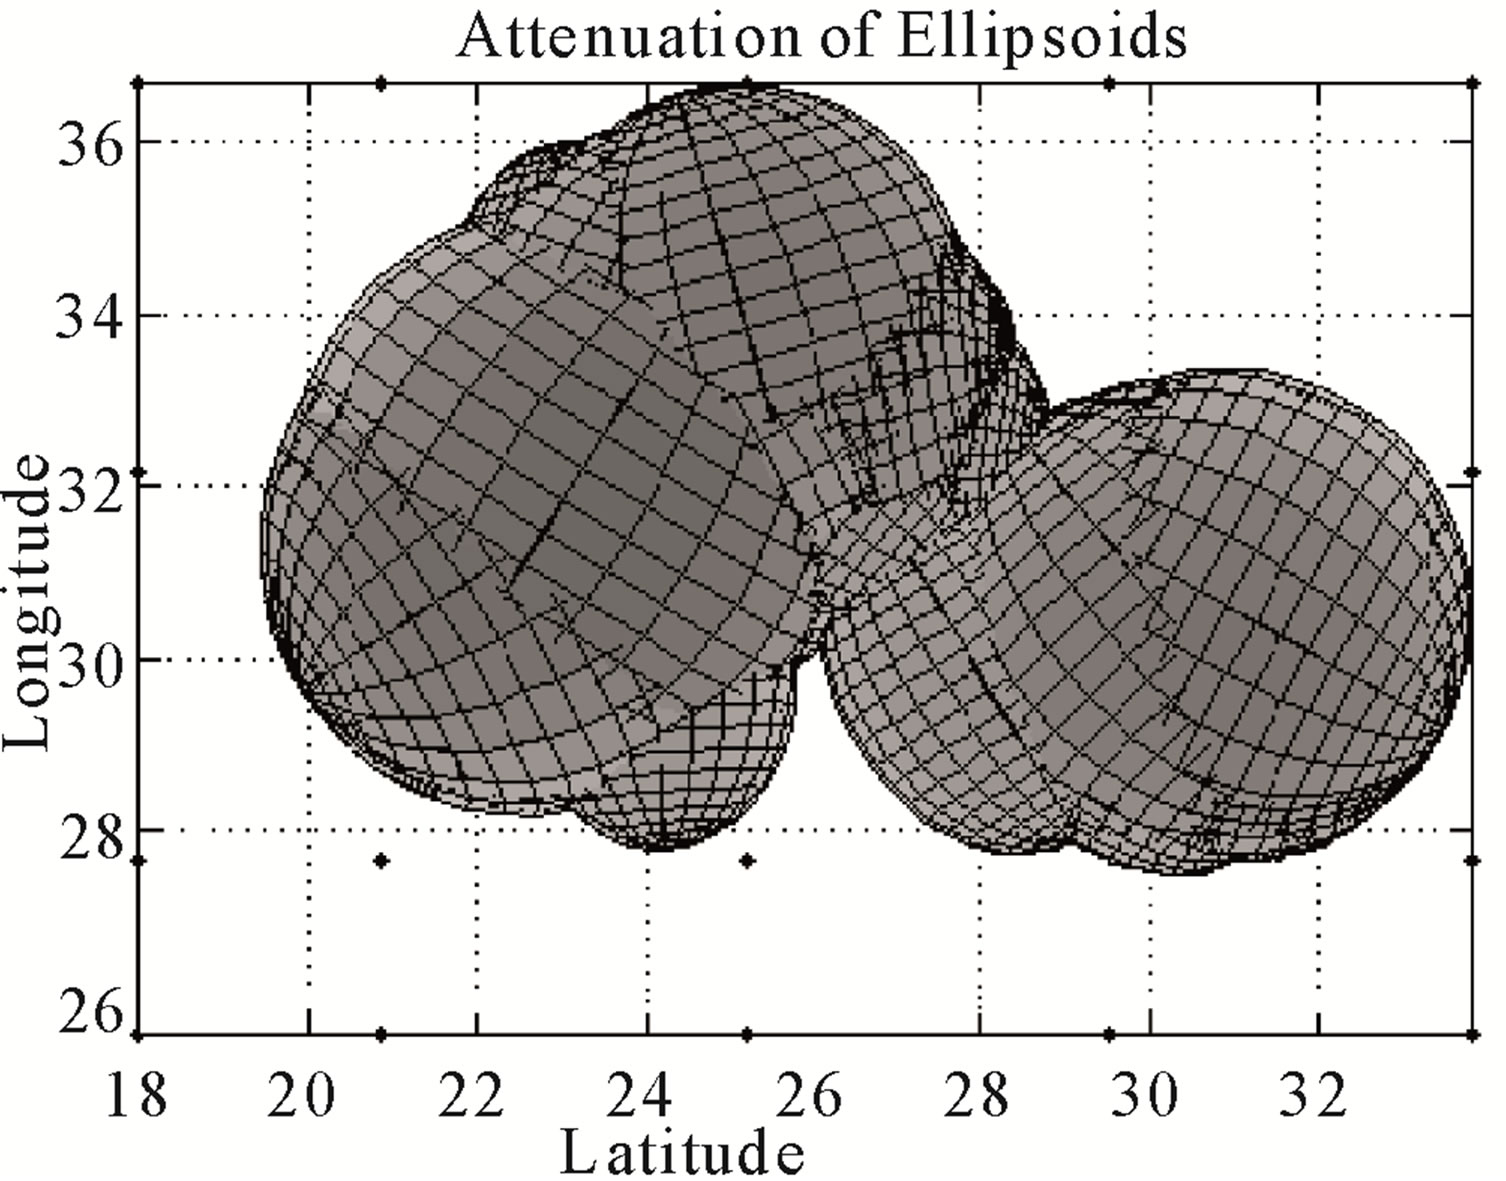 (b)
(b)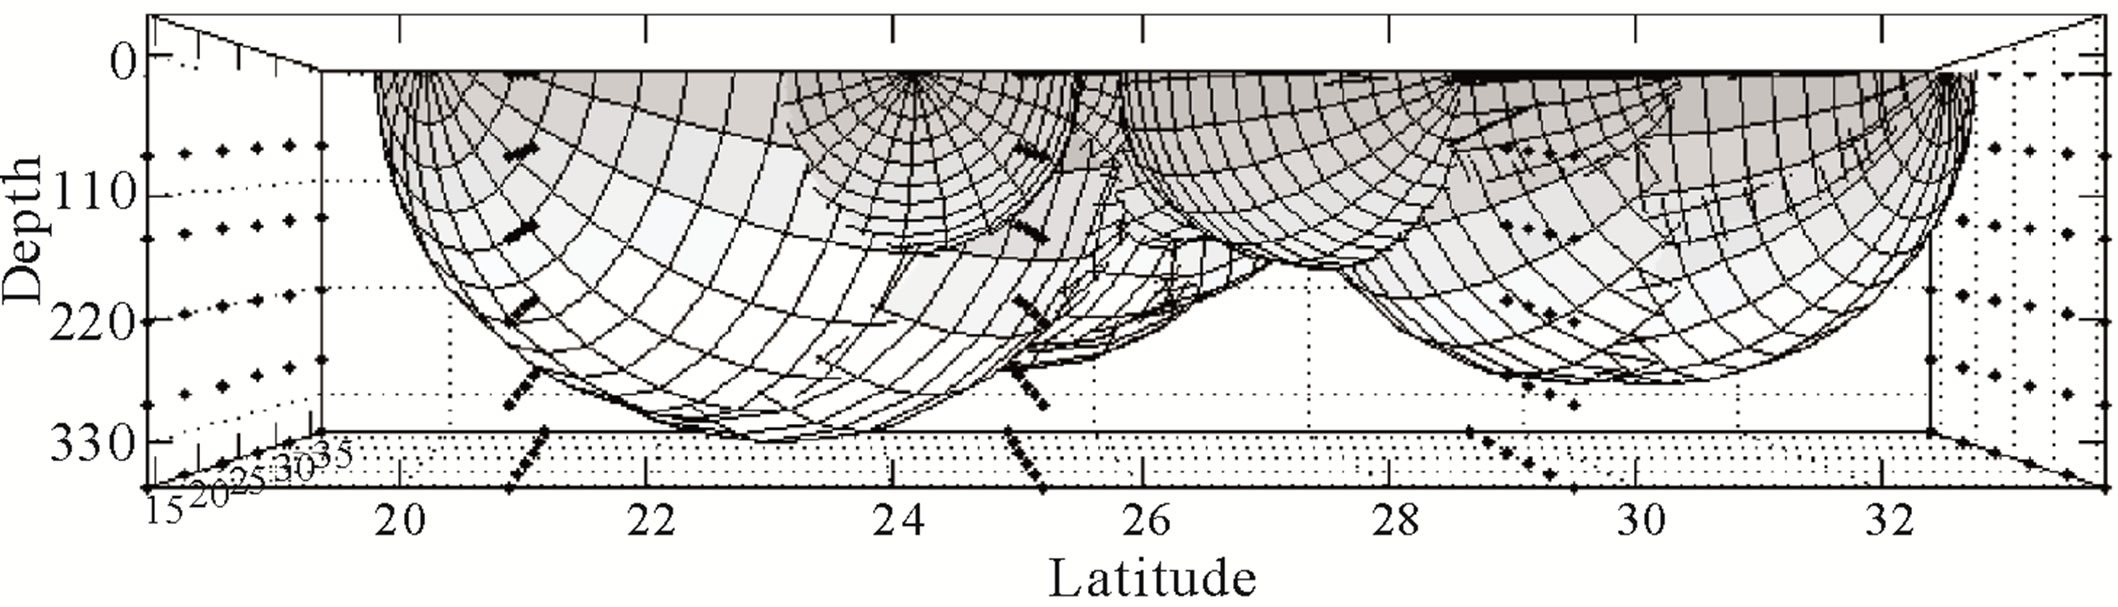 (c)
(c)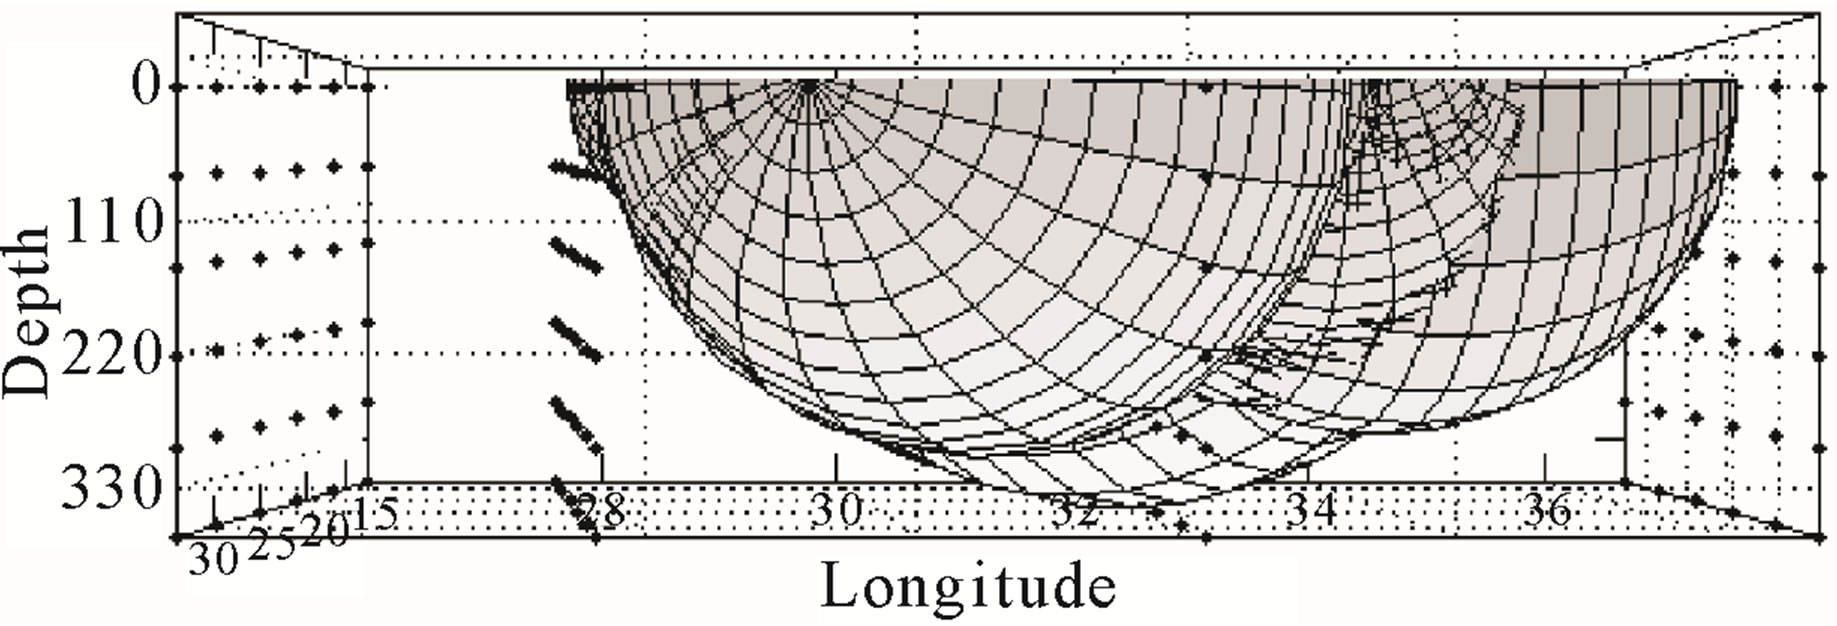 (d)
(d)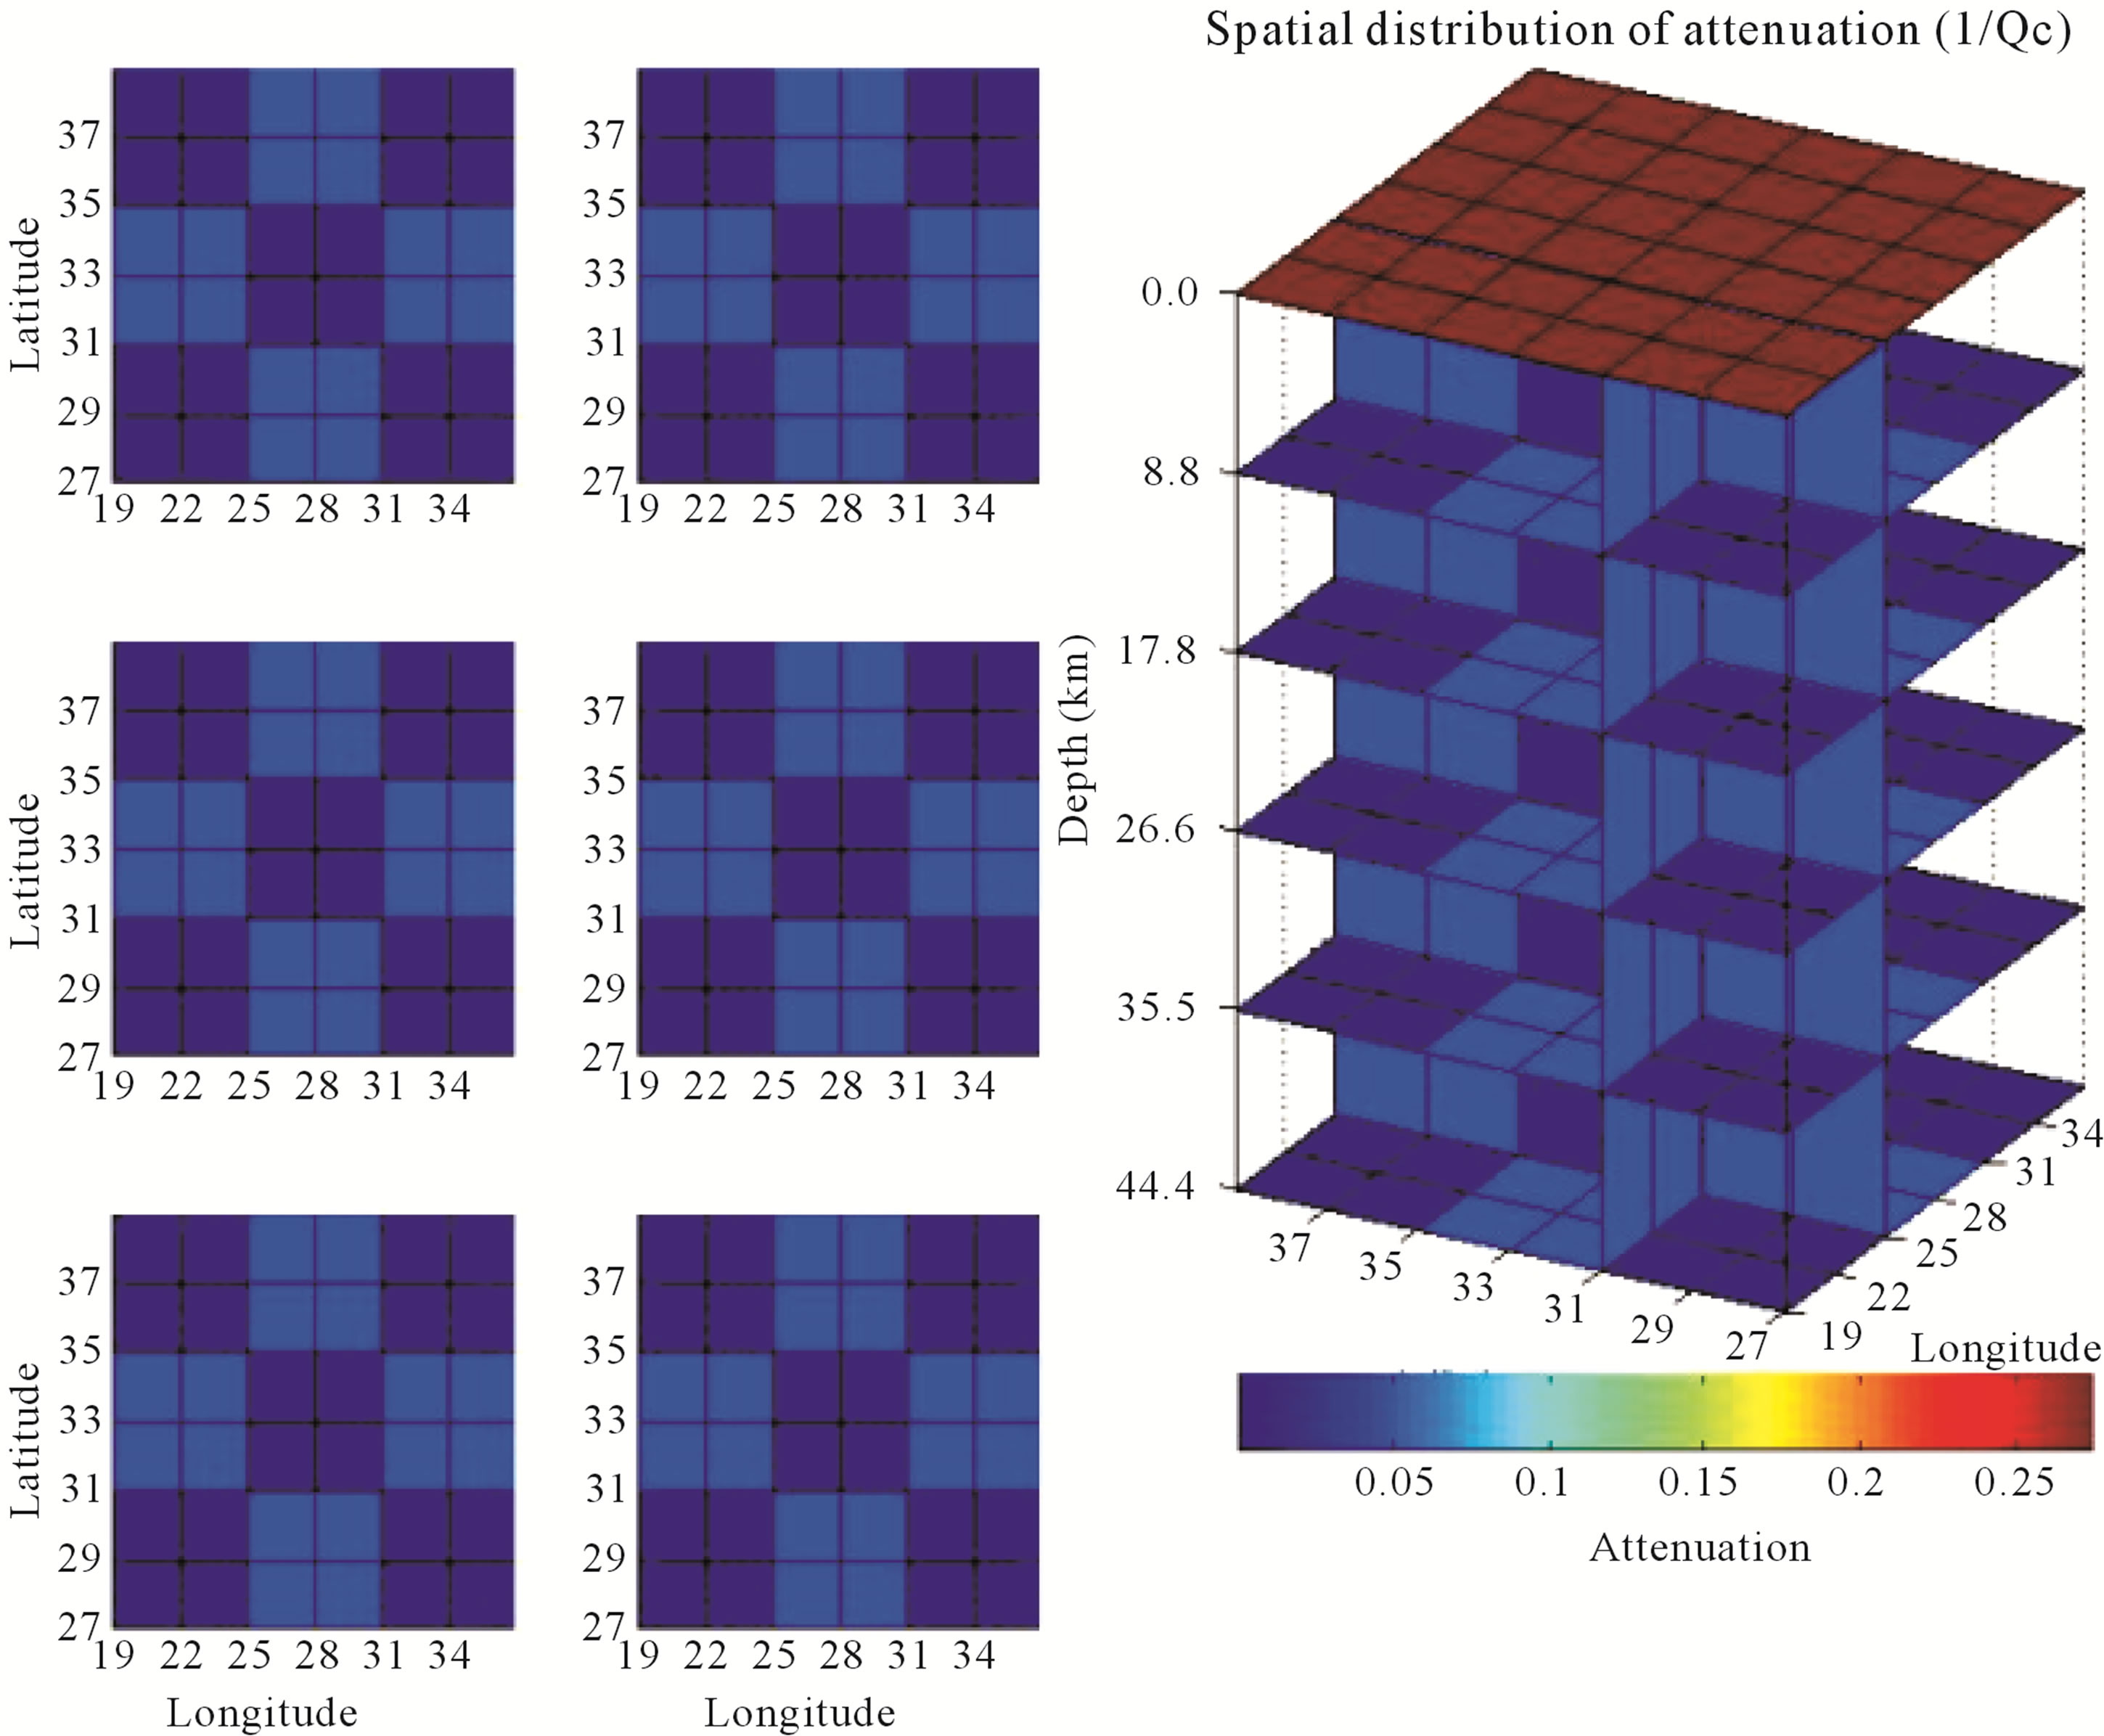 (e)
(e)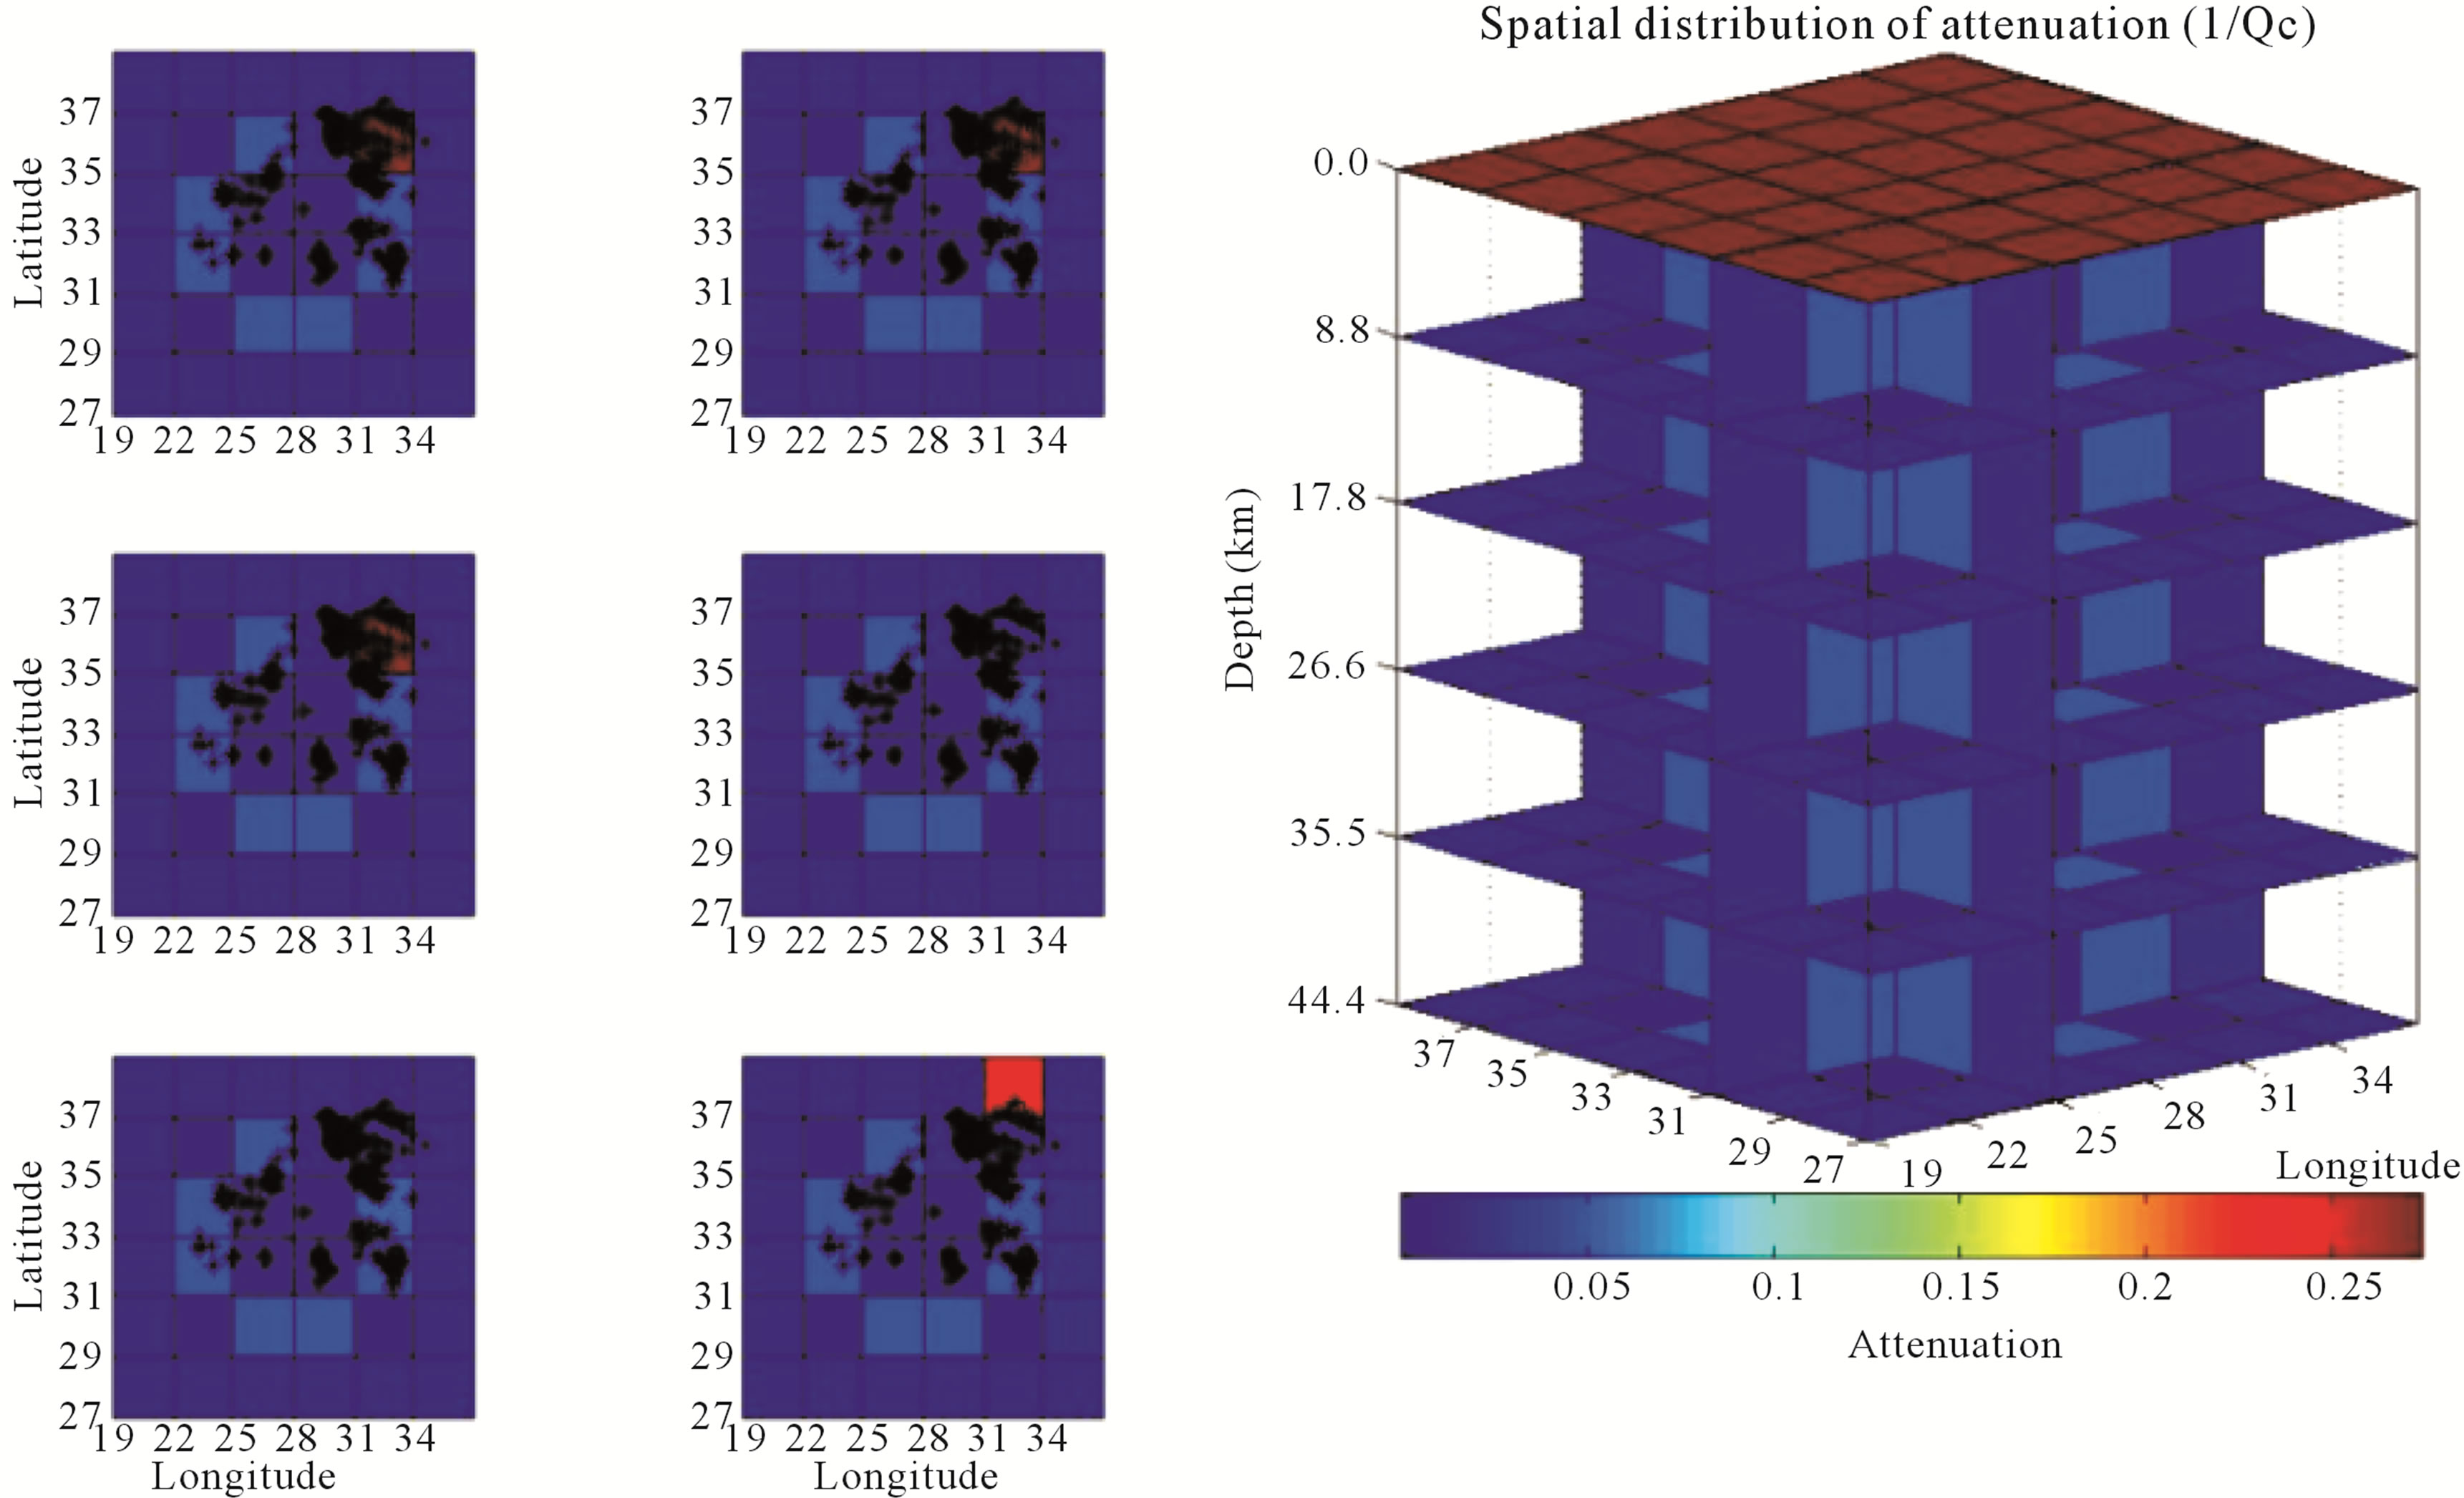 (f)
(f)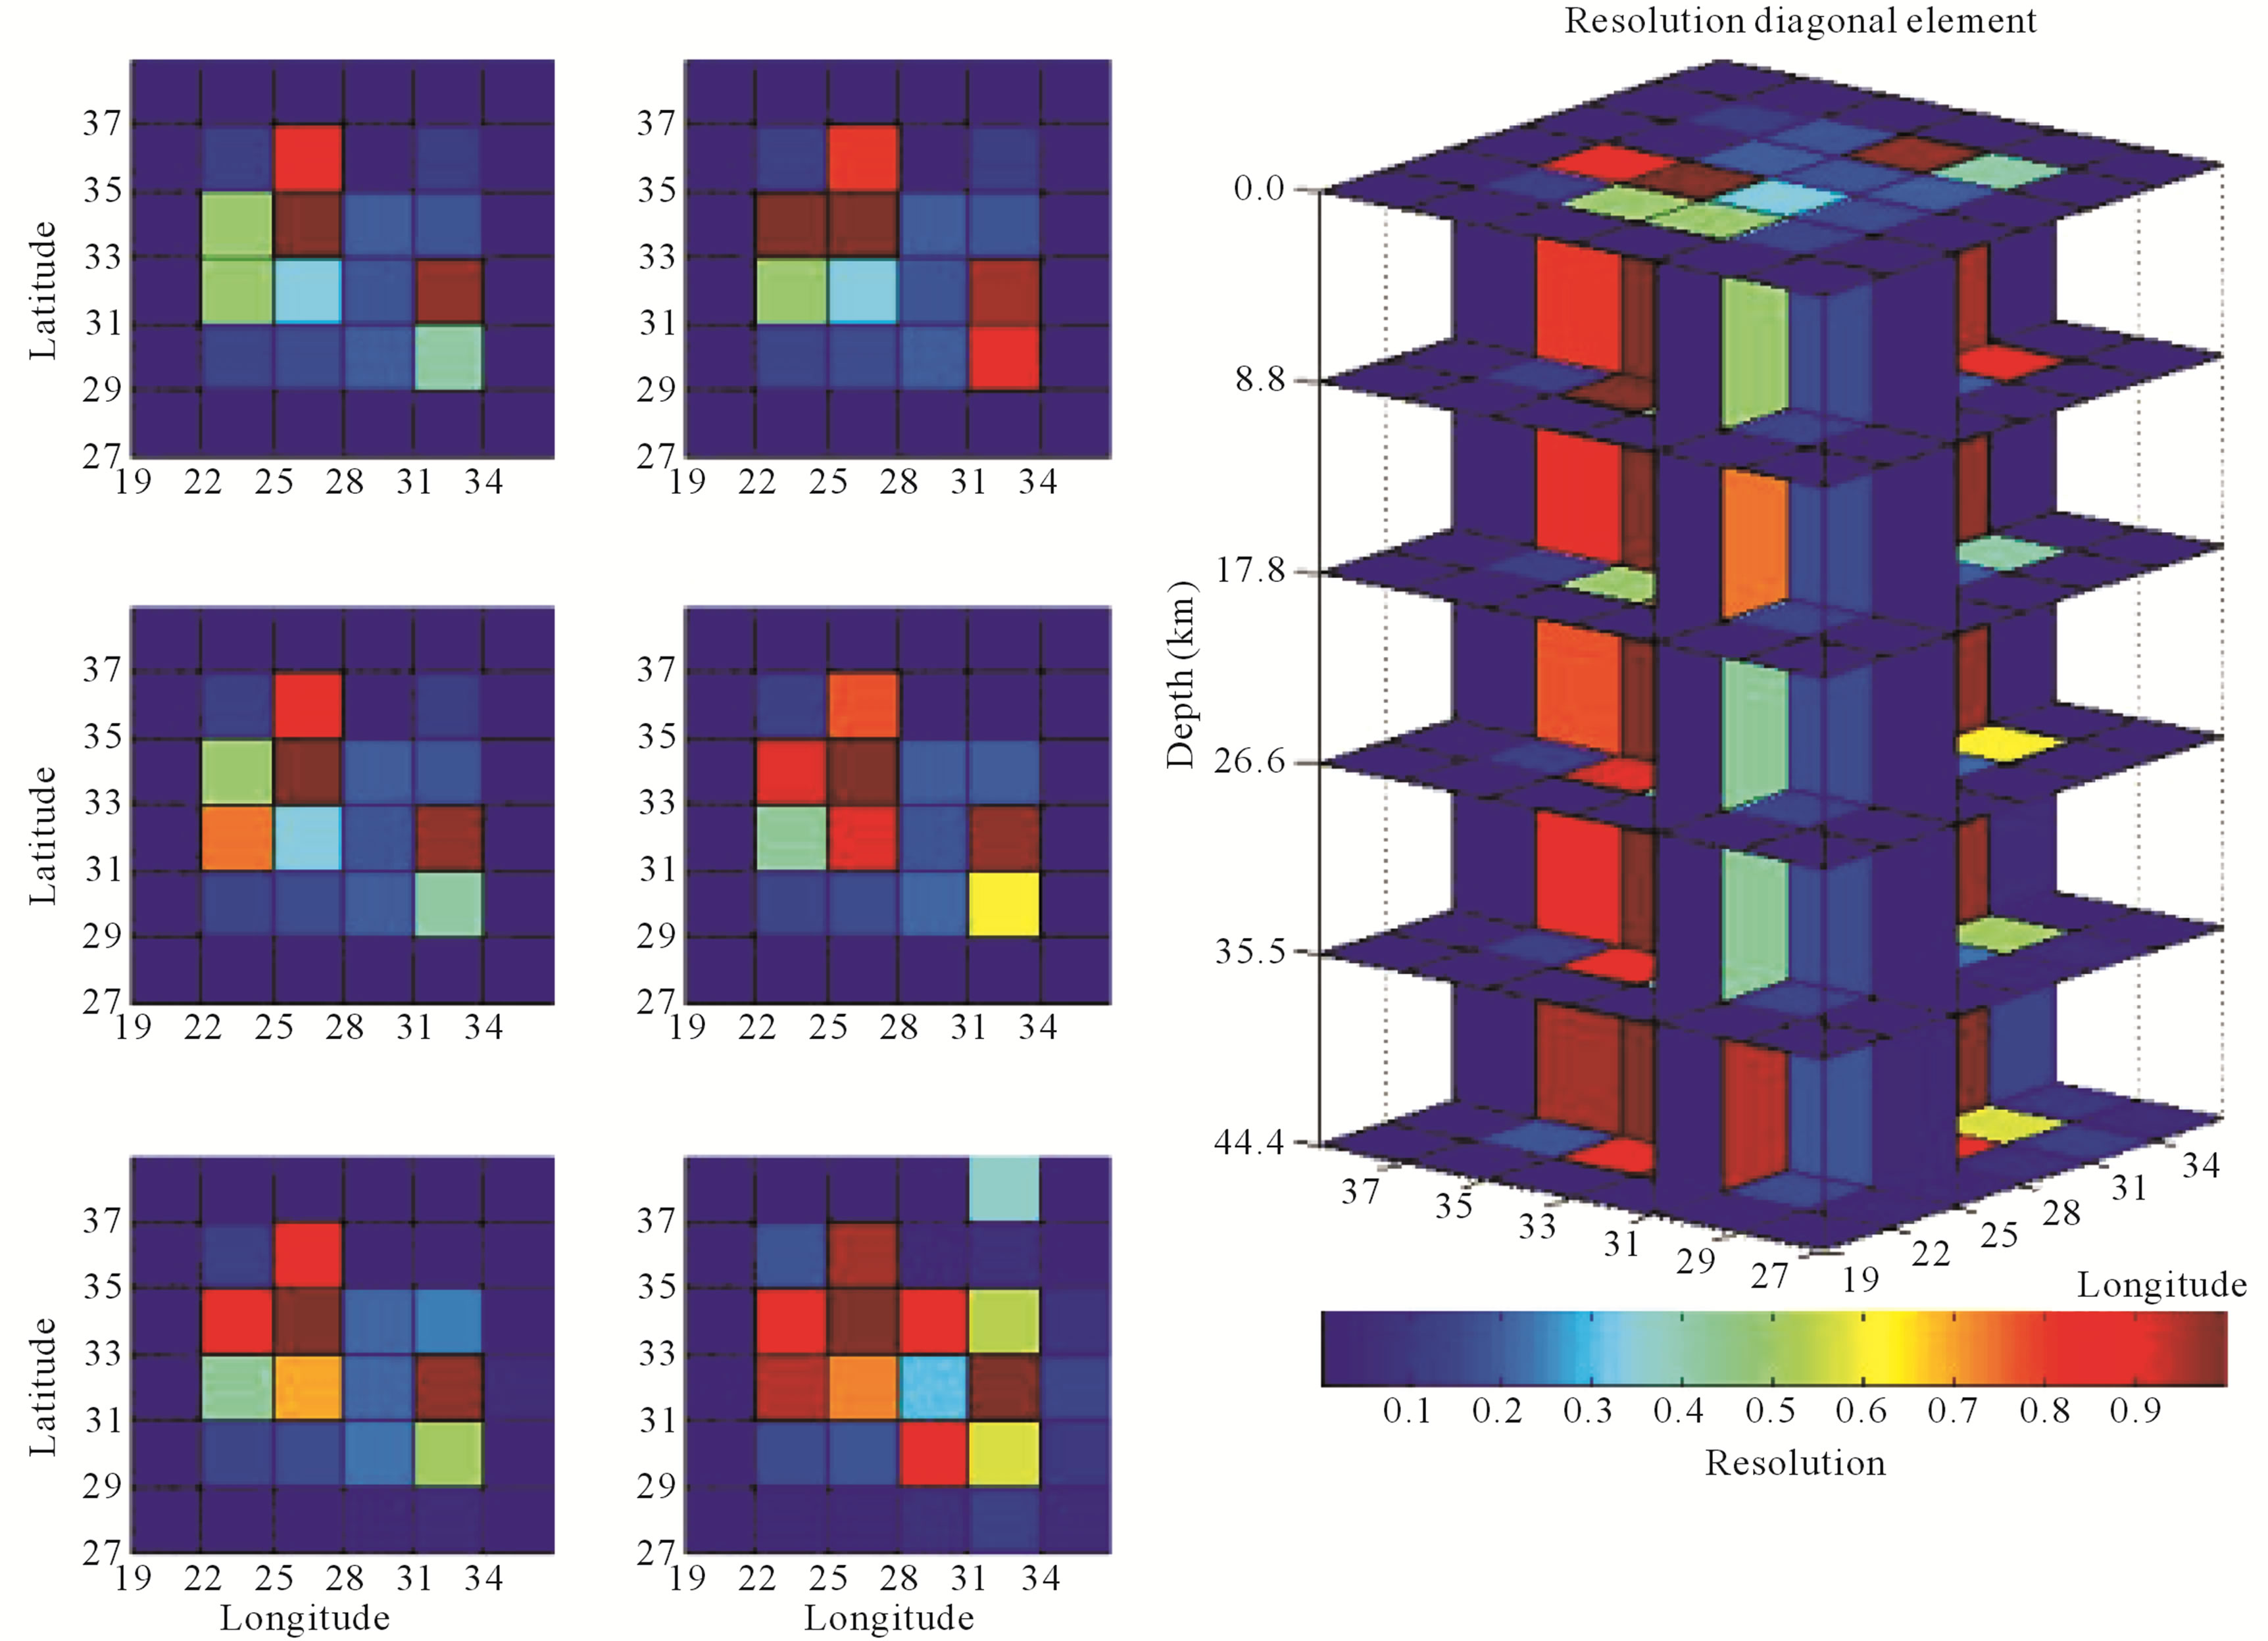 (g)
(g)
Figure 8. Earthquake distribution in the study area and synthetic test where a 3D attenuation model has been simulated with the real information of foci pairs (earthquake-station). (a) Distribution of 397 earthquakes and 63 stations in the Egypt zone; (b), (c) and (d) Horizontal and vertical projections of sampled ellipsoids. Inversion was done in a grid of 6 × 6 × 6 blocks. The ellipsoids have been cut by the intersection with the surface; (e) and (f) Original and inverted attenuation models with Qc values contrasts of 20 and 900 in the ranges 22.00˚N and 35.00˚N; longitude range between 25.000˚E and 36.000˚E; (g) Spatial distribution of RDE of the last model.
5. RESULTS AND DISCUSSION
The 3D attenuation  was calculated for Egypt using 397 local and regional earthquakes recorded by 63 seismic stations belonging to the Egyptian National Seismic Network (1997-2008) in the magnitude (3 - 5.5). Based on different synthetic tests, the distribution of events and stations gives reliable 3D
  in the latitude range between 22.000˚N and 35.000˚N; longitude range between 25.000˚E and 36.000˚E, and depth range located between 0.0 and 100.0 km approx., where the distribution of RDE values shows that in the marginal areas the results would not bereliable. The 3D
  was calculated with the real data for each central frequency ranged from 1.0 to 24 Hz avoiding the unreliable results of the marginal area. Figures 9-16 present the spatial variations of 3D-
 values for central frequentcies 1.5, 3.0, 6.0, 9.0, 12.0, 15.0, 18.0, and 24.0 Hz.
The results clearly reveal a remarkable high contrast in

Figure 9. Distribution of Qc values in depth for frequency 1.5 Hz.

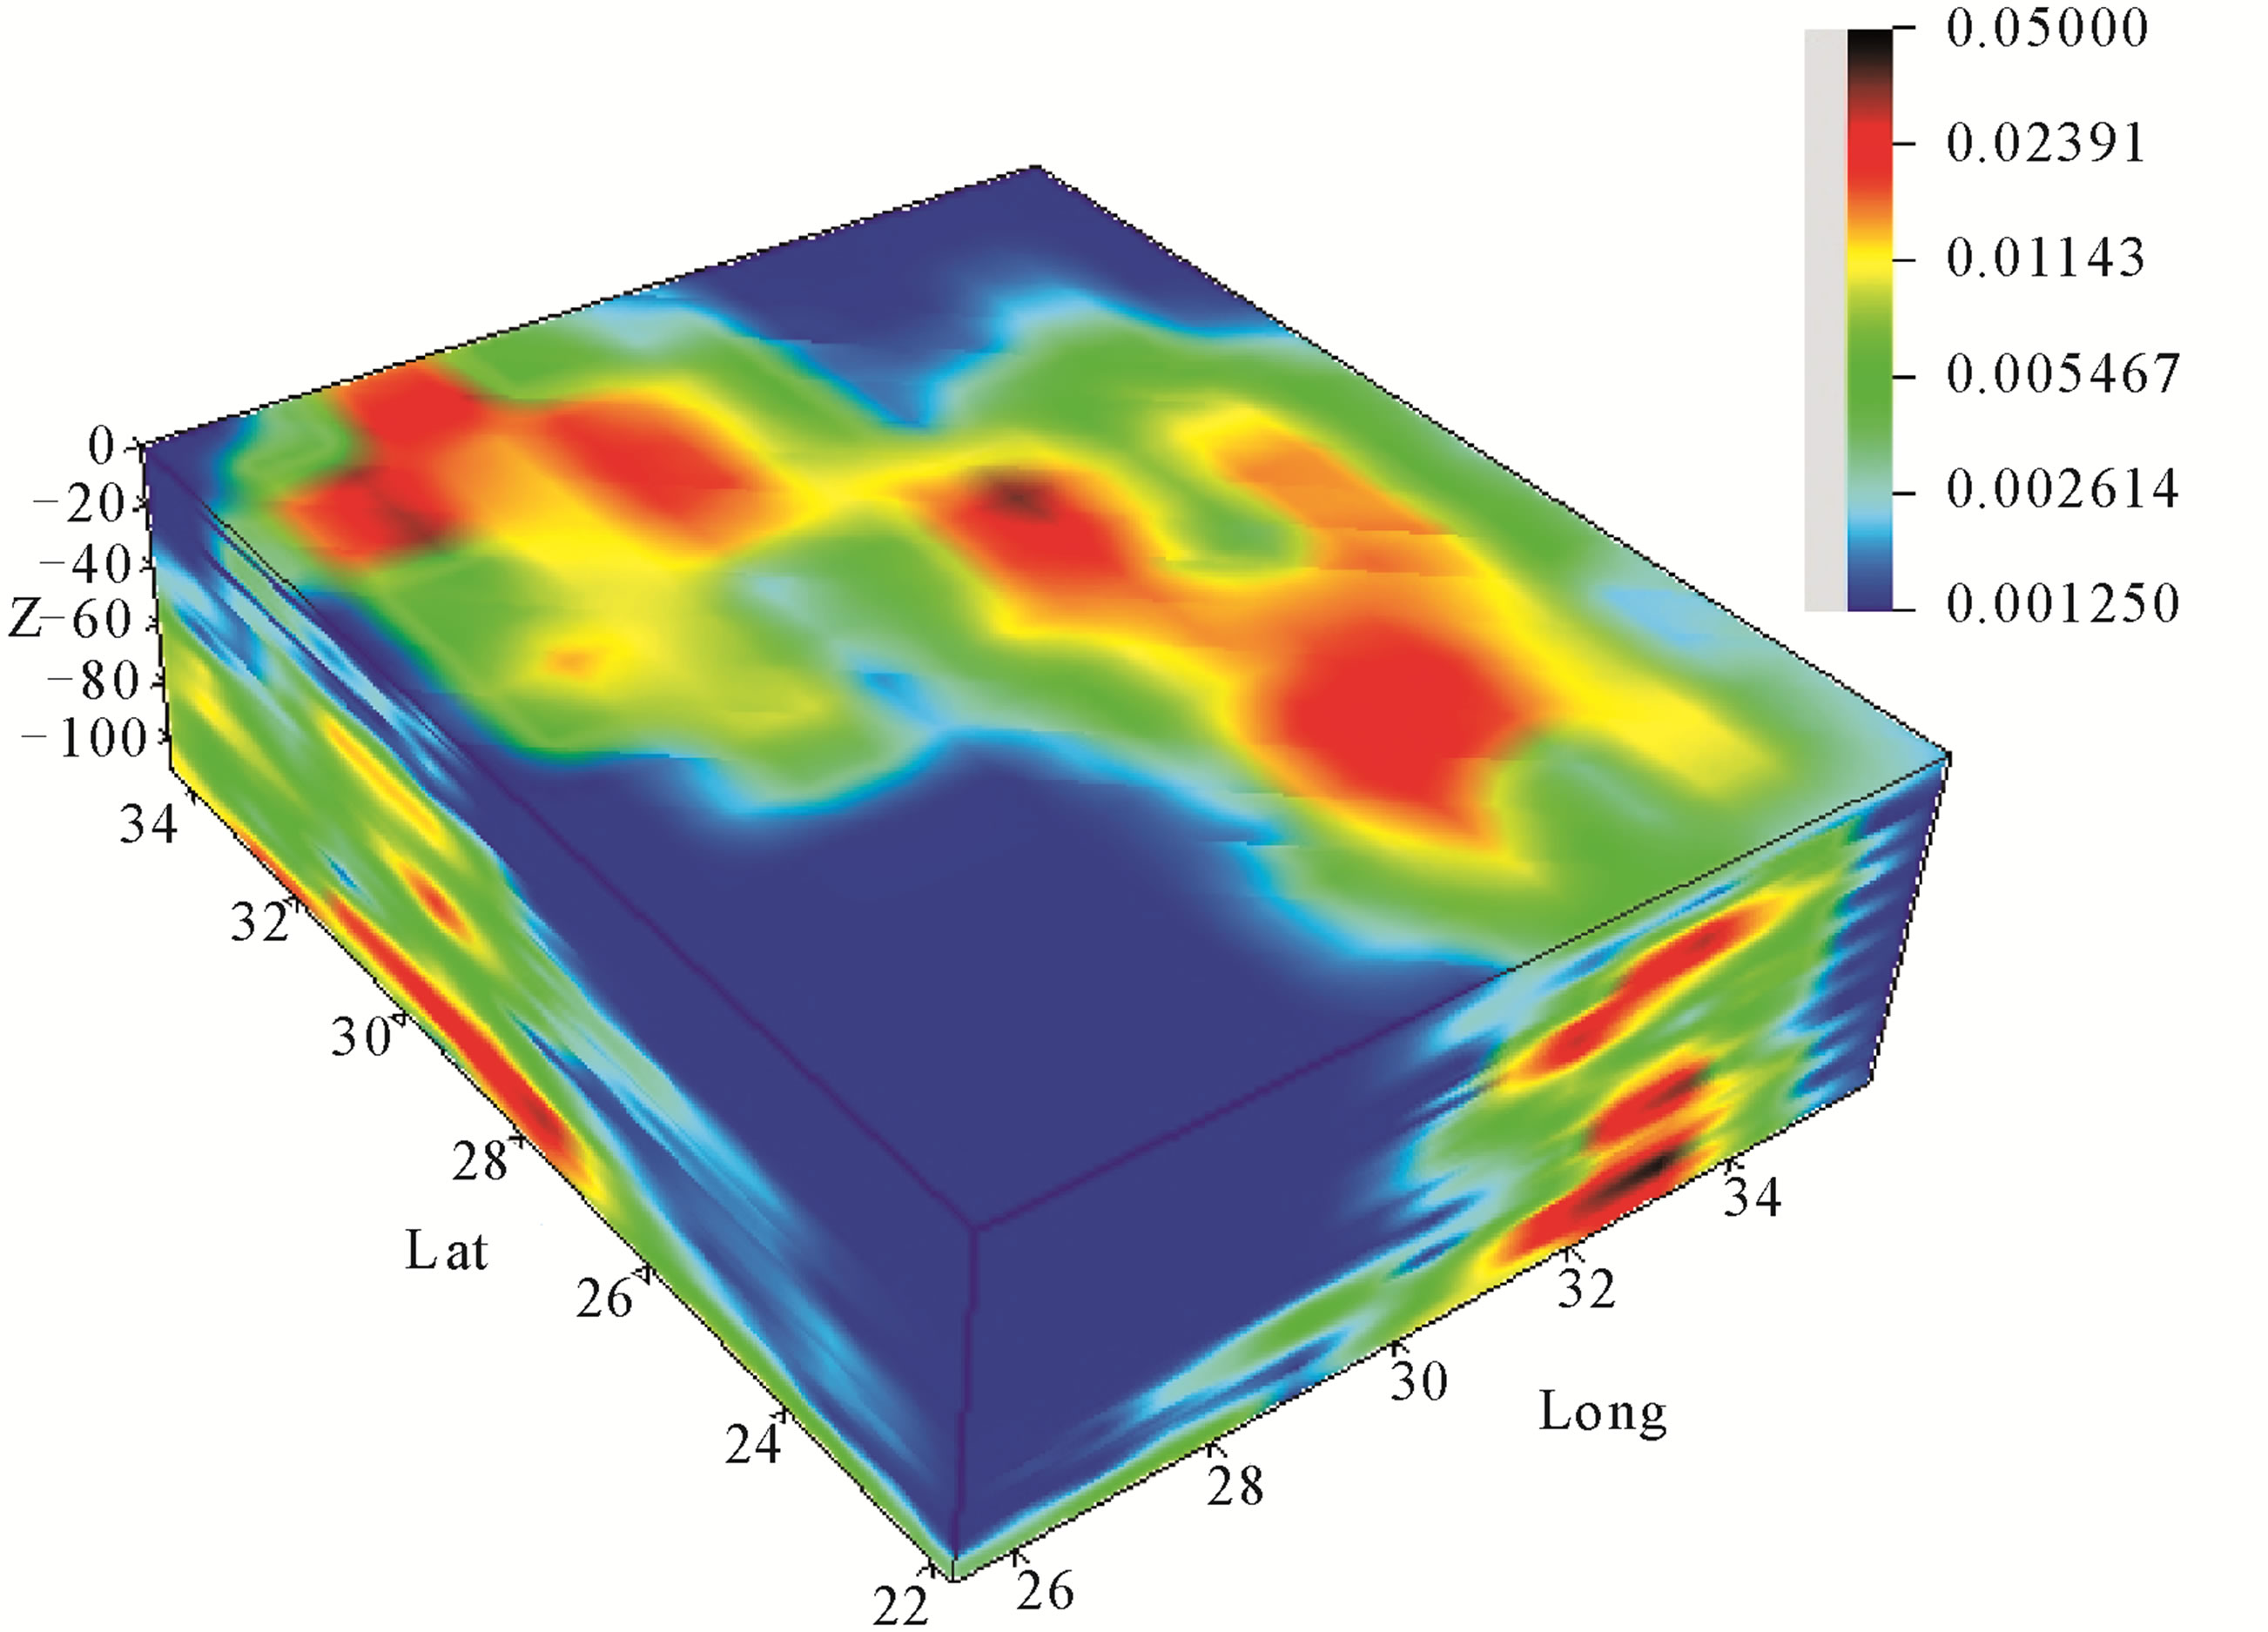
Figure 10. Distribution of Qc values in depth for frequency 3 Hz.

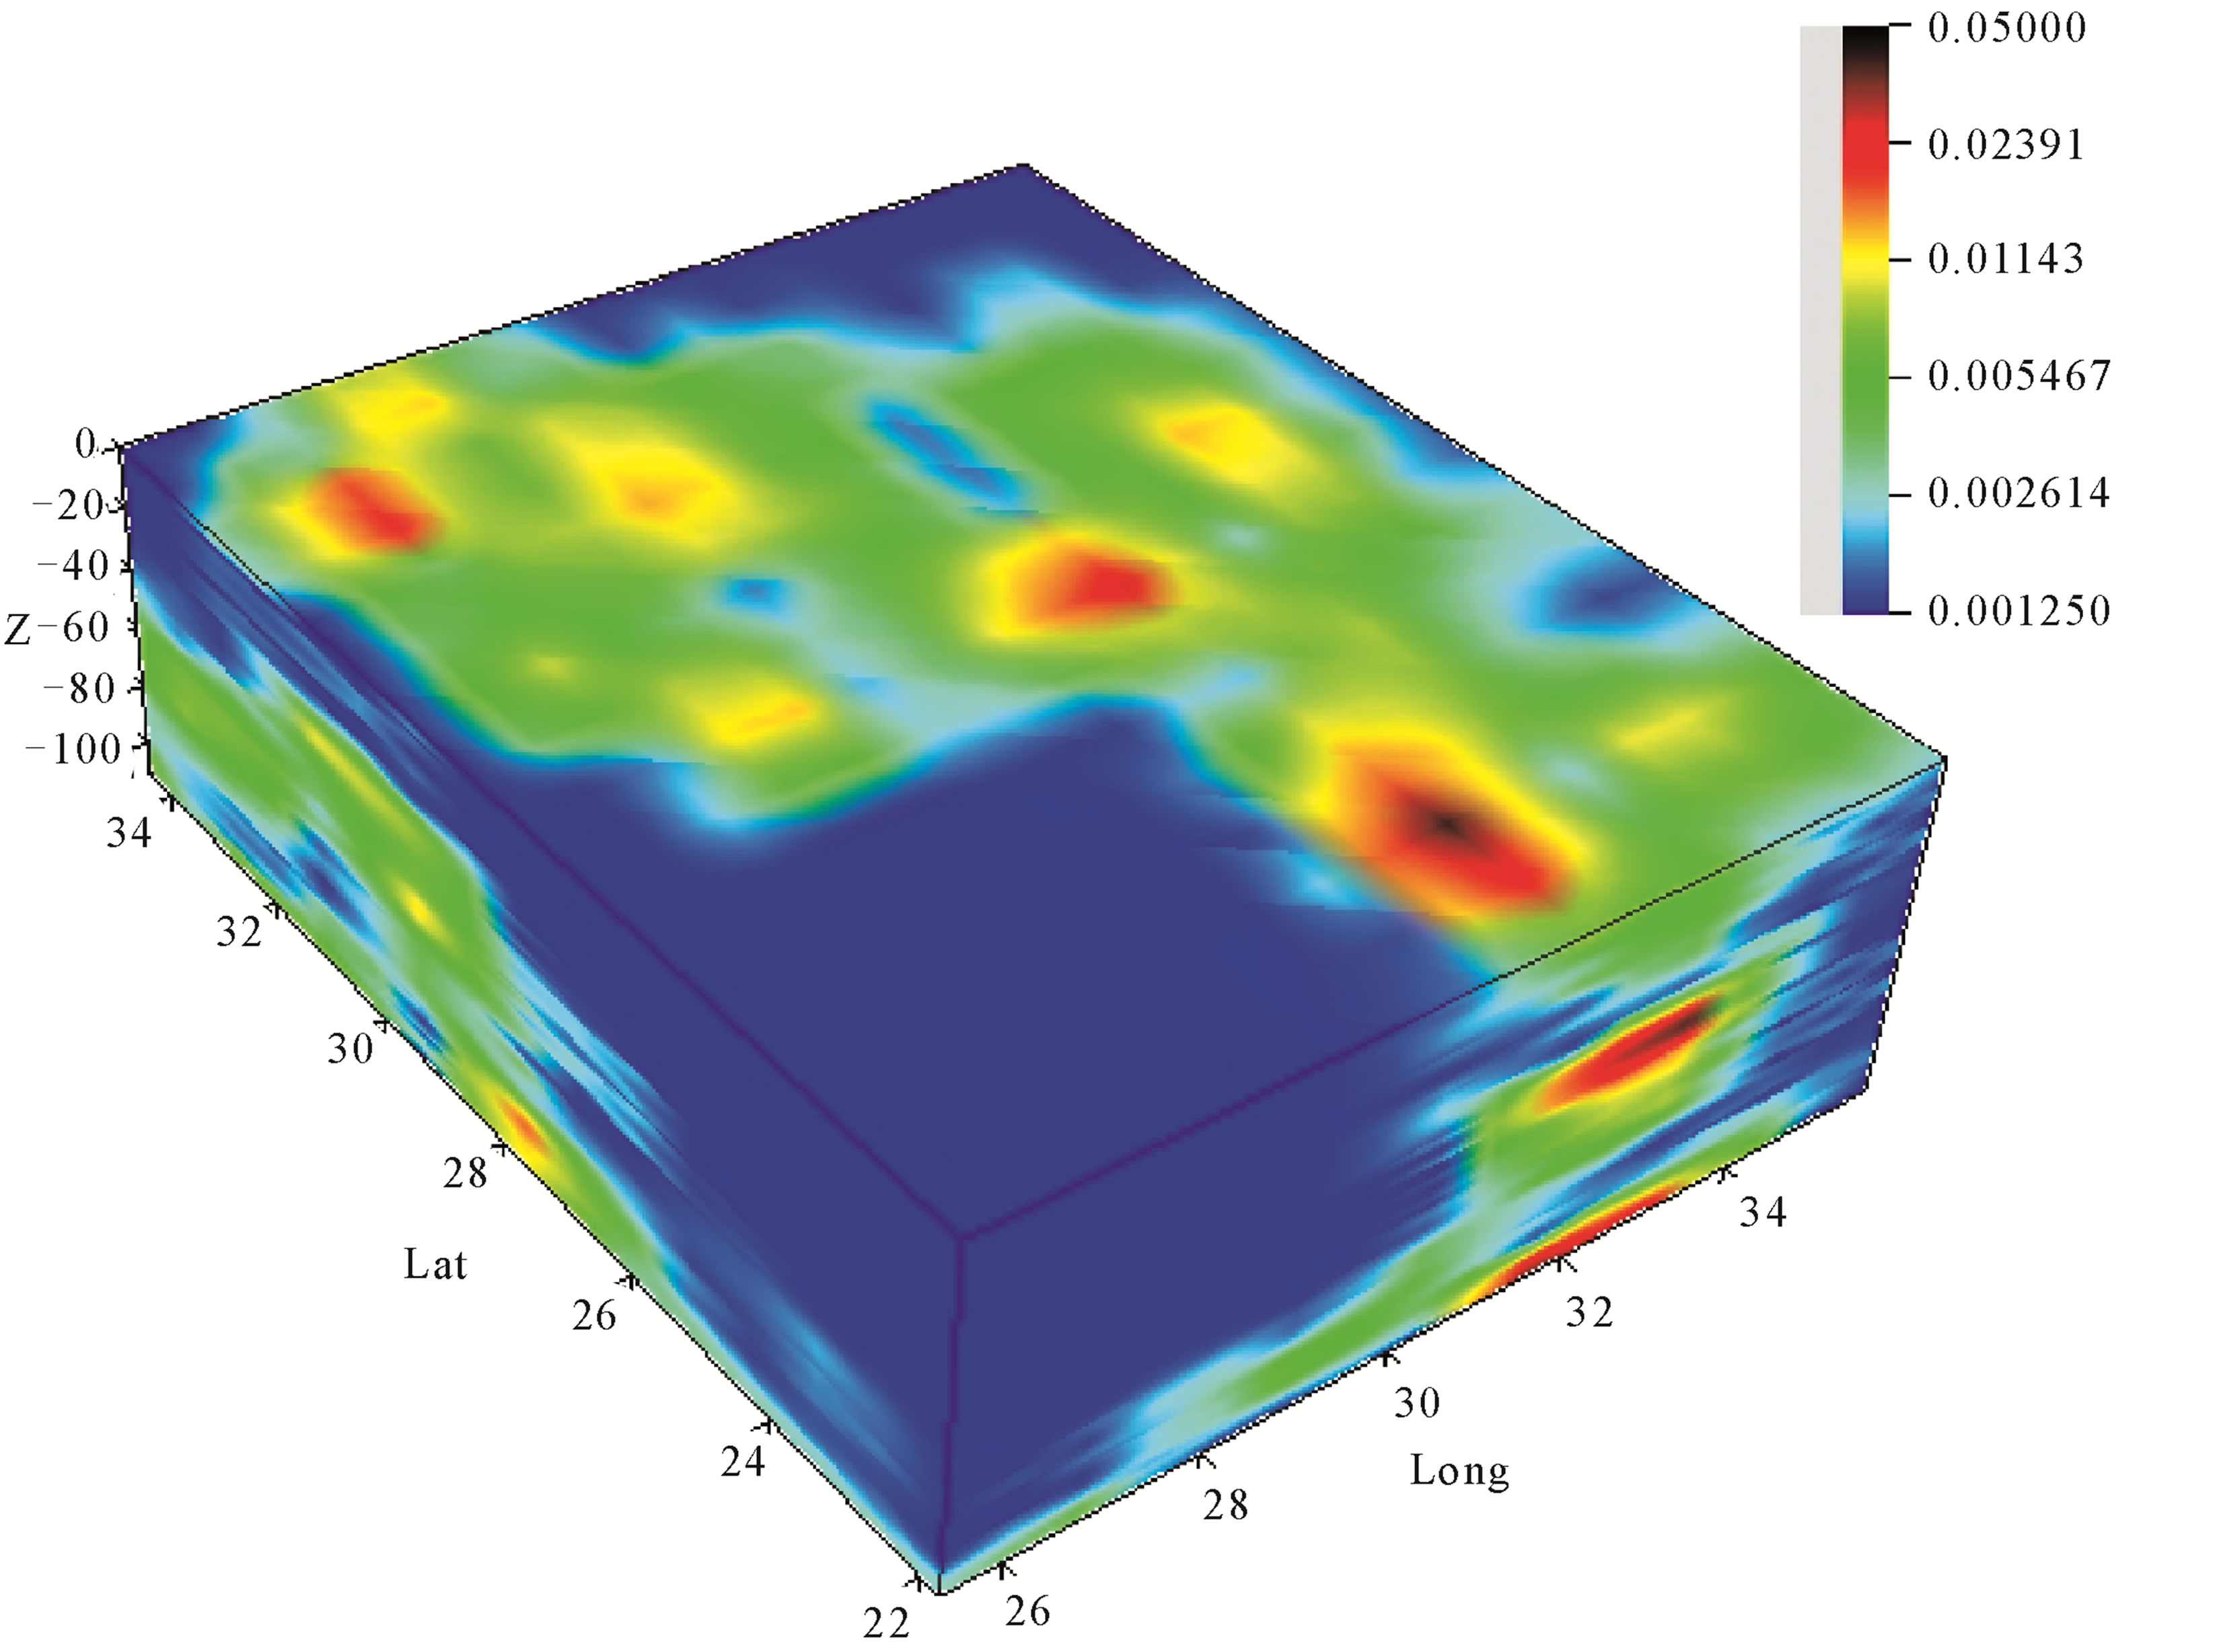
Figure 11. Distribution of Qc values in depth for frequency 6 Hz.

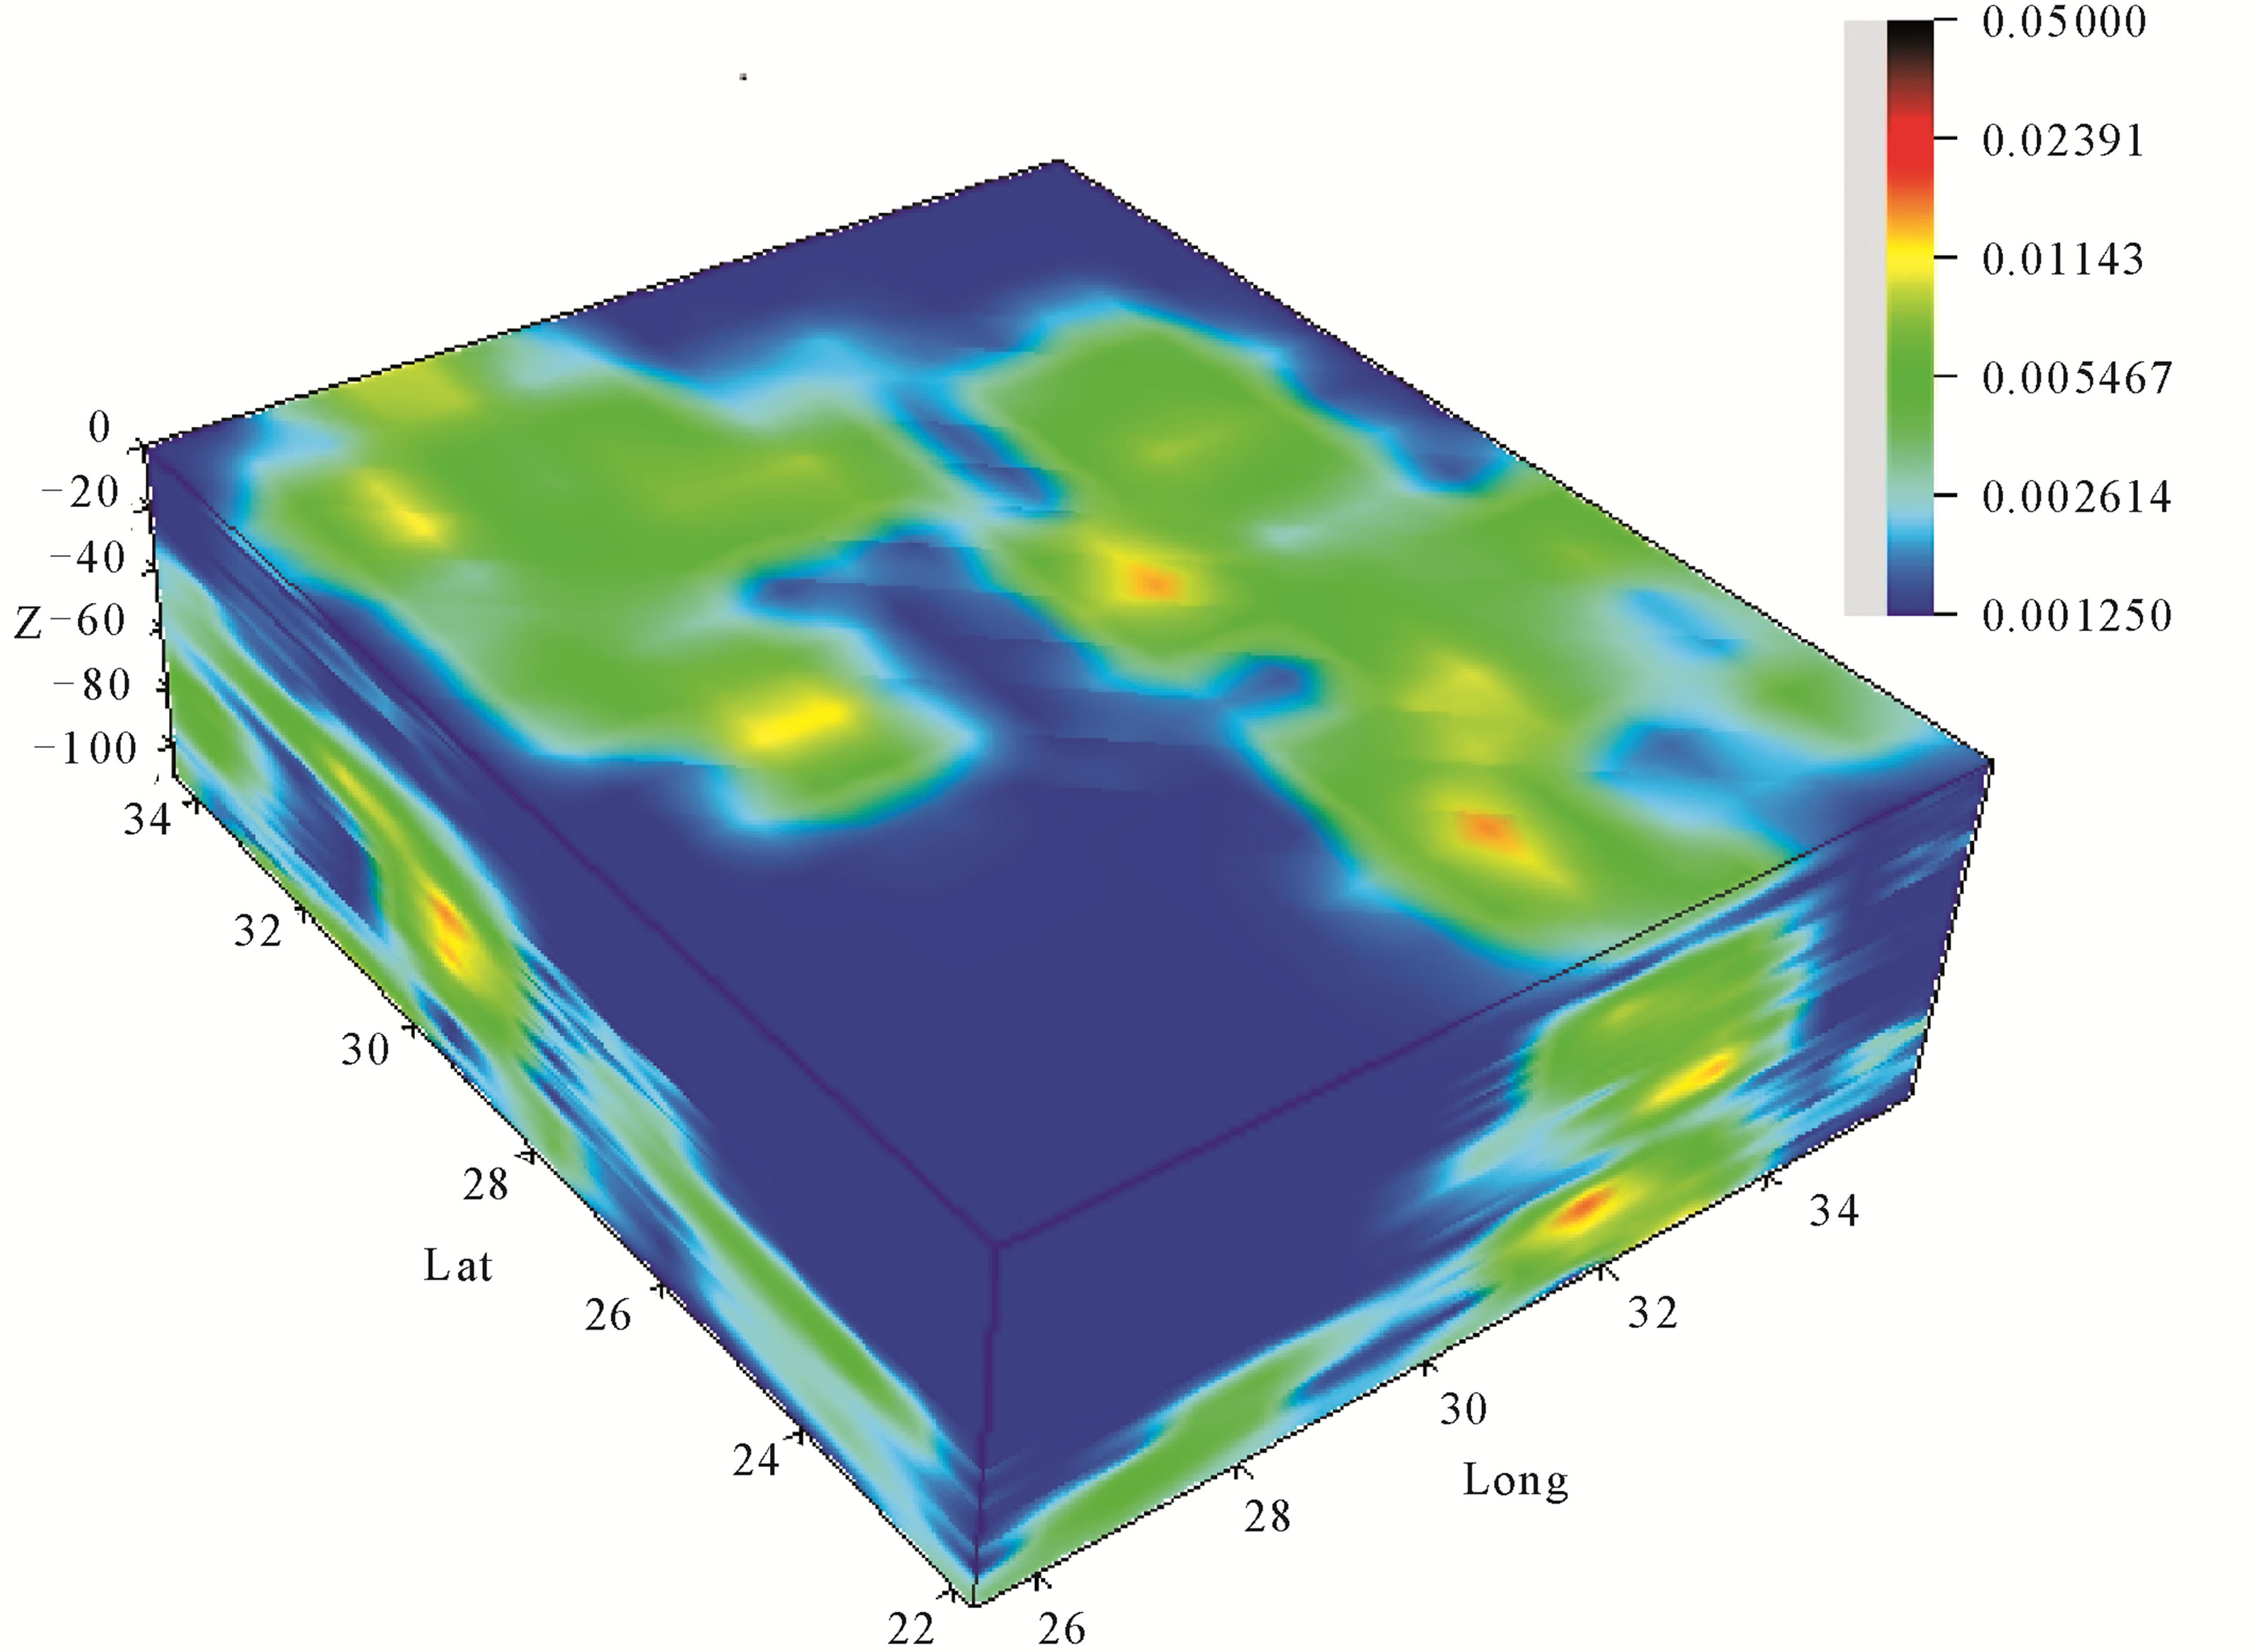
Figure 12. Distribution of Qc values in depth for frequency 9 Hz.

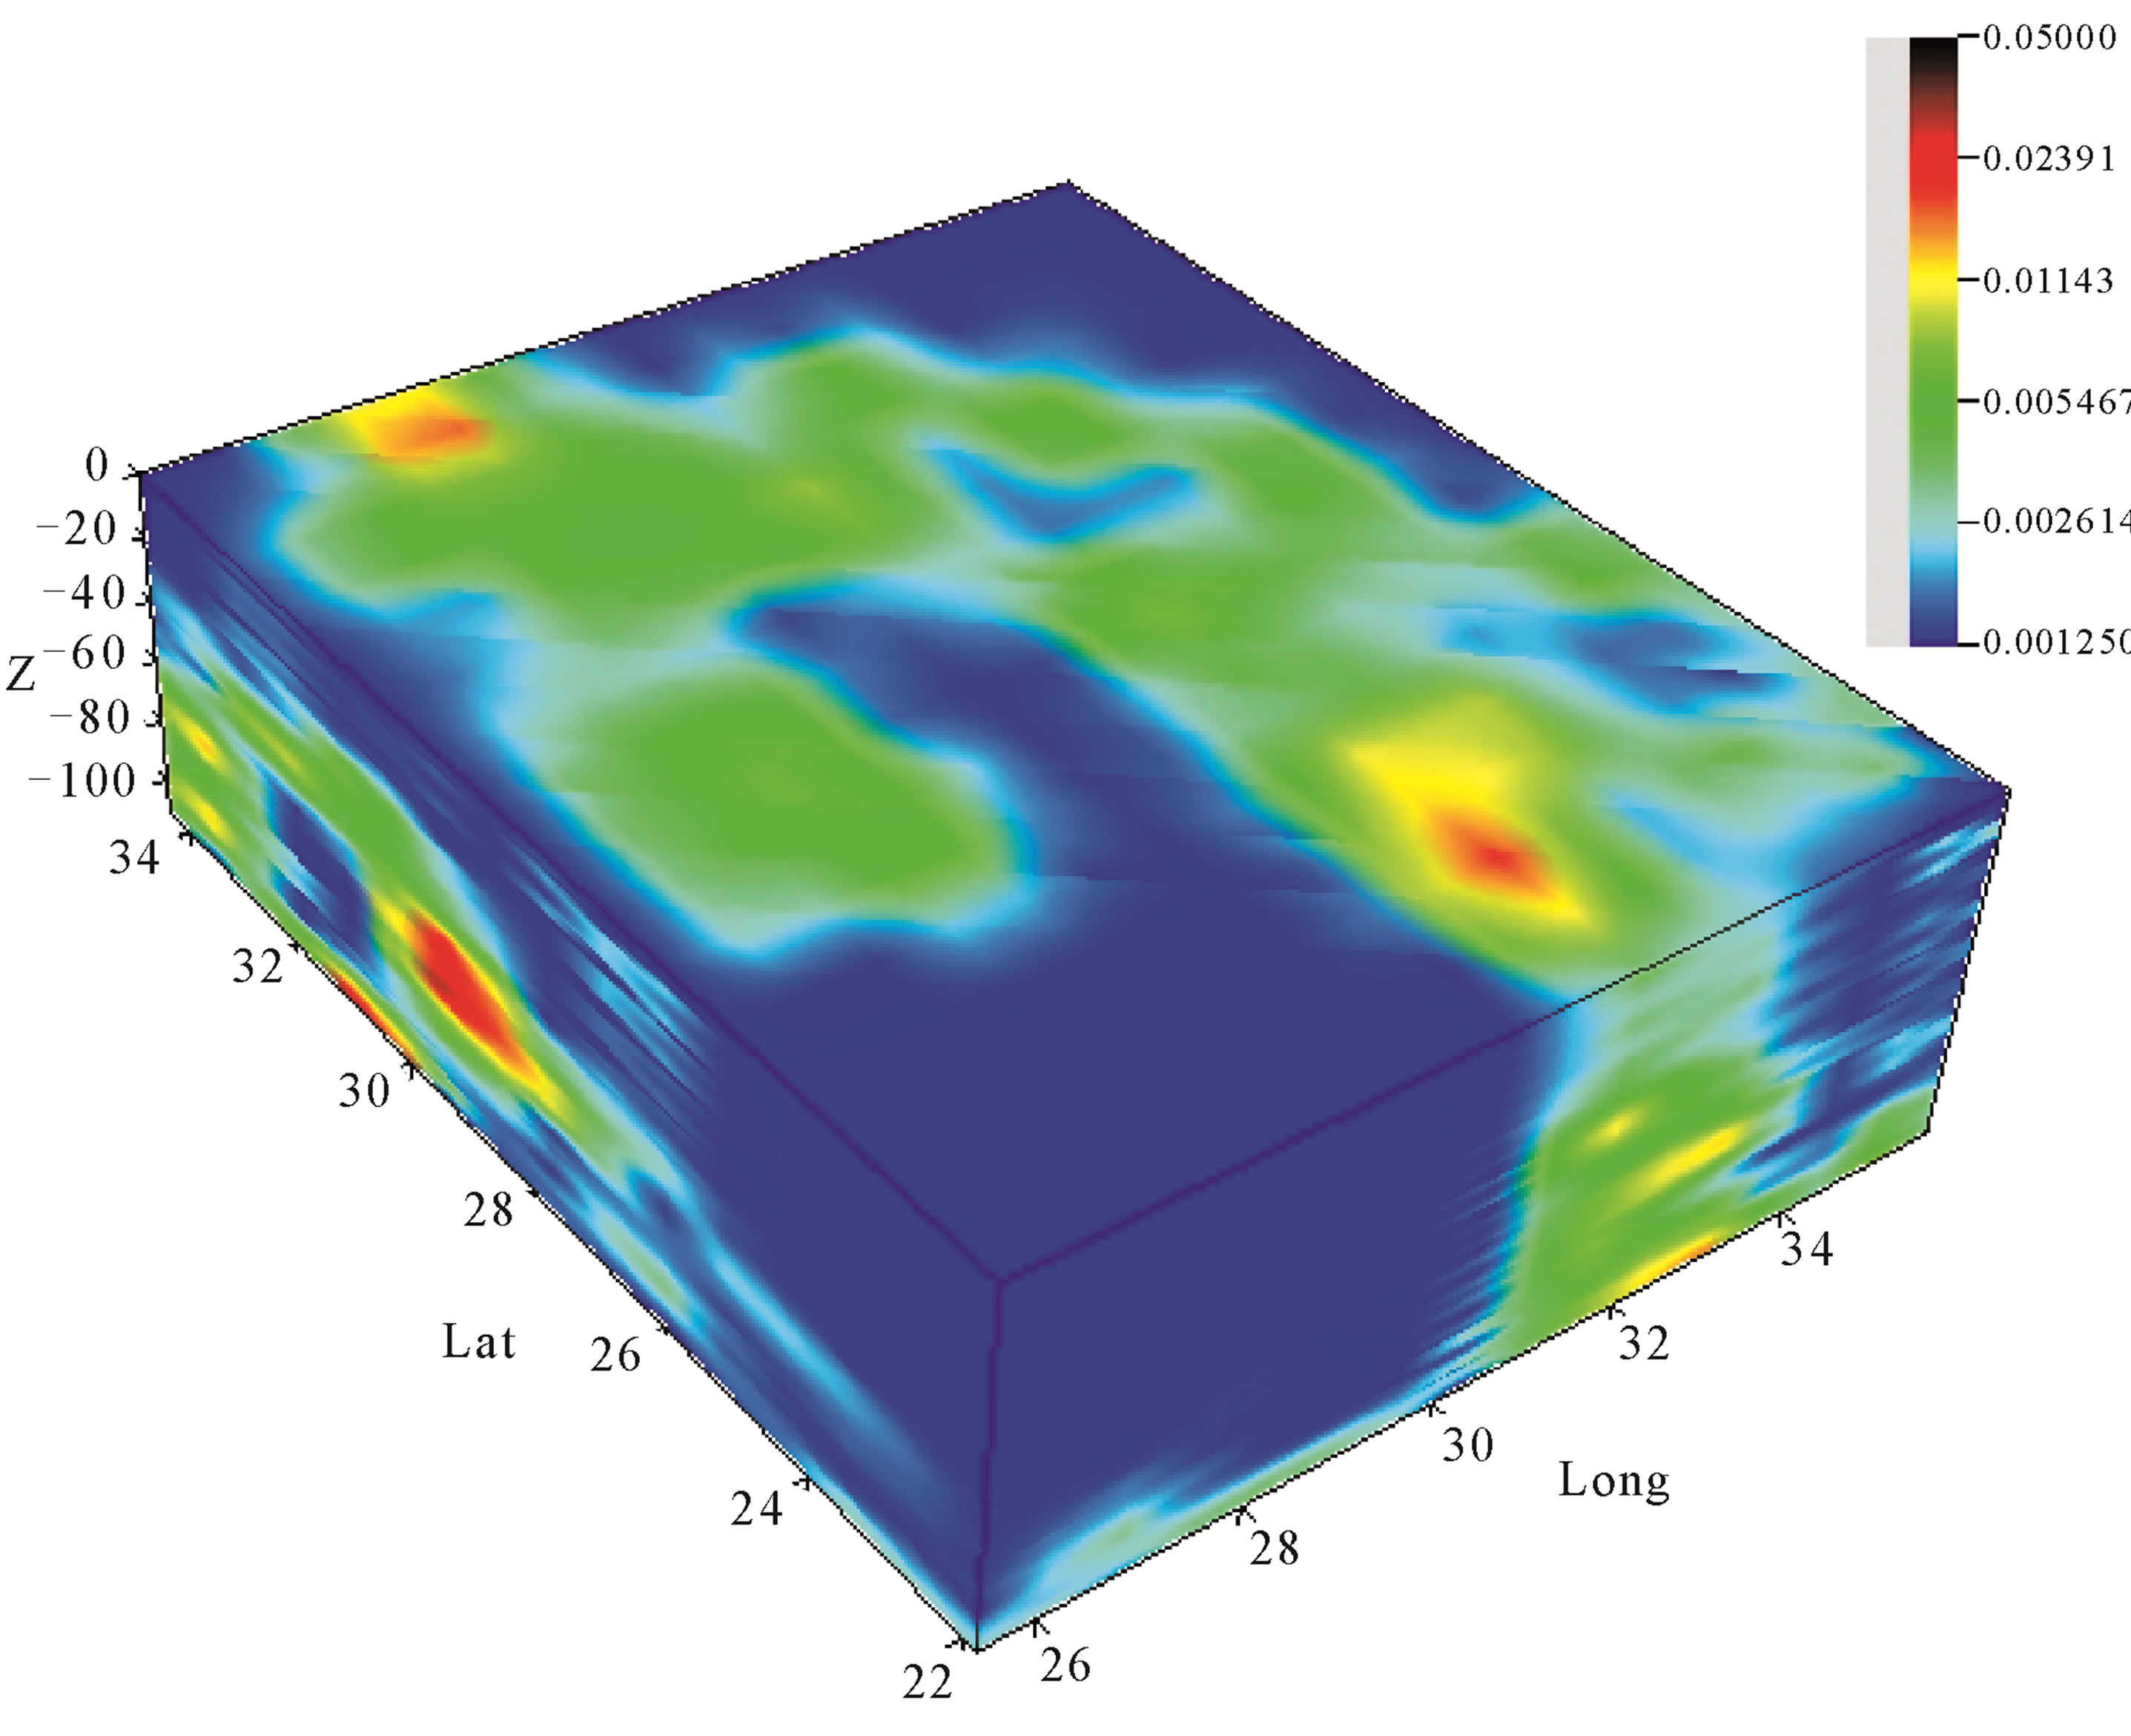
Figure 13. Distribution of Qc values in depth for frequency 12 Hz.

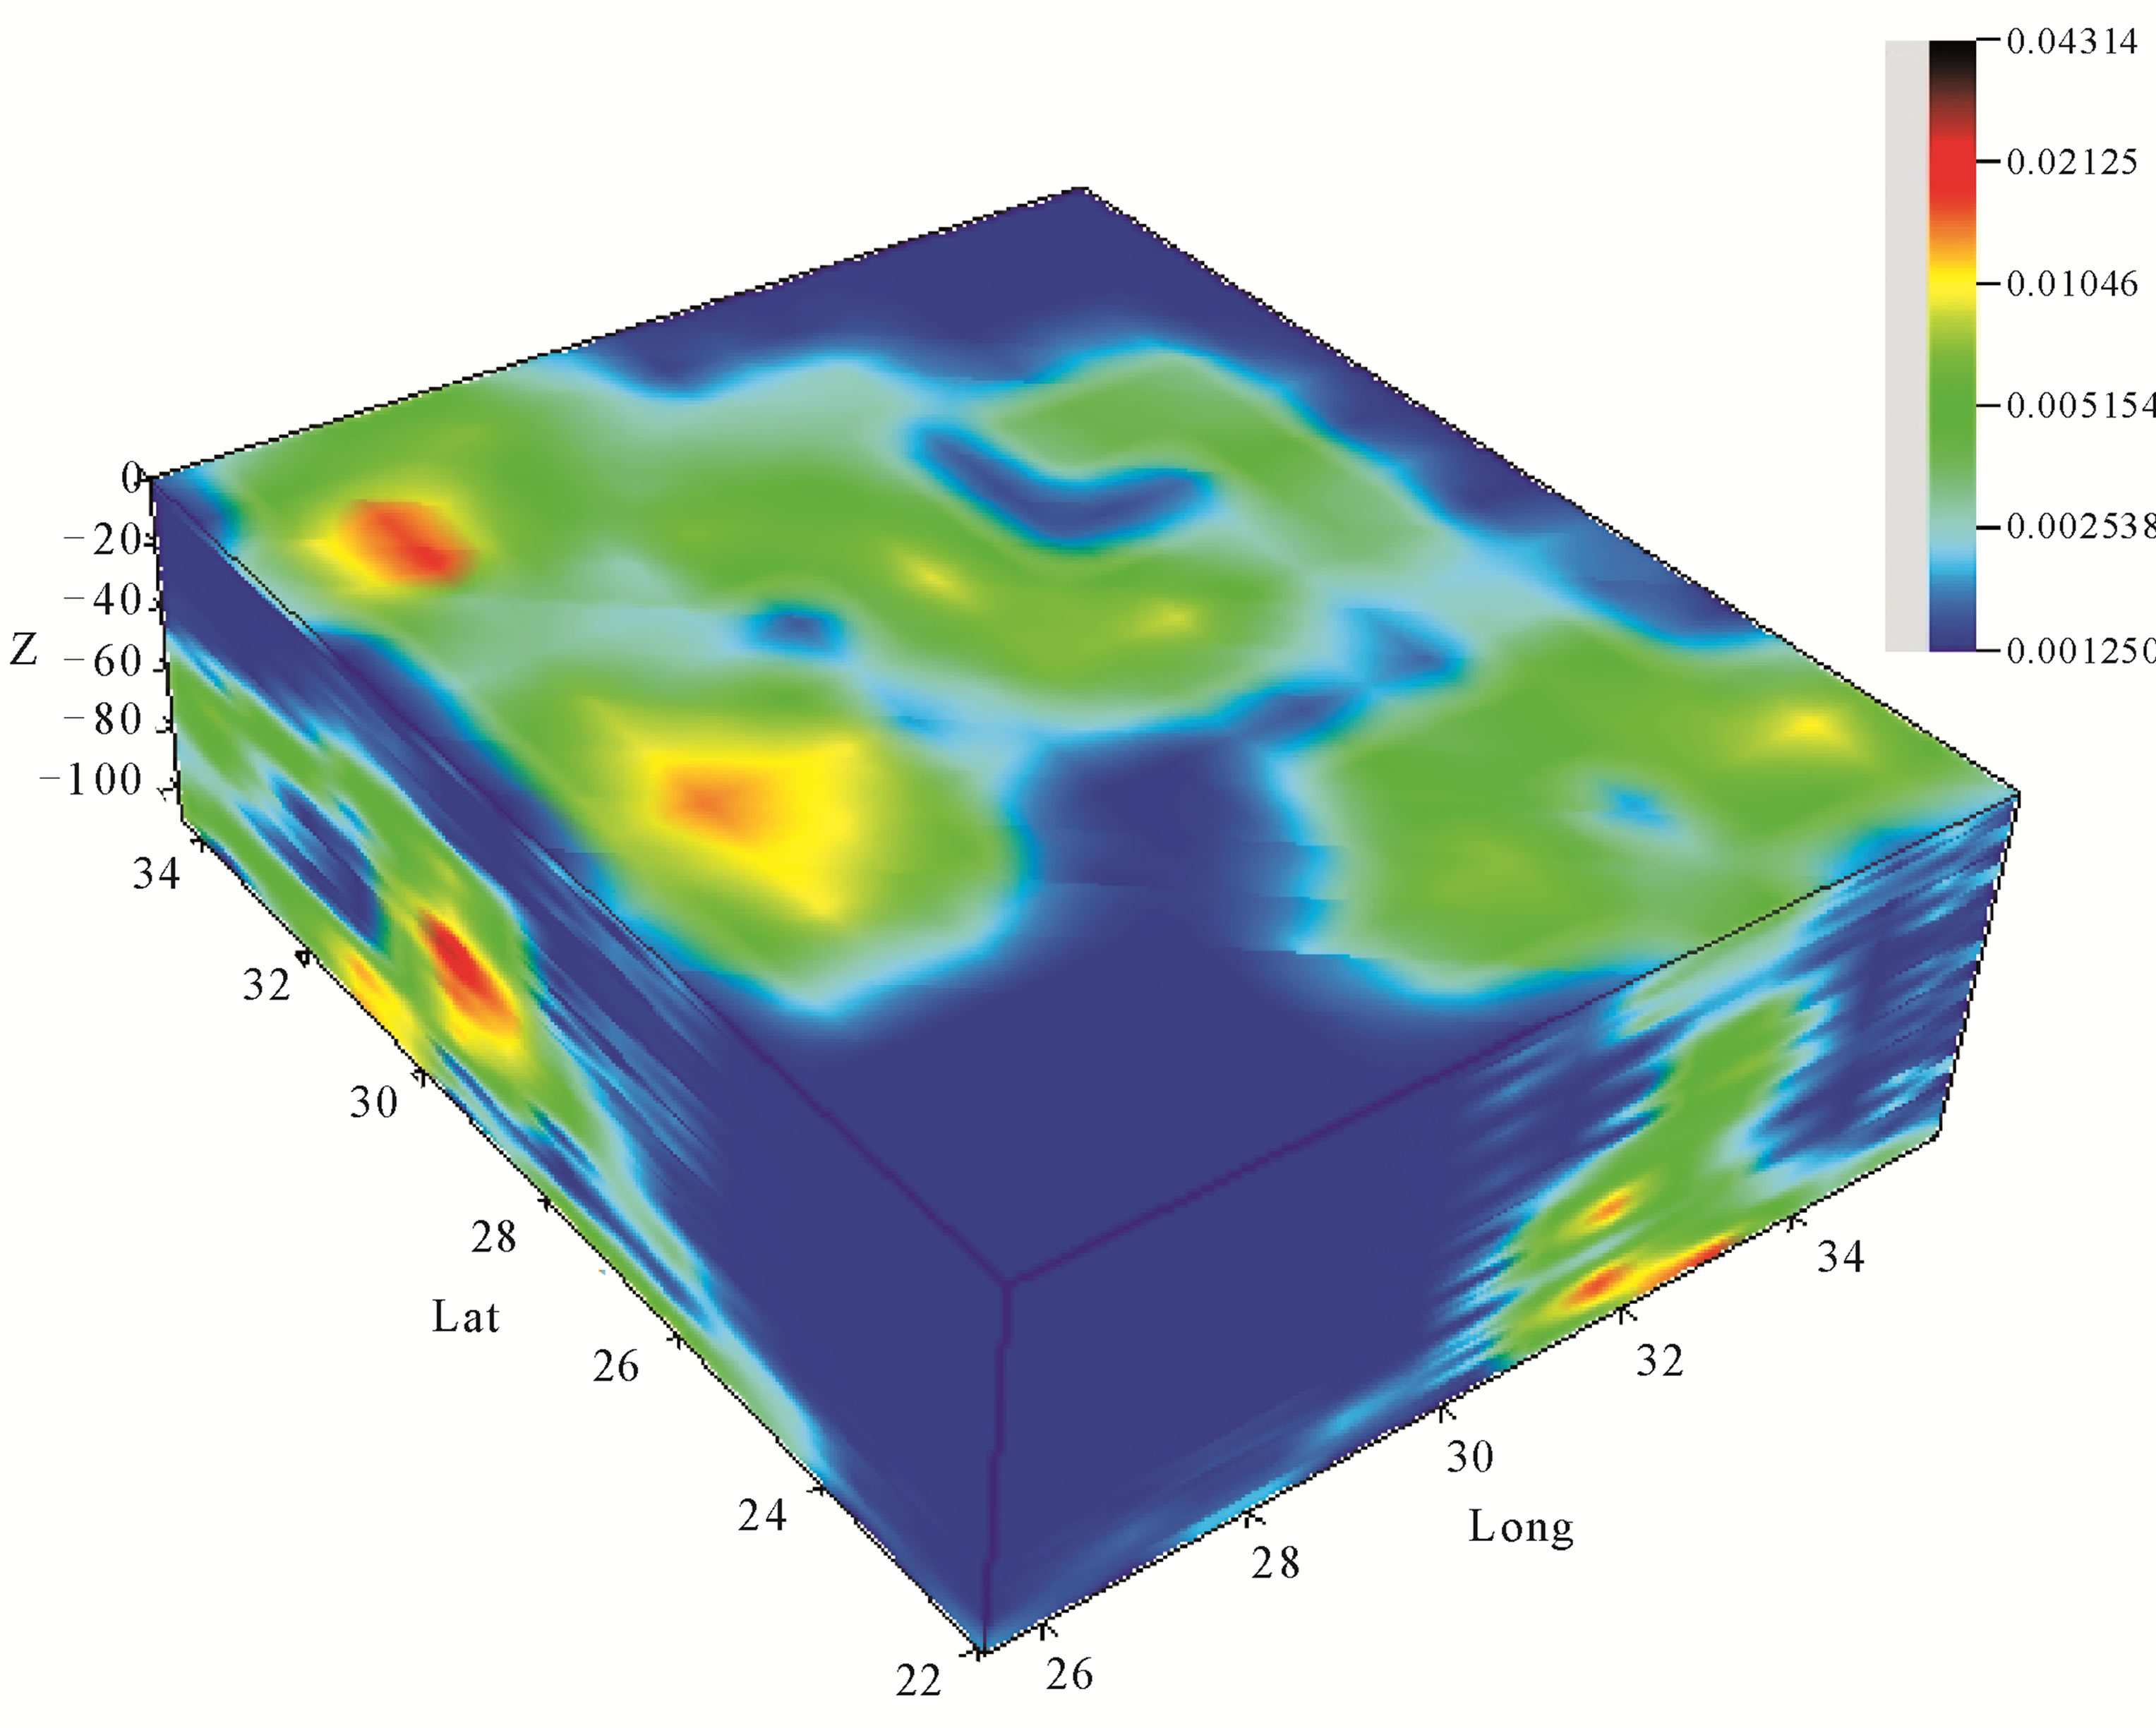
Figure 14. Distribution of Qc values in depth for frequency 15 Hz.

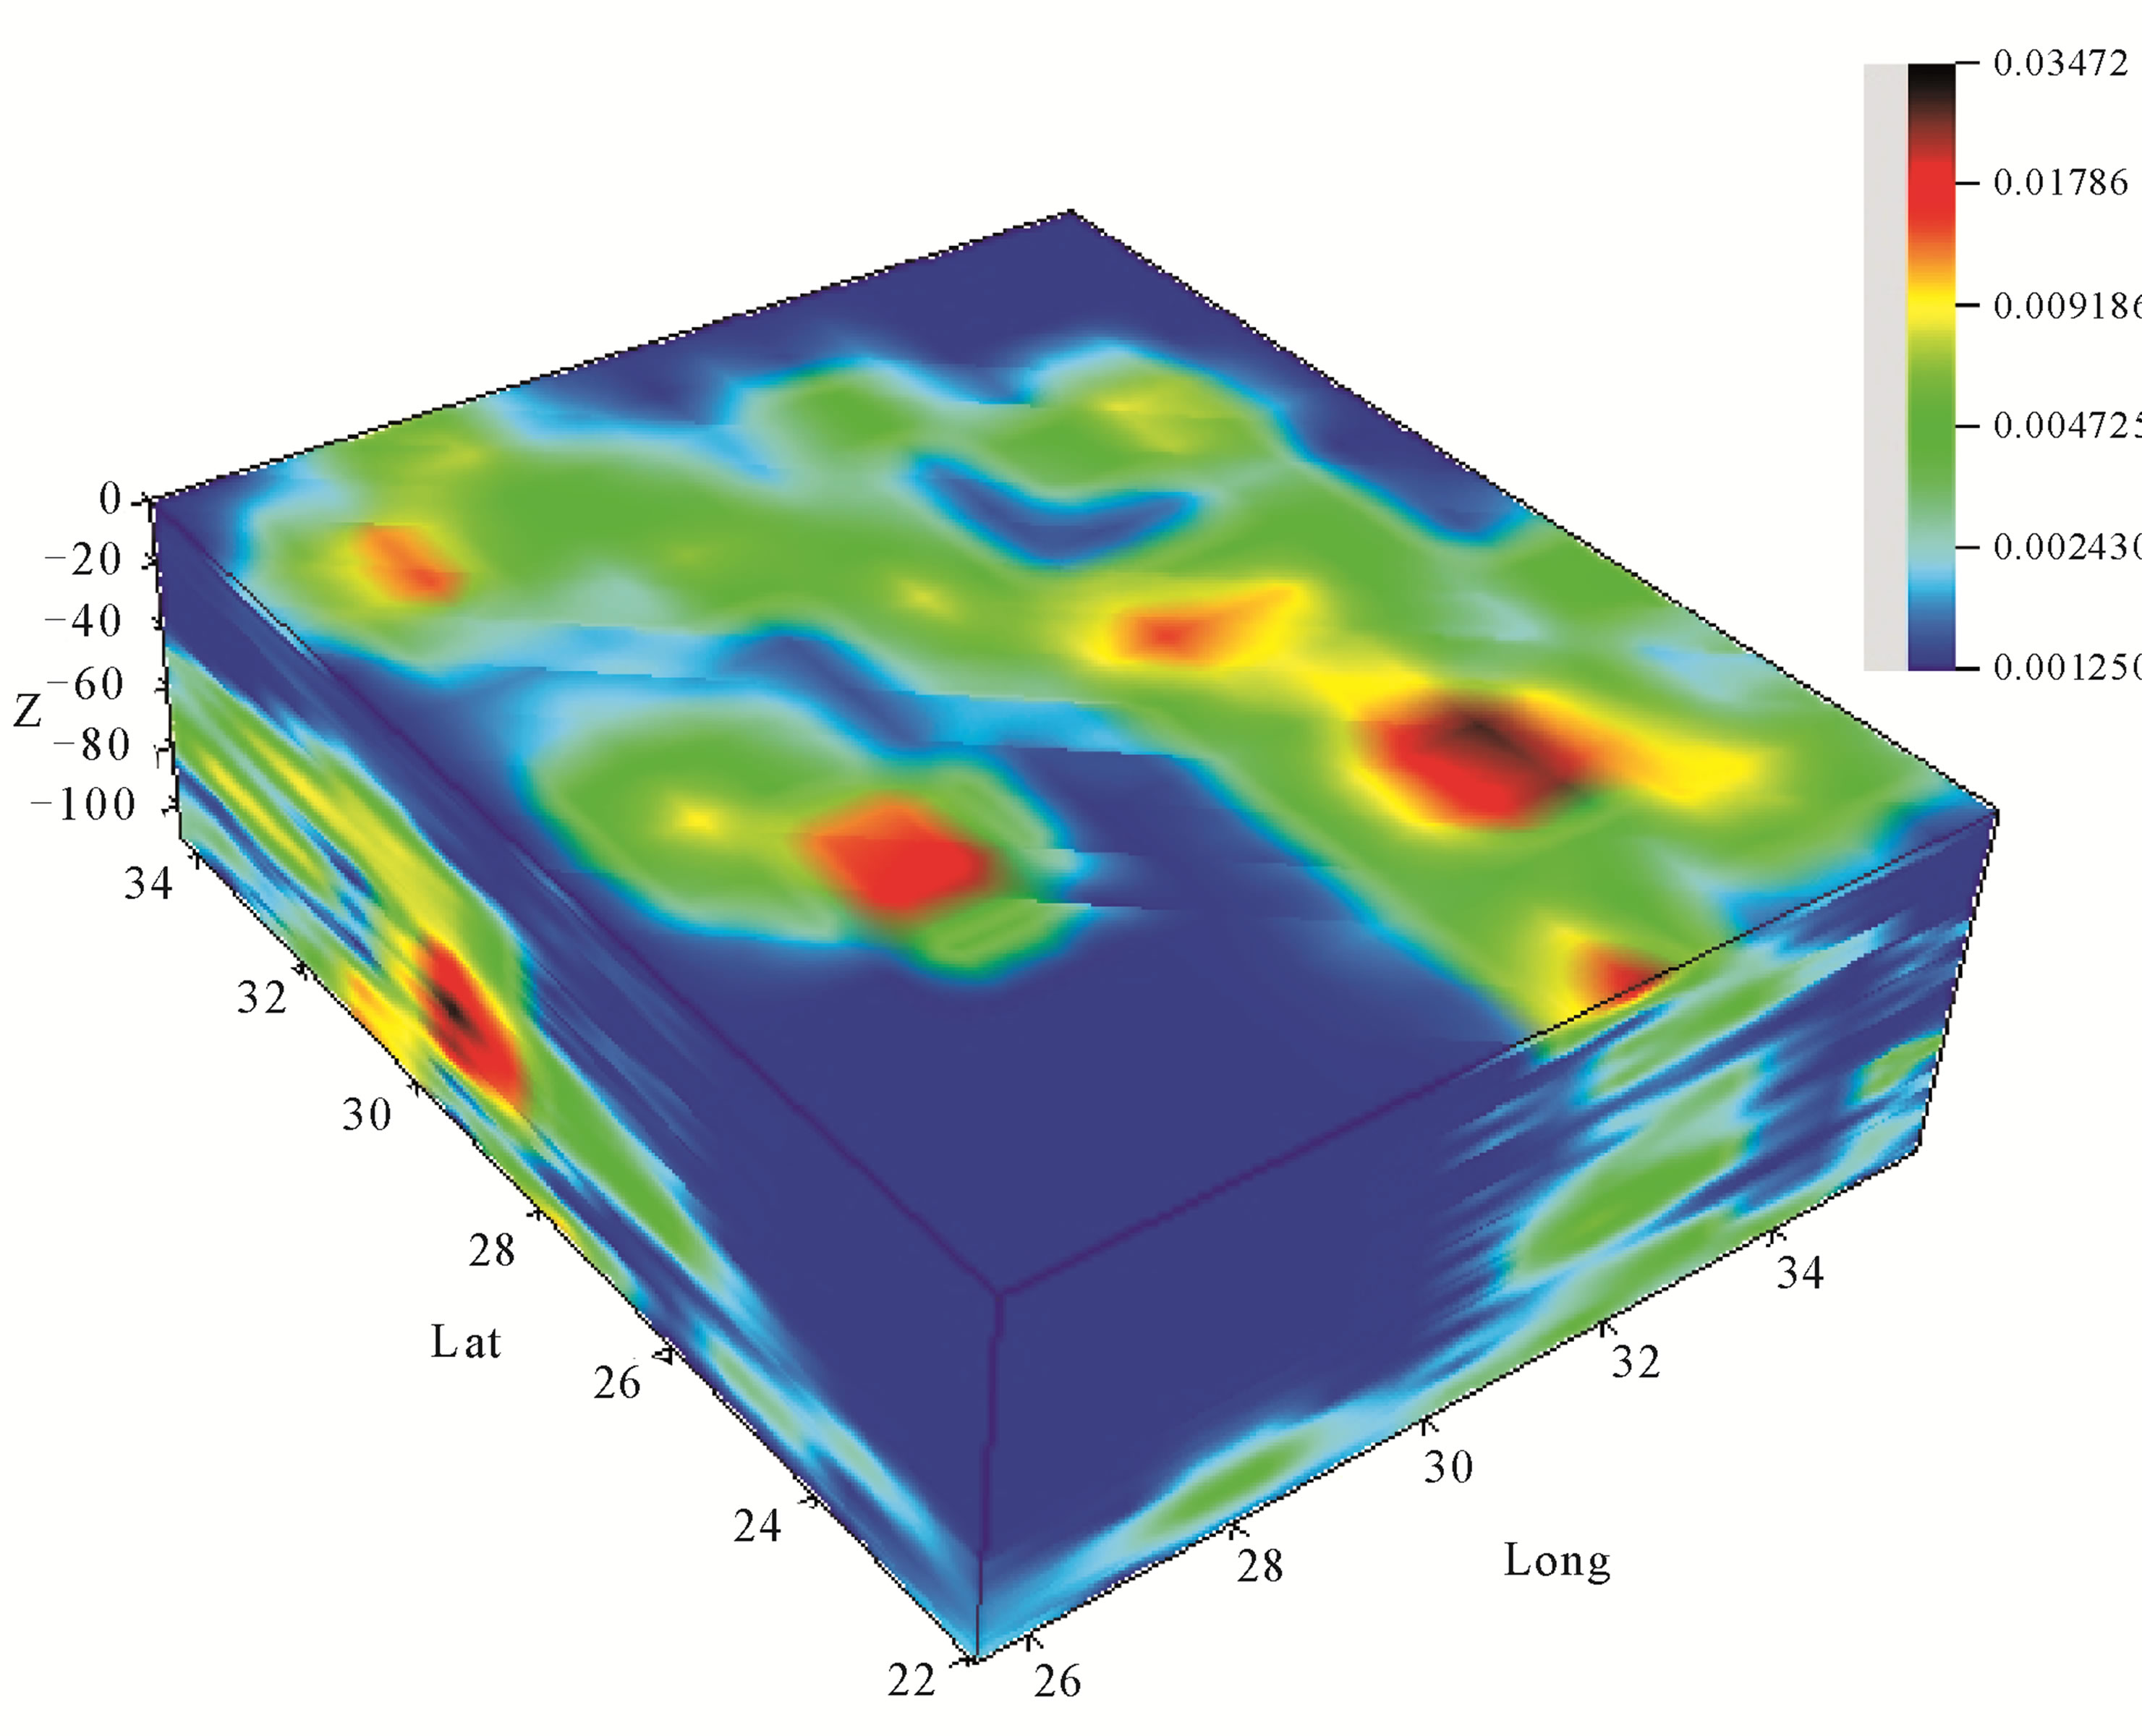
Figure 15. Distribution of Qc values in depth for frequency 18 Hz.


Figure 16. Distribution of Qc values in depth for frequency 24 Hz.
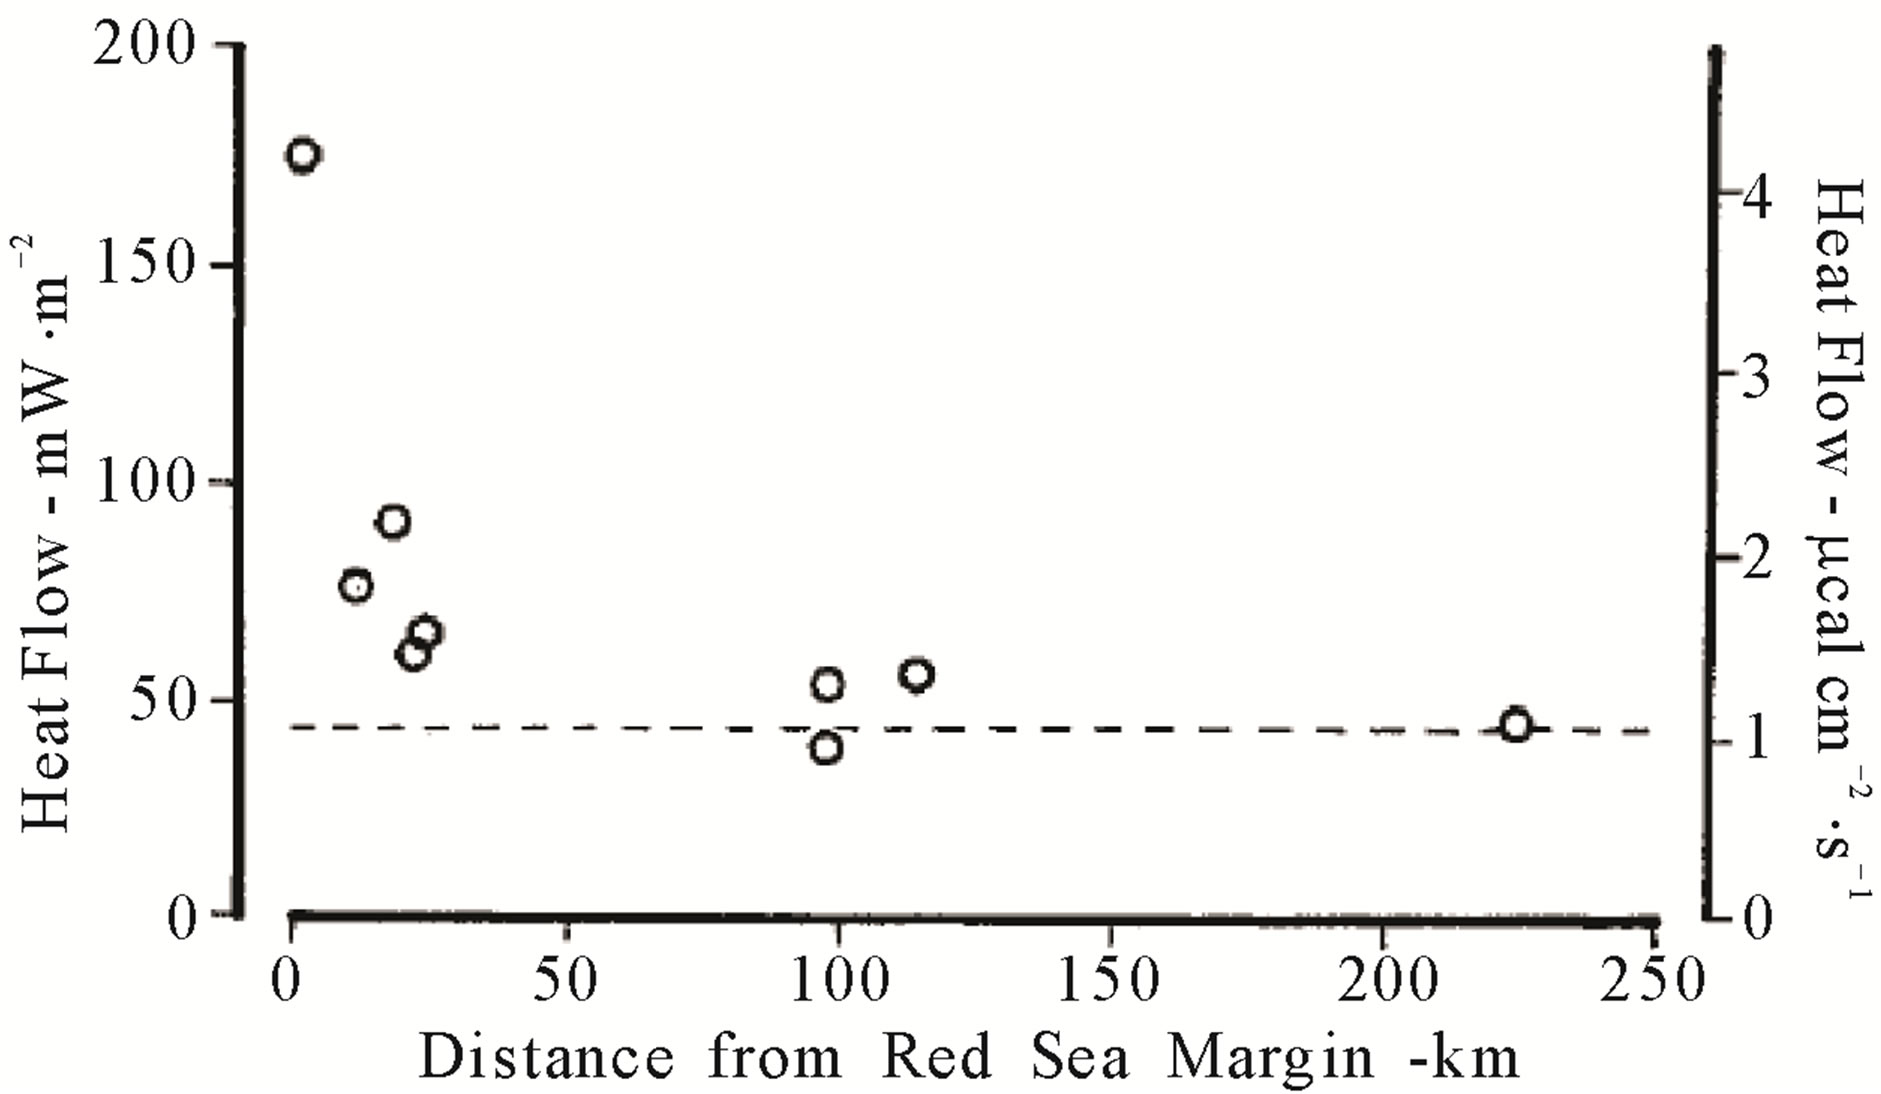
Figure 17. Heat flow data from Table 2 plotted as a function of distance from the Red Sea Coast [31].
the attenuation levels dependent frequency at different depths in different zones of Egypt. An extended highest  was detected, at lower central frequency 1.5 Hz, in the North Red Sea, Dead Sea, North East and North West Mediterranean Sea of Egypt. On the other hand, the lowest
  was detected in the western part of Egypt. With increasing frequency the highest
  zones become reduced with increasing frequency to disappear at frequencies 9, 12 and 15 Hz where the moderate and low
  are dominant. At 18 Hz the highest
  appears again to move at new zones of west Red Sea and Siwa Oasis in the North Wes Egypt. Finally at 24 Hz the highest
  disappeared again to detect only at East of Suez Gulf.
To validate the attenuation inversion results, a remarkable high contrast in the attenuation levels was compared with the tectonic structures in Figure 2, geothermal gradient in Table 1 and heat flow in Table 2. Generally the high attenuation contrasts are concentrated in the Eastern Egypt and north western offshore region that draw a good matching with the seismic map of Egypt in Figure 2. It has been noted that the highest attenuation levels at 1.5 Hz (Figure 9) were detected at Gulf of Suez and Abu-Dbab seismic zones (zones 1 and 6, Figure 2) where there is highest geothermal gradient (Table 1) and heat flow (Table 2).This highest attenuation decreased gradually to the west until to reach the Nile valley that gives a good matching with the heat flow gradient from Red Sea cost to the Nile valley as shown in Figure 17. A smaller attenuation levels was detected with young sediments of the Nile Valley from South to the northern triangle of Nile Delta basin except seismic active areas. Low or normal attenuation was detected at western desert where there is a stable and simple shelf.
We can conclude that the extended highest attenuation joins to the strong seismic sources and geothermal structures at lower frequency and the centralized high attenuation takes place at moderate seismic sources at a higher frequency. The 3D attenuation maps can draw not only tectonic and geothermal structures but also the general geologic structure map.
6. CONCLUSIONS
The 3D attenuation  seismic tomography beneath Egypt was estimated by means of the inversion technique of coda waves. For the inversion, coda wave attenuation (
 ) was obtained using the single scattering theory for the central frequencies of interest laid between 1 and 24 Hz. A regionalization of the estimated
  values was performed by means of a generalized inversion technique based on the work of [18]. The data consists of 397 waveform earthquakes recorded by 63 seismic stations of ENSN. The obtained spatial distribution of attenuation reveals significant contrasts between East and West Egypt. A remarkable contrast in the attenuation levels was compared with the tectonic structures, geothermal gradient and heat flow features. The highest attenuations are concentrated in the east and north western offshore regions at central frequency 1.5 Hz that draw a good matching with the seismicity thermal features of Egypt. Smaller attenuation levels were detected with young sediments of the Nile Valley from South to the northern triangle of Nile Delta basin except seismic active areas. Low or normal attenuation was detected at western desert where there is a stable and simple shelf. We can infer that the 3D attenuation maps can draw not only tectonic and geothermal structures, but also the general geologic structure map. In future, attenuation tomography maps probably can be used to delineate the active and non-active faults.
7. ACKNOWLEDGEMENTS
This work was done using earthquake records from Egyptian National Seismic Network (ENSN) operated by Seismology Department, National Research Institute of Astronomy & Geophysics, Egypt. We are grateful to Dr. Ali K. Abdel-Fatah for his support and suggestions to achieve this work.
REFERENCES
- Frankel, A. (1990) Attenuation of high-frequency shear waves in the crust: Measurements from New York State, South Africa, and Southern California. Journal of geophysical research, 95, 17441-17457. doi:10.1029/JB095iB11p17441
- Baker, G.E., Stevens, J. and Xu, H.M. (2004) Lg group velocity: A depth discriminant revisited. Bulletin of the Seismological Society of America, 94, 722-739. doi:10.1785/0120000286
- Mayeda, K., Hofstetter, A., O’Boyle, J.L. and Walter, W.R. (2003) Stable and transportable regional magnitudes based on coda-derived momentrate spectra. Bulletin of the Seismological Society of America, 93, 224-239. doi:10.1785/0120020020
- Taylor, S., Velasco, A., Hartse, H., Philips, W.S., Walter, W.R. and Rodgers, A. (2002) Amplitude corrections for regional discrimination. Pure and Applied Geophysics, 159, 623-650. doi:10.1007/s00024-002-8652-8
- Aki, K. (1969) Analysis of the seismic coda of local earthquakes as scattered waves. Journal of geophysical research, 74, 615-631. doi:10.1029/JB074i002p00615
- Aki, K. and Chouet, B. (1975) Origin of coda waves: source, attenuation and scattering effects. Journal of geophysical research, 80, 615-631. doi:10.1029/JB080i023p03322
- Chen, X. and Aki, K. (1991) General coherence functions for amplitude and phase fluctuations in a randomly heterogeneous medium. Geophysical Journal International, 105, 155-162. doi:10.1111/j.1365-246X.1991.tb03451.x
- Frankel, A. and Wennerberg, L. (1987) Energy-flux model of seismic coda: Separation of scattering and intrinsic attenuation. Bulletin of the Seismological Society of America, 77, 1223-1251.
- Hoshiba, M. (1991) Simulation of multiple scattered coda wave excitation based on the energy conservation law. Physics of the Earth and Planetary Interiors, 67, 123-136. doi:10.1016/0031-9201(91)90066-Q
- Matsunami, K. (1991) Laboratory tests of excitation and attenuation of coda waves using 2-D models of sacattering media. Physics of the Earth and Planetary Interiors, 67, 36-47. doi:10.1016/0031-9201(91)90058-P
- Vargas, C.A., Ugalde, A., Pujades, L. And Canas, J. (2004) Spatial variation of coda wave attenuation in northwestern Colombia. Geophysical Journal International, 158, 609-624. doi:10.1111/j.1365-246X.2004.02307.x
- Singh, S. and Herrmann, R.B. (1983) Regionalization of crustal coda Q in the continental United States. Journal of geophysical research, 88, 527-538. doi:10.1029/JB088iB01p00527
- Jin, A. and Aki, K. (1988) Spatial and temporal correlation between coda Q and seismicity in China. Bulletin of the Seismological Society of America, 78, 741-769.
- Mamdouh, A., Marzouk, I., Maher, M. and El-Rayes, M. (2008) An evidence of neotectonics in Sinai Peninsula, Egypt. NRIAG Journal of Geophysics, Special Issue, 1-20.
- Mamdouh, A. and Fergany, E. (2009) Coda-wave attenuation study in North Egypt using Mediterranean earthquakes. NRIAG Journal of Geophysics, Special Issue, 67-82.
- Mamdouh, A., Sherif, E., Salah, M. and Enayat, A. (2011) Lateral variations of coda Q and attenuation of seismicwaves in the Gulf of Suez, Egypt. Arabian Journal of Geosciences, 1-11. doi:10.1007/s12517-011-0302-y
- Sato, H. (1977) Energy propagation including scattering effects single isotropic scattering approximation. Journal of Physics of the Earth, 25, 27-41. doi:10.4294/jpe1952.25.27
- Malin, P.E. (1978) A first order scattering solution for modeling lunar and terretrial seismic coda. Ph.D. Thesis, Princeton University, Princeton.
- McKenzie, D.P. (1972) Active tectonics of the Mediterranean region. Geophysical Journal of the Royal Astronomical Society, 30, 109-158.
- Makris, J. (1976) A dynamic model of the Hellenic arc deduced from geophysical data. Tectonophysics, 36, 339-346. doi:10.1016/0040-1951(76)90108-6
- Le Pichon, X., Augustithis, S.S. and Mascle, J. (1982) Geodynamics of the hellenic arc and trench. Tectonophysics, 86.
- Egyptian Geological Survey and Mining Authority (1981) Geologic map of Egypt 1:2000000. EGSMA, Cairo.
- Sofratome Group (1984) El-Daba nuclear power plant, NPPA. Ministry of Electricity, Cairo.
- Salamon, A., Hofstetter, A., Garfunkel, Z. and Ron, H. (1996) Seismicity of the eastern Mediterranean region: perspective from the Sinai subplate. Tectonophysics, 263, 293-305. doi:10.1016/S0040-1951(96)00030-3
- Riad, S. and Meyers, H. (1985) Earthquake catalog for the Middle East Countries 1900-1983. World Data Center for Solid Earth Geophysics, Rep. SE-40, National Oceanic and Atmospheric Administration (NOAA), US Department of Commerce, Boulder.
- Muffler, L.P.J. (1976) Tectonic and hydrologic control of the nature and distribution of geothermal resources. Proceedings of Second U.N. Symposium on the Development and Use of Geothermal Resources, 1, 499-507.
- United Nations (1976). Present status of world geothermal development. Proceedings of Second United Nations Symposium of the Development and Use of Geothermal Resources, 1, pp. 3-9.
- Le Pichon, X., Francheteau, J. and Bonnin, J. (1973) Plate tectonics. Elsevier Scientific Pub. Co., Amsterdam, 300.
- AbouElenean, K.M. (1997) A study on the seismotectonics of Egypt in relation to the Mediterranean and Red Seas tectonics. Ph.D. Thesis, Ain Shams University, Cairo.
- AbouElenean, K. and Hussein, H. (2007) Source mechanism and source parameters of May 28, 1998 earthquake, Egypt. Journal of Seismology, 11, 259-274. doi:10.1007/s10950-007-9051-5 Morgan, P. and Swanberg, C.A. (1979) Heat flow and the geothermal potential of Egypt. Pure and Applied Geophysics, 117, 213-226. doi:10.1007/BF00879748
- Ibáñez, J.J., Jiménez-Ballesta, R. and García-Alvarez, A. (1990) Soil landscapes and drainage basins in Mediterranean mountain areas. Catena, 17, 573-583.
- Pulli, J.J. (1984) Attenuation of coda waves in New England. Bulletin of the Seismological Society of America, 74, 1149-1166.
- Crosson, R.S. (1976) Crustal structure modeling of earthquake data 1. simultaneous least squares estimation of hypocenter and velocity partameters. Journal of geophysical research, 81, 3036-3046. doi:10.1029/JB081i017p03036