Natural Science
Vol.4 No.5(2012), Article ID:19114,10 pages DOI:10.4236/ns.2012.45040
Effect of external electric field upon charge distribution, energy and dipole moment of selected monosaccharide molecules
![]()
1Department of Chemistry and Physics, University of Agriculture, Cracow, Poland; *Corresponding Author: rrtomasi@cyf-kr.edu.pl
2Cracow College of the Health Promotion, Cracow, Poland
Received 26 January 2012; revised 20 February 2012; accepted 10 March 2012
Keywords: D-Fructose; Dipole Moments; D-Galactose; D-Glucose; Polarizabilty; D-Ribose; D-Xylose
ABSTRACT
External electric field of 0.001, 0.01 and 0.05 a.u. changes distribution of the electron density in α- and β-D-glucose, α- and β-D-galactose, α- and β-fructopyranoses and α- and β-fructofuranoses, α- and β-D-ribofuranoses and α and β-D-xylofuranoses. Hyper-Chem 8.0 software was used together with the AM1 method for optimization of the conformation of the molecules of monosaccharides under study. Then polarizability, charge distribution, potential and dipole moment for molecules placed in the external electric field of 0.000, 0.001, 0.01 and 0.05 a.u. were calculated involving DFT 3-21G method. Application of the external field induced polarizability of electrons, atoms and dipoles, the latter resulting in eventual reorientation of the molecules along the applied field of the molecules and the electron density redistribution at particular atoms. Increase in the field strength generated mostly irregular changes of the electron densities at particular atoms of the molecules as well as polarizabilities. Energy of these molecules and their dipole moments also varied with the strength of the field applied. Results of computations imply that saccharides present in the living organisms may participate in the response of the living organisms to the external electric field affecting metabolism of the molecules in the body fluids by fitting molecules to the enzymes. Structural changes of saccharide components of the membranes can influence the membrane permeability.
1. INTRODUCTION
Every material object is surrounded by an electromagnetic field. In case of unanimated objects that field results from well known effect of the surface [1]. It is responsible, for instance, for catalytic properties of heterogenous catalysts. The origin of such field around animated objects is more complex [2-5]. The field induces a plasma which can be seen in a “native” state solely by some people who frequently combine this ability with therapy involving biofield, so-called bioenergothrapeutics. Perception of those people likely involves a beyond sensory way. There are attempts of visualization of that “native” plasma by independent physical methods. Commonly, gas discharge visualization (GDV) of such plasma under a high voltage gradient is applied but such evidence for the existence of the plasma [5,6] is controversial. It is not clear whether “native” plasma and that induced in a Kirlian manner (the GDV photography) differ from one another solely in the concentration of excited species.
In our former paper [7] the effect of the gradient of potential upon the UV absorption spectra of simple inorganic molecules e.g. N2, O2, H2O, CO2, CO2-H2O, NH3 and NH3-H2O was presented. Numerically calculated spectral changes were non-proportional to applied onedirection electric field varying between 0.005 and 0.1 a.u. (1 a.u. = 1.49 × 10⁻¹⁰ J = 931 MeV). The changes depended also on intermolecular object-object interactions and, therefore, they were influenced by a number of molecules populating considered molecular system. Visualization of the isosurface of those molecules documented changes in the distribution of the electron density and, hence, the dipole moment and mutual intermolecular interactions including conditions of hydration of CO2 and NH3.
Effect of the gradient of potential upon animate objects is also well known but the nature of these interactions is not well understood [8-10]. This paper contributes to this problem presenting results of the computations of the charge distribution, potential and dipole moment for the biologically important molecules of α- and β-gluco-(Glcp), galacto-(Galp) and fructopyranoses (Frup), and α- and β-fructo-(Fruf), ribo-(Ribf) and xylofuranoses (Xylf) all exposed to external electric field of 0.001, 0.01 and 0.05 a.u.
2. COMPUTATIONS
HyperChem 8.0 software was used together with the AM1 method for optimization of the conformation of the molecules of monosaccharides under study. Then polarizability, charge distribution, potential and dipole moment for molecules placed in the external electric field of 0.000, 0.001, 0.01 and 0.05 a.u. were calculated involving DFT 3-21G method. For the computations of the polarizability field of 10–10 a.u. has to be adapted as the no field condition. In the computations of polarizability, every molecule was oriented against the external electric field in an identical manner.
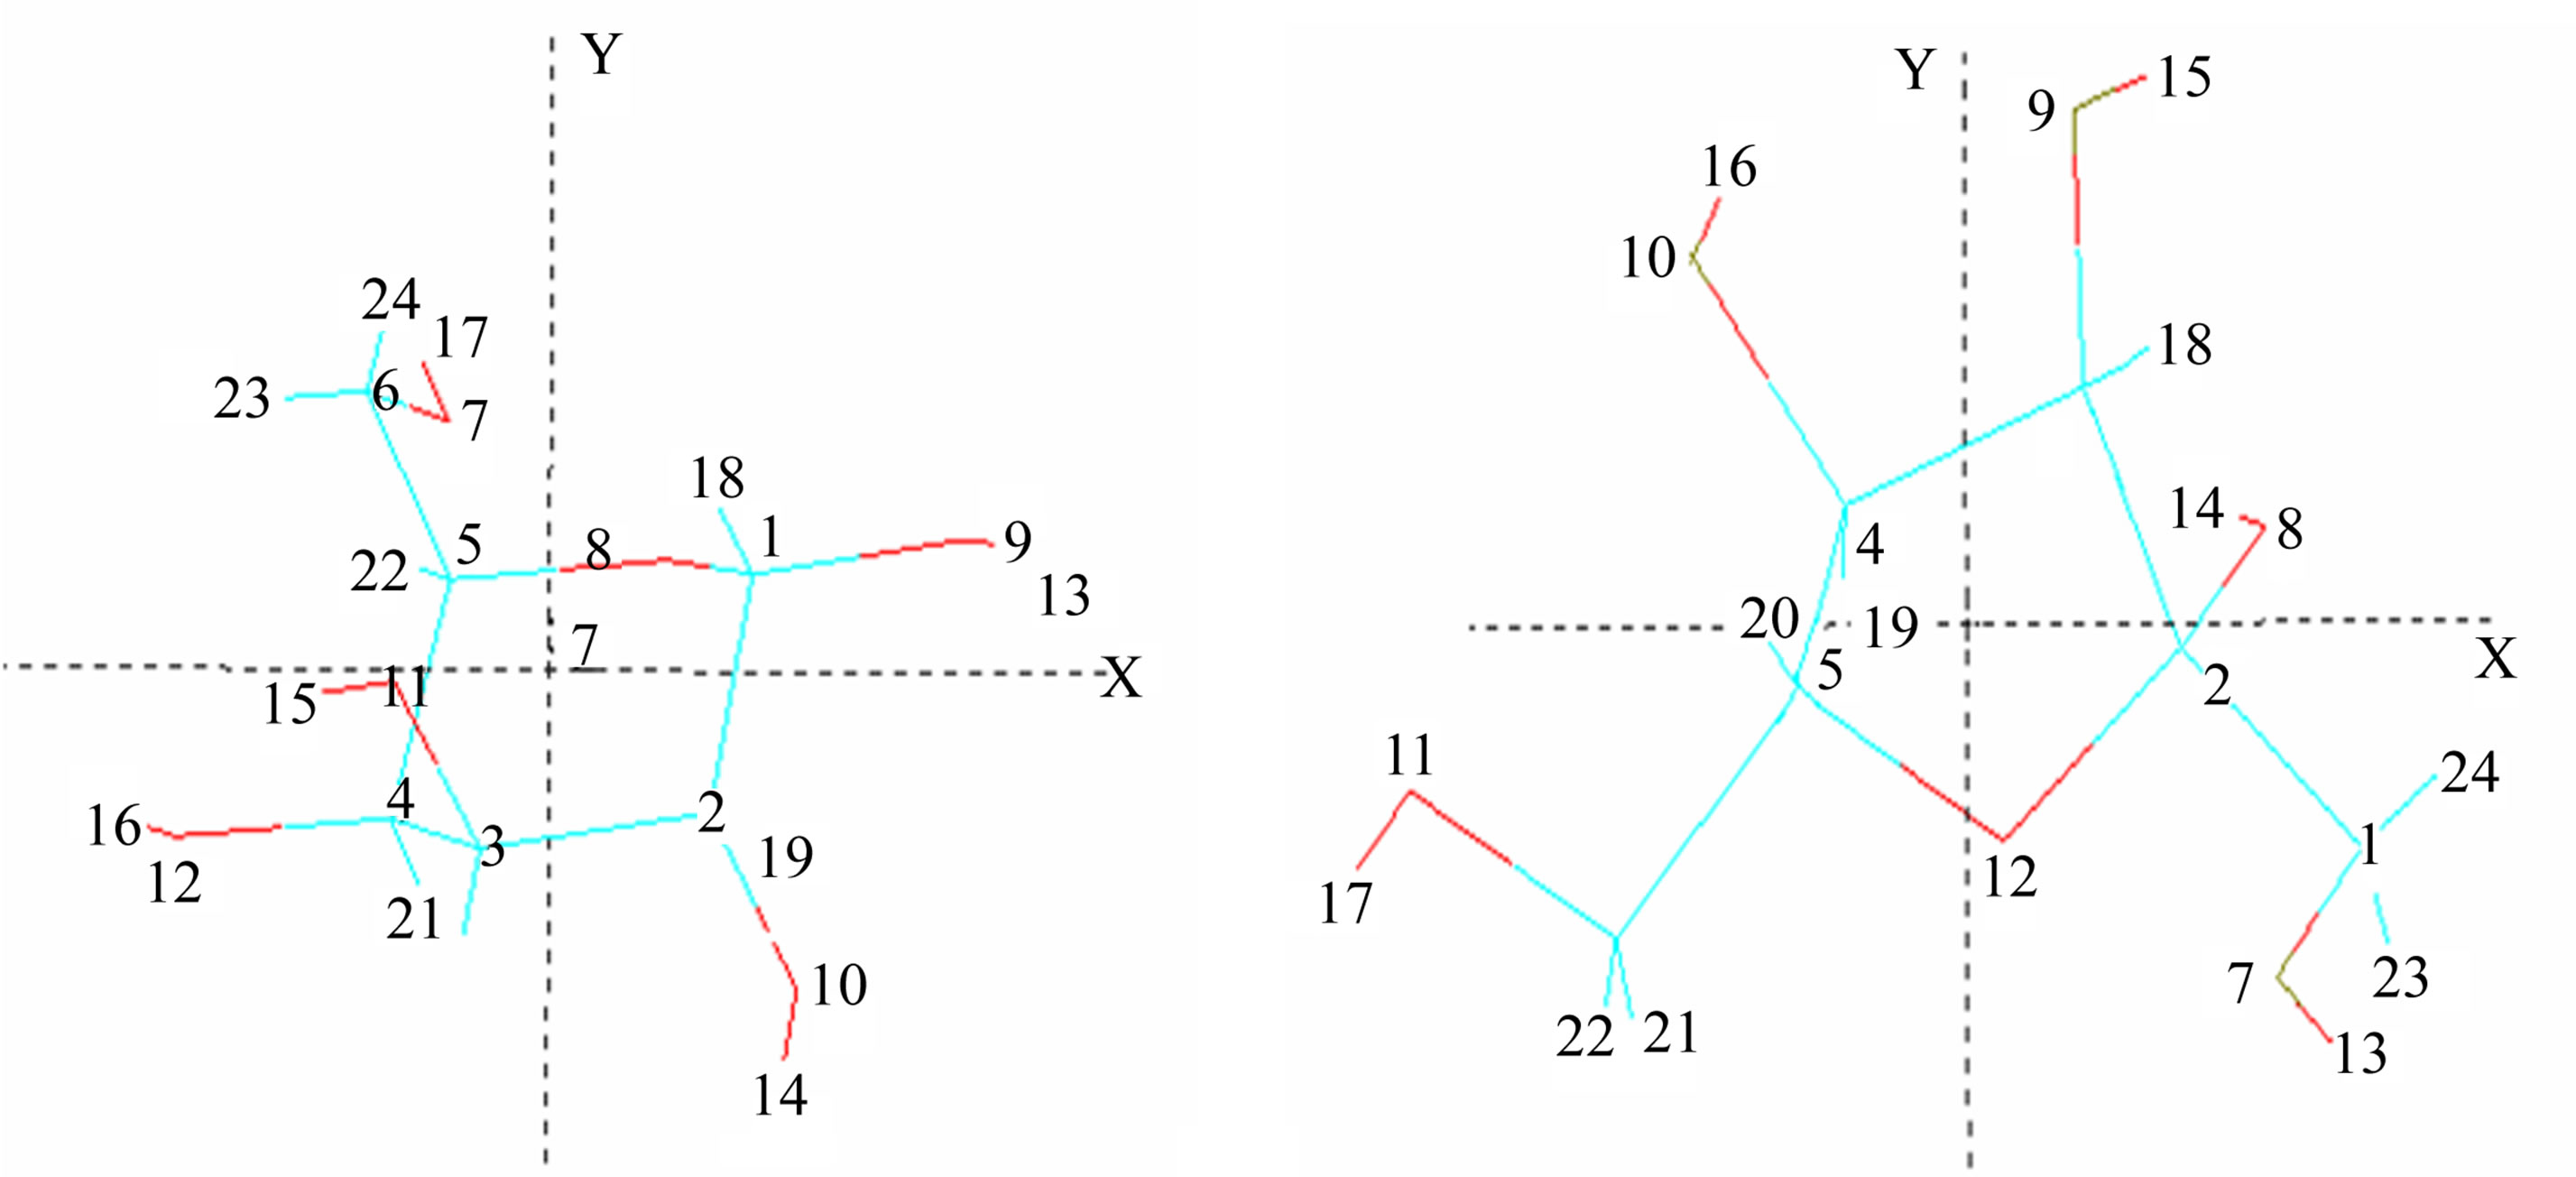
Structures (a)-(c) (Figure 1) present numbering of the atoms applied in the computations and applied their orientation in the Cartesian system.
3. RESULTS AND DISCUSSION
An increase in the strength of external electric field, except some particular cases, decreased energy of the molecules and increased their dipole moments (Table 1).
Without field applied α-isomers are more stable than β-isomers. The 0.001 a.u. electric field has either none or negligible effect upon stability of the molecules. The sensitivity of particular molecules to increasing field strength is diverse. In contrast to the other molecules, both isomeric D-Galps are fairly insensitive to that field of the strength up to 0.01 a.u. In the 0.05 a.u. all molecules became very labile possibly to a bond cleavage.
As one can see from the inspection of Table 1 energy of α-D-Glcp varies with increase in the energy of the electric field applied in a different manner than in b-DGlcp. That circumstance may offer a control of the equilibrium of the mutarotation by means of the external electric field. It should be underlined that the variation of
 (a)
(a)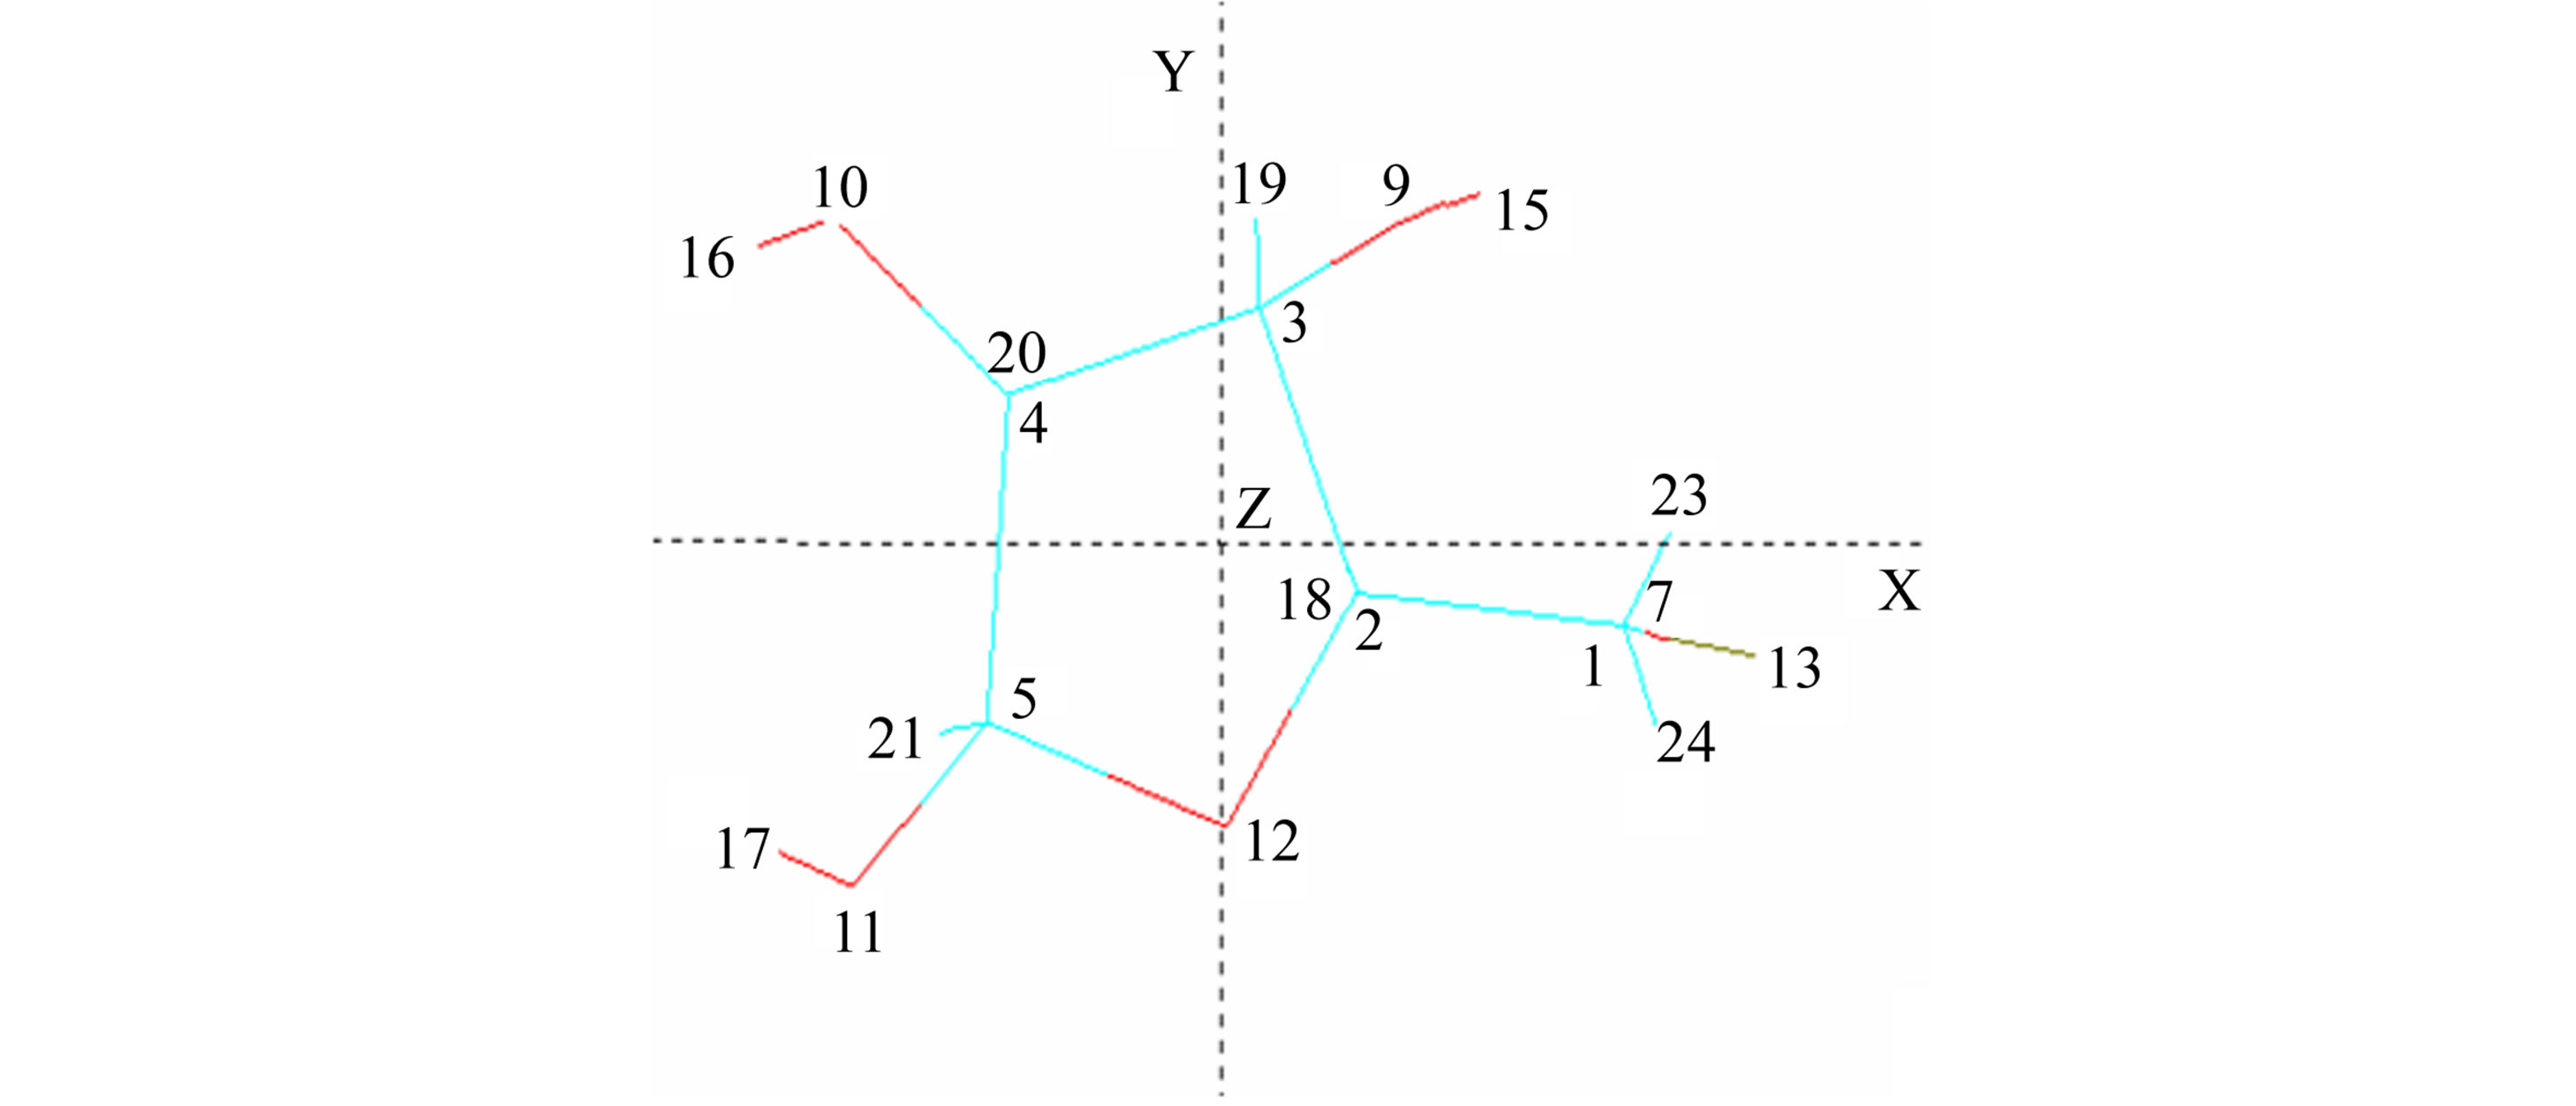 (b)
(b)
Figure 1. Numbering of the atoms applied in the computations and applied orientation in the Cartesian system for α and β-gluco-(Glcp), galacto-(Galp) and fructopyranoses (Frup) (a), α and β-fructo-(Fruf) (b), and ribo-(Ribf) and xylofuranoses (Xylf) (c).
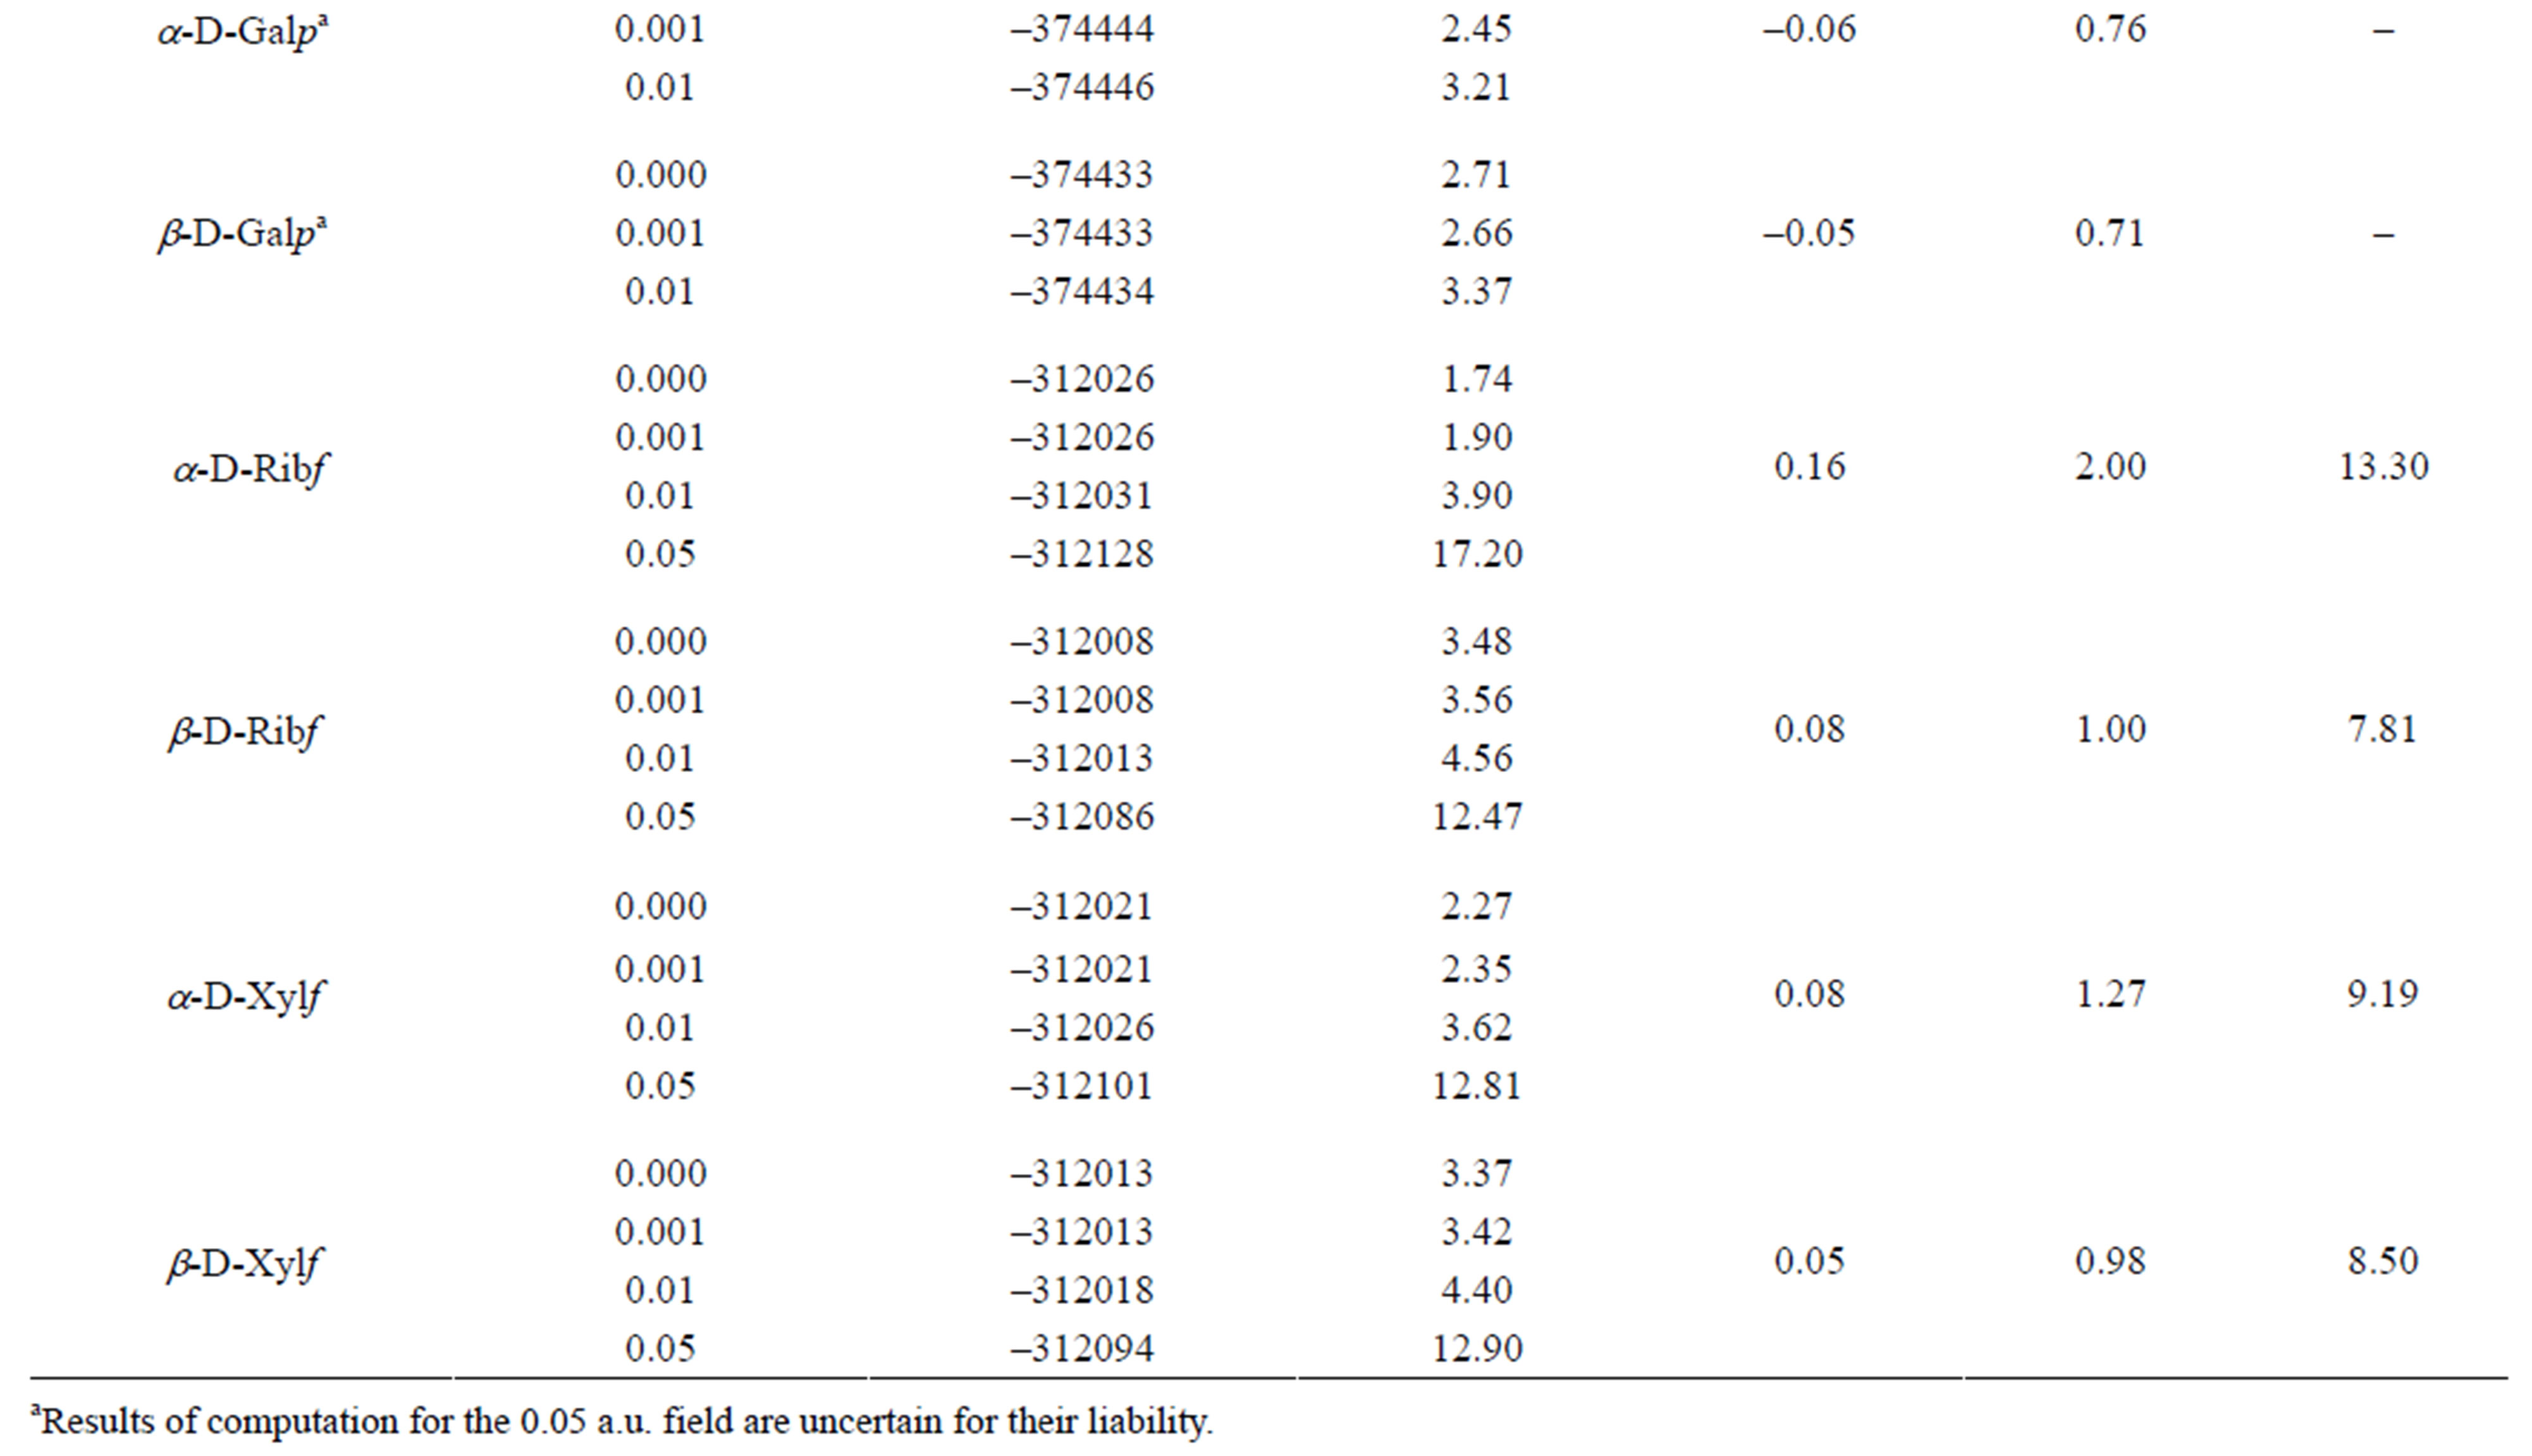
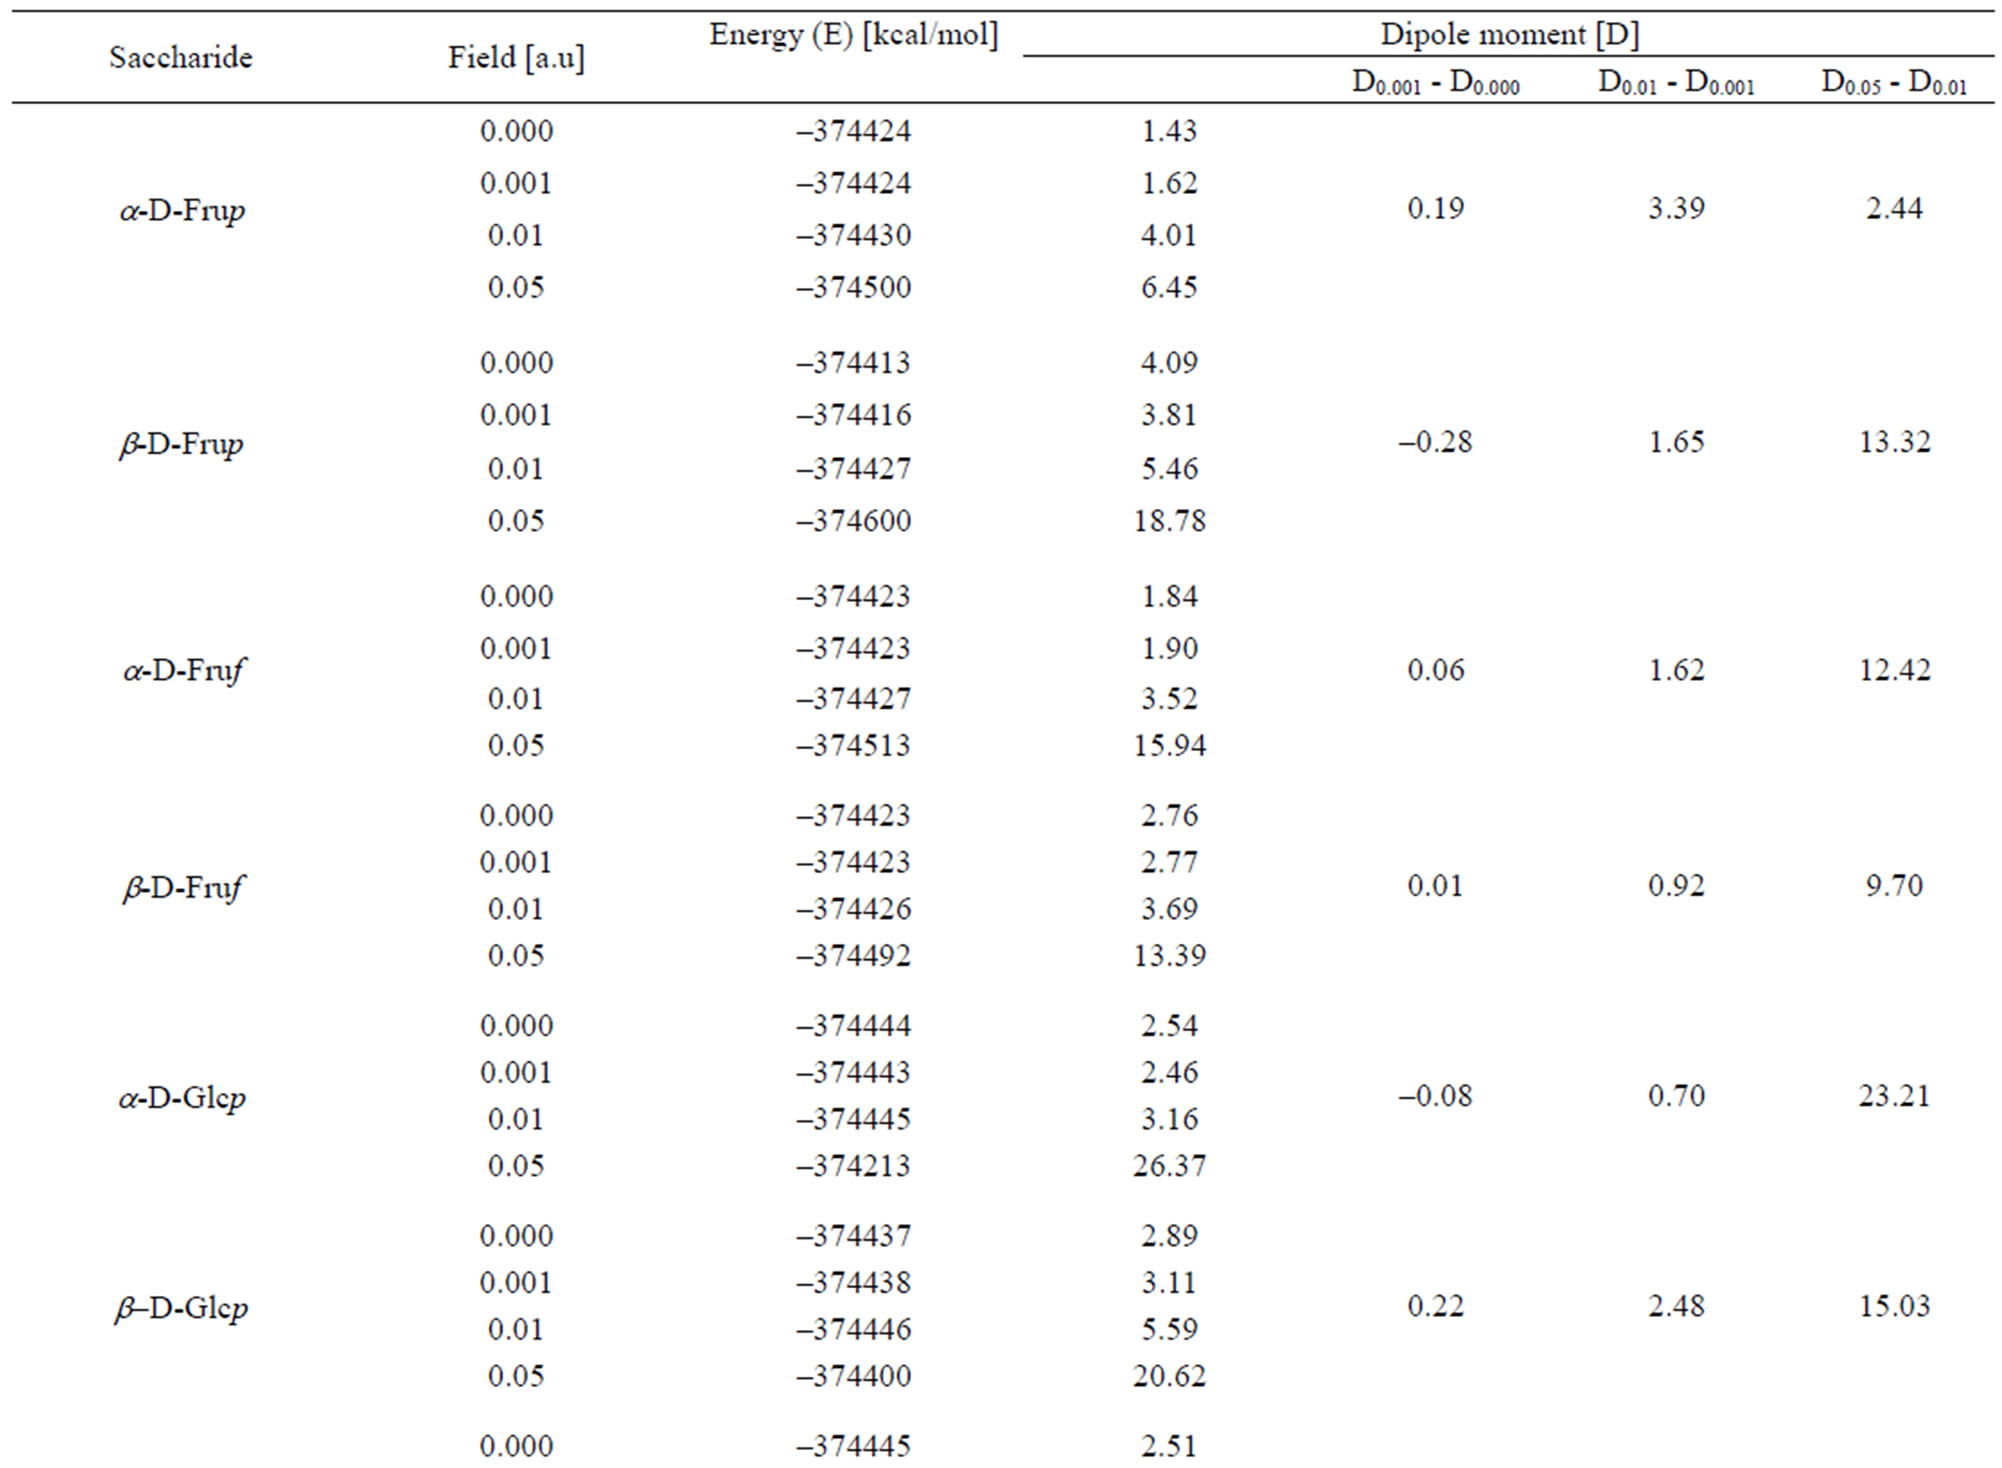
Table 1. Variation of the energy and dipole moment of selected monosaccharides with energy of applied external electric field.
the energy of both conformers is not linear in the energy of the applied field.
The order of decreasing energy of D-fructose conformers without exposure to the external field is α-D-Frup < β-DFruf < α-D-Fruf <β-D-Frup. On exposure to the field this order changes into β-D-Fruf < α-D-Frup < α-D-Fruf < β-D-Frup, α-D-Frup < β-D-Fruf < β-D-Fruf < α-D-Fruf and β-D-Frup < α-D-Frup < α-D-Fruf < β-D-Fruf in the field of 0.001, 0.01 and 0.05 a.u., respectively. Thus, the equilibrium between these conformers [11] can also be controlled in such manner.
Dipole moments of α-conformers are smaller than these of the β-conformers. On application of the 0.001 field dipole moments change slightly but chimerically. They increased with the field strength.
The external field induced polarizability of electrons, atoms and dipoles, the latter resulting in eventual reorientation of the molecules along the applied field of the molecules and the electron density redistribution at particular atoms. That redistribution is available from the computations. Table 2 presents polarizabilities of the saccharides in the external electric field of 0.001, 0.01 and 0.05 a.u. Polarizability of hexoses is higher than that of pentoses and that except Galp β-conformers are more sensitive to increase in the field strength. Increase in the polarizability of the molecules in the 0.05 a.u. field may speak for the reorientation of the molecules against the electric field.
Polarizability is a tensor with nine values related to three axes of the Cartesian system. They compose the average values reported in Table 2. Dipole moments along the x, y and z axes of the system are given in Table 3. For α-D-Frup and α-D-Glcp computations were carried out also for the molecules exposed to the external electric field.
One can see that the application of the 0.001 and 0.01 a.u. field changes mostly DM along the x-axis but stronger field causes also essential changes in DMs along all axes.
The electron density at particular atoms changed on applying the 0.001 a.u field and then 0.01 a.u. field. They varied mostly irregularly as shown in Tables 4-6.
In α-D-Glcp, among all C-atoms, the anomeric C1 atom disposes with the lowest electron density and, in consequence, with the highest positive charge index. The C2 and C5 atoms have even slightly negative indices. The charge index at the pyranose ring O8 is least negative and that at O11 is the most negative. All O-bound hydrogen atoms have positive indices; the highest at H13 and H16, and negative indices at the C-bound hydrogen atoms point to efficient H-C bond polarization. H21 and H23 carry the highest and lowest electron density, respectively.
The 0.001 and 0.01 a.u. external electric field fairly
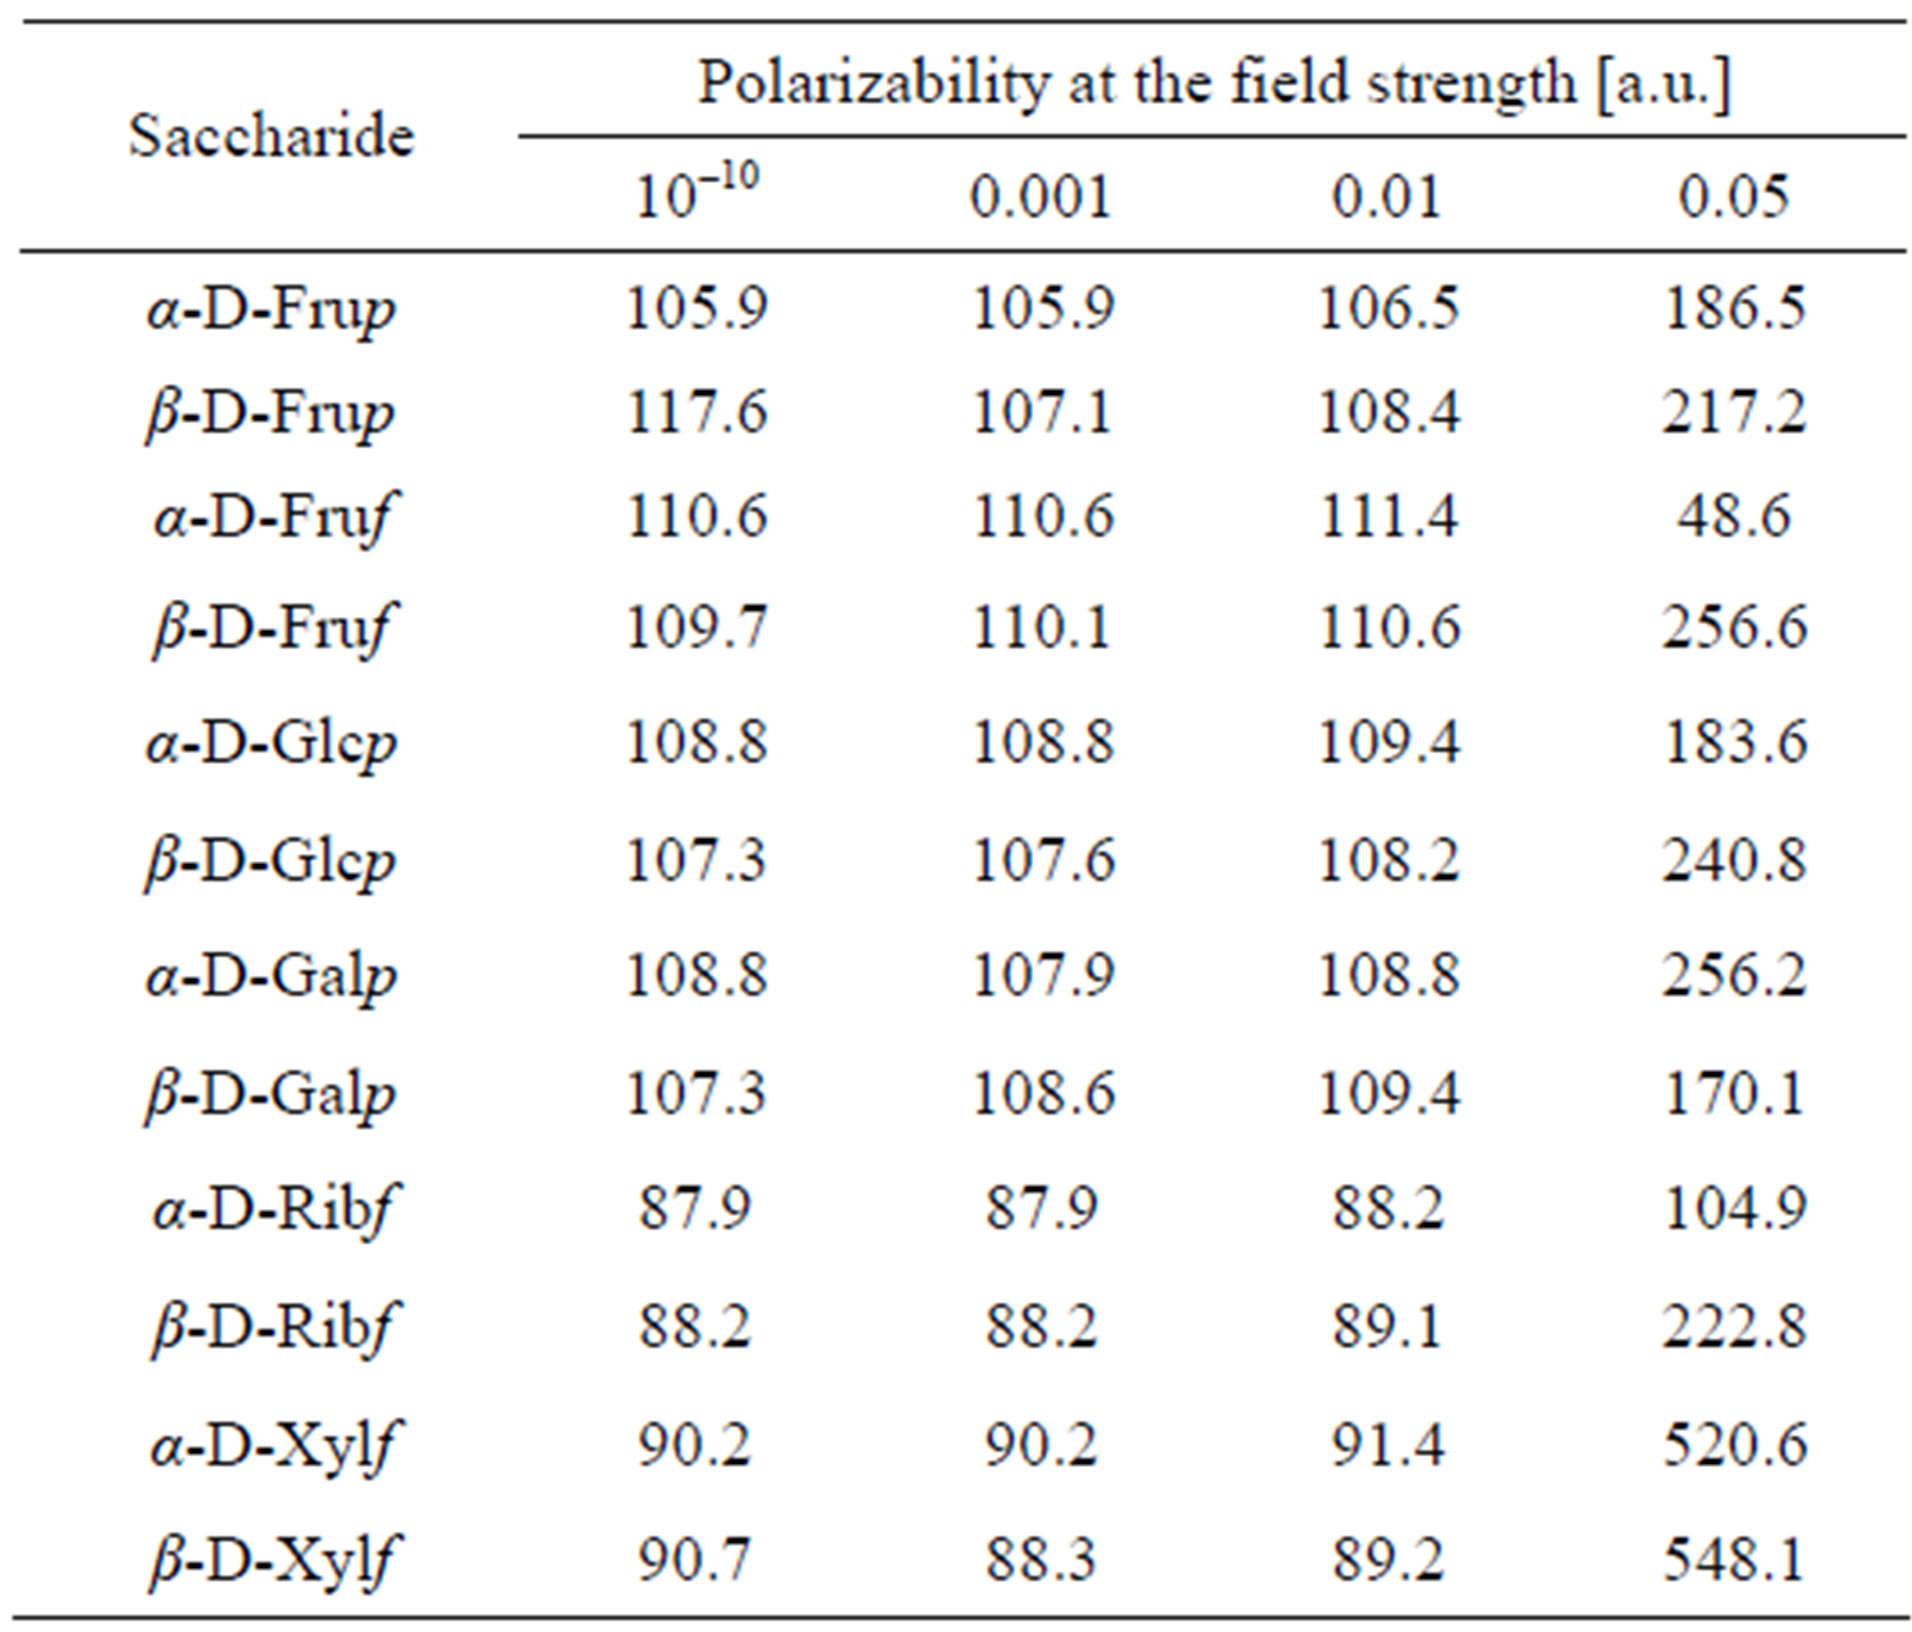
Table 2. Average field strength dependent polarizability of saccharides.
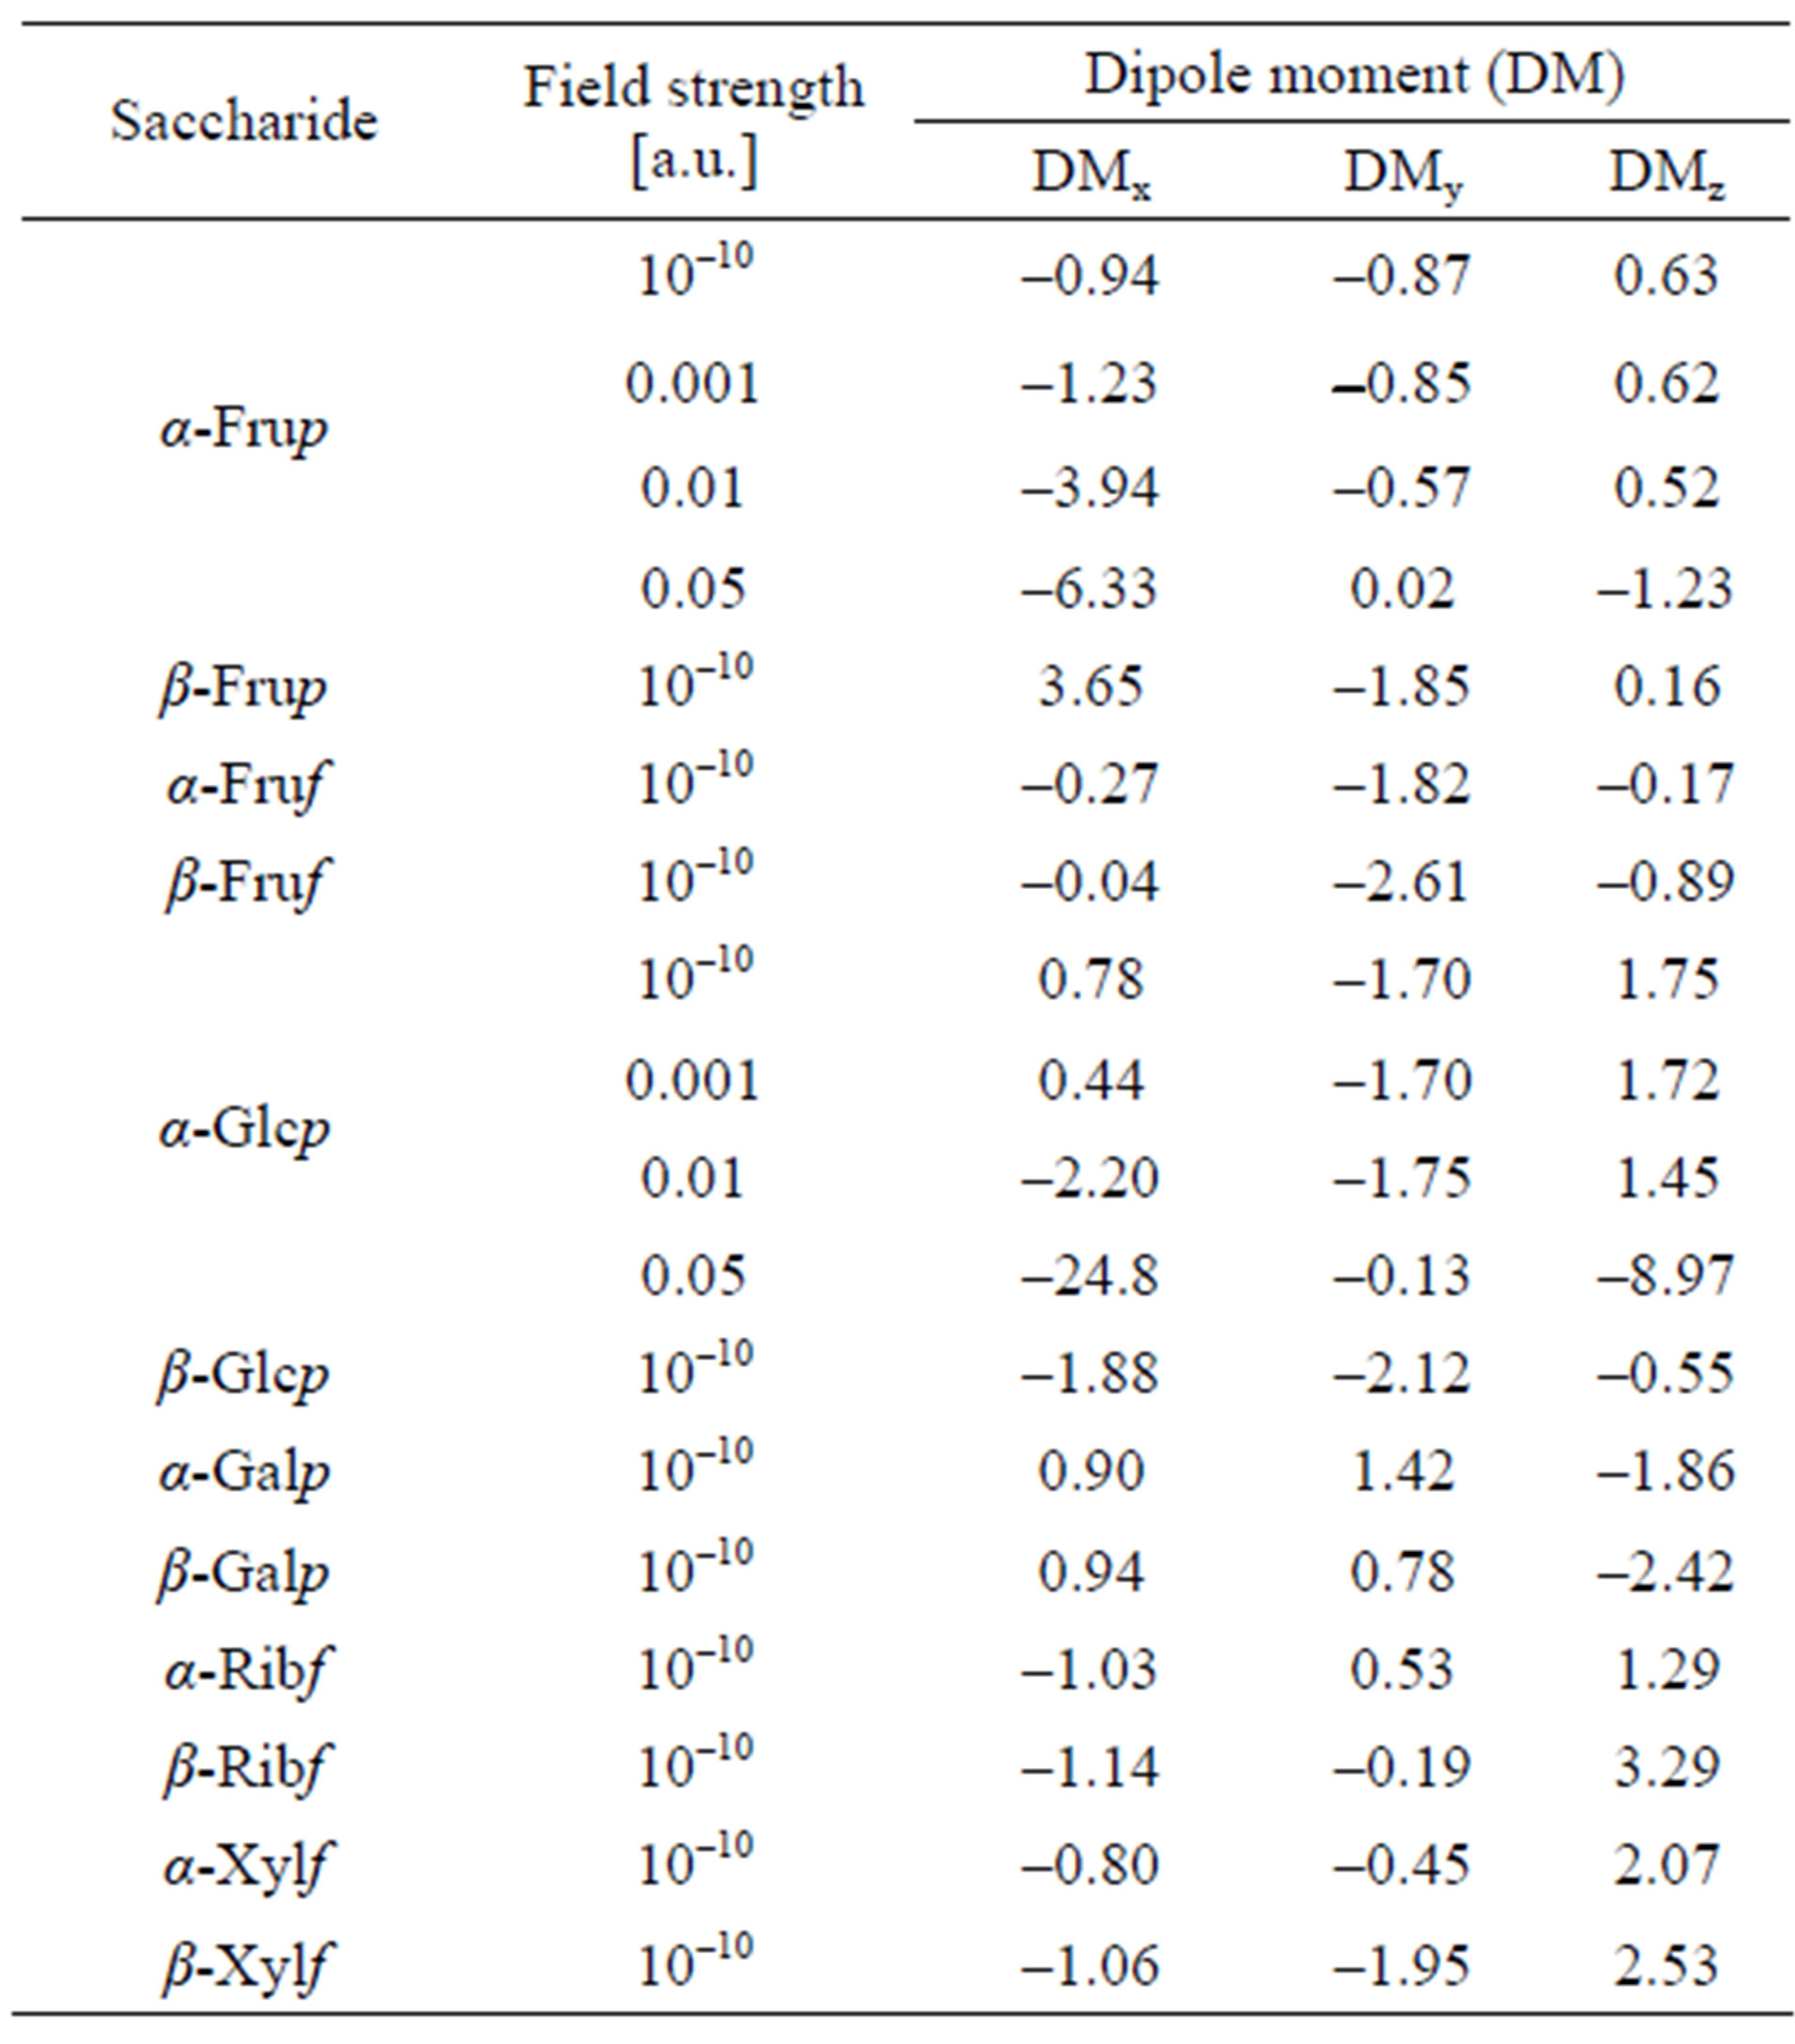
Table 3. Dipole moments of selected monosaccharides oriented along x, y and z axes of the Cartesian system.
regularly reduces charge deficiency at C1 and C3 and excessive electron density at C2. At remained C-atoms the 0.001 a.u. field always reduces electron density and the 0.01 a.u. field acts oppositely, that is, it increases the electron density.
The increase in the strength of the applied field fairly regularly reduces electron density at O10. At the other O-atoms, if the 0.001 a.u. field reduces electron density, the 0.01 a.u. field increases it and, oppositely, if the 0.001 a.u. field increases the electron density, the 0.01
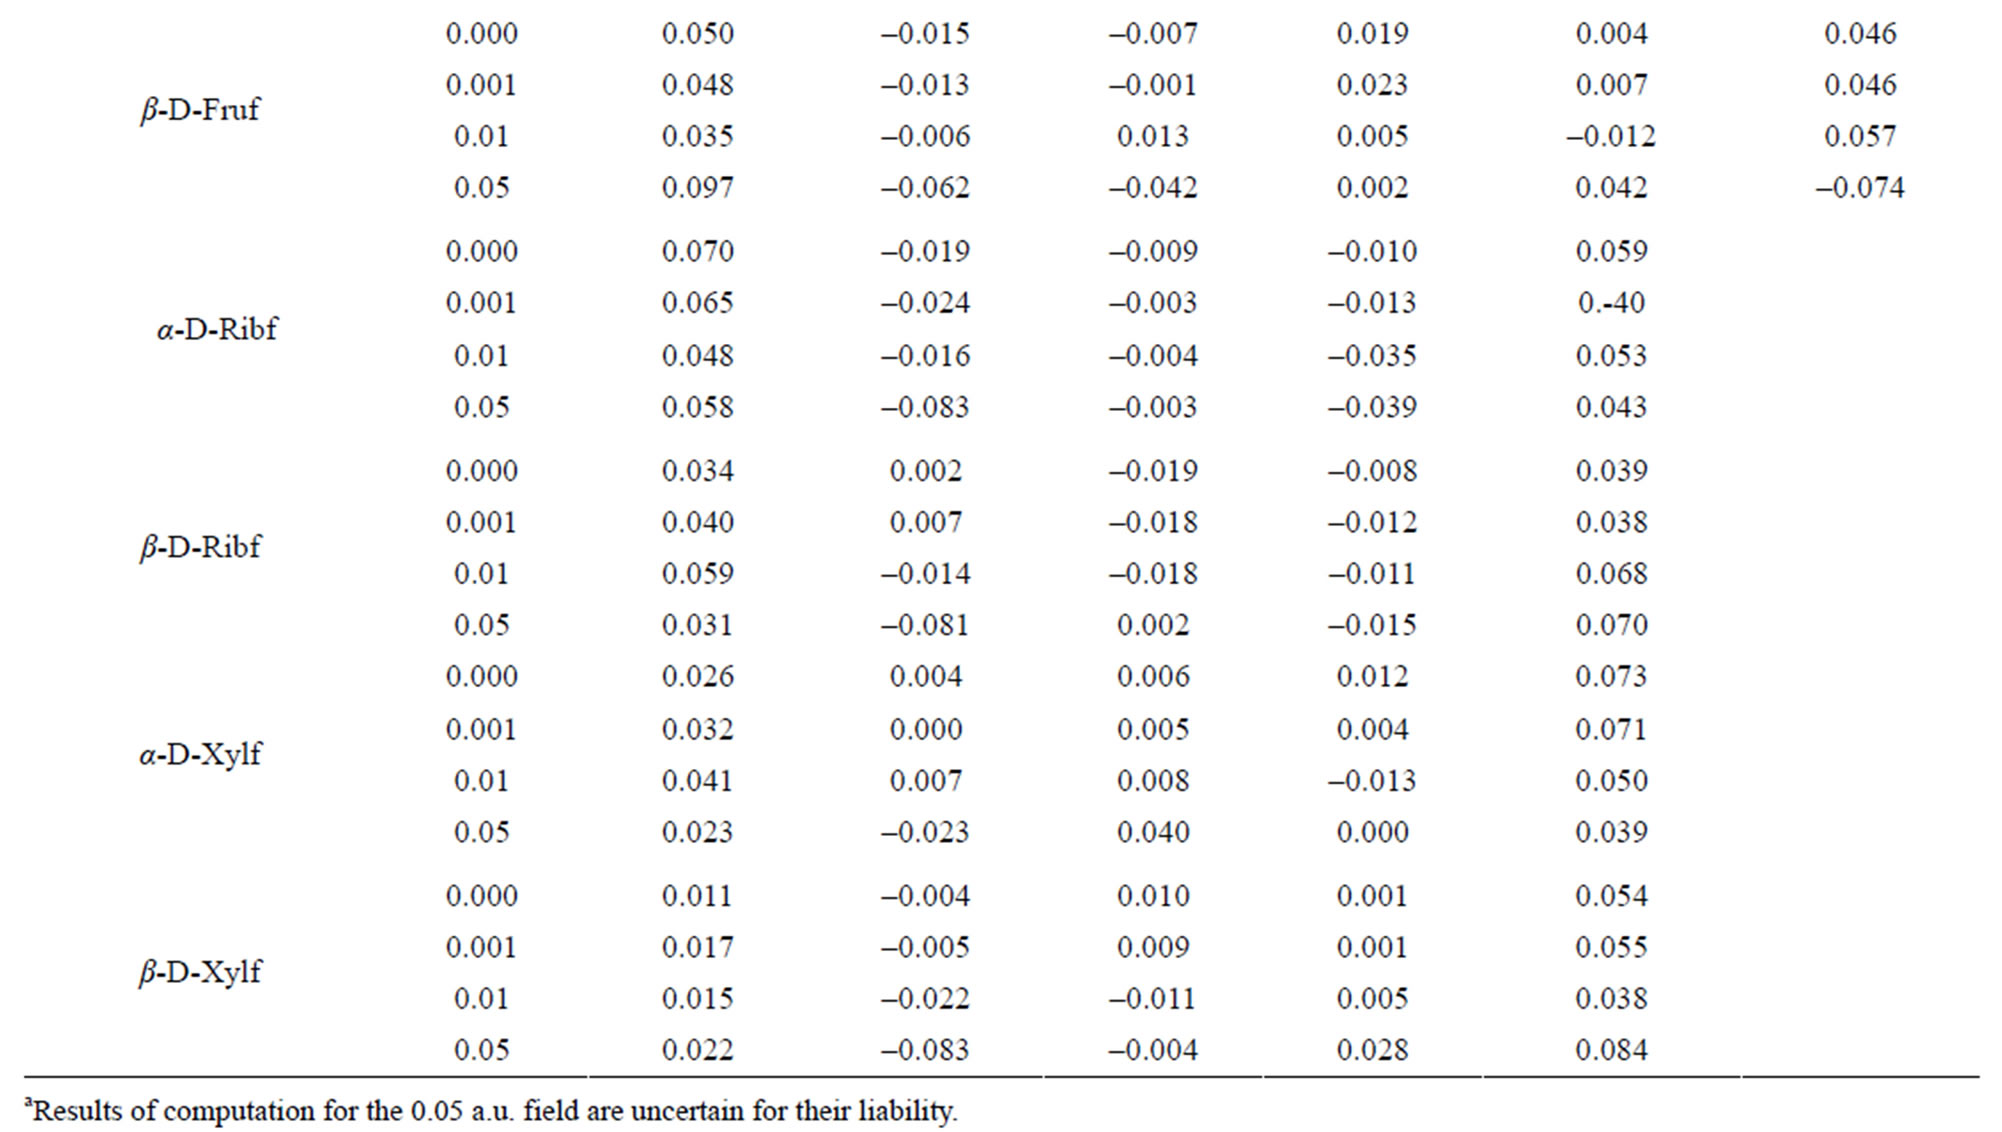
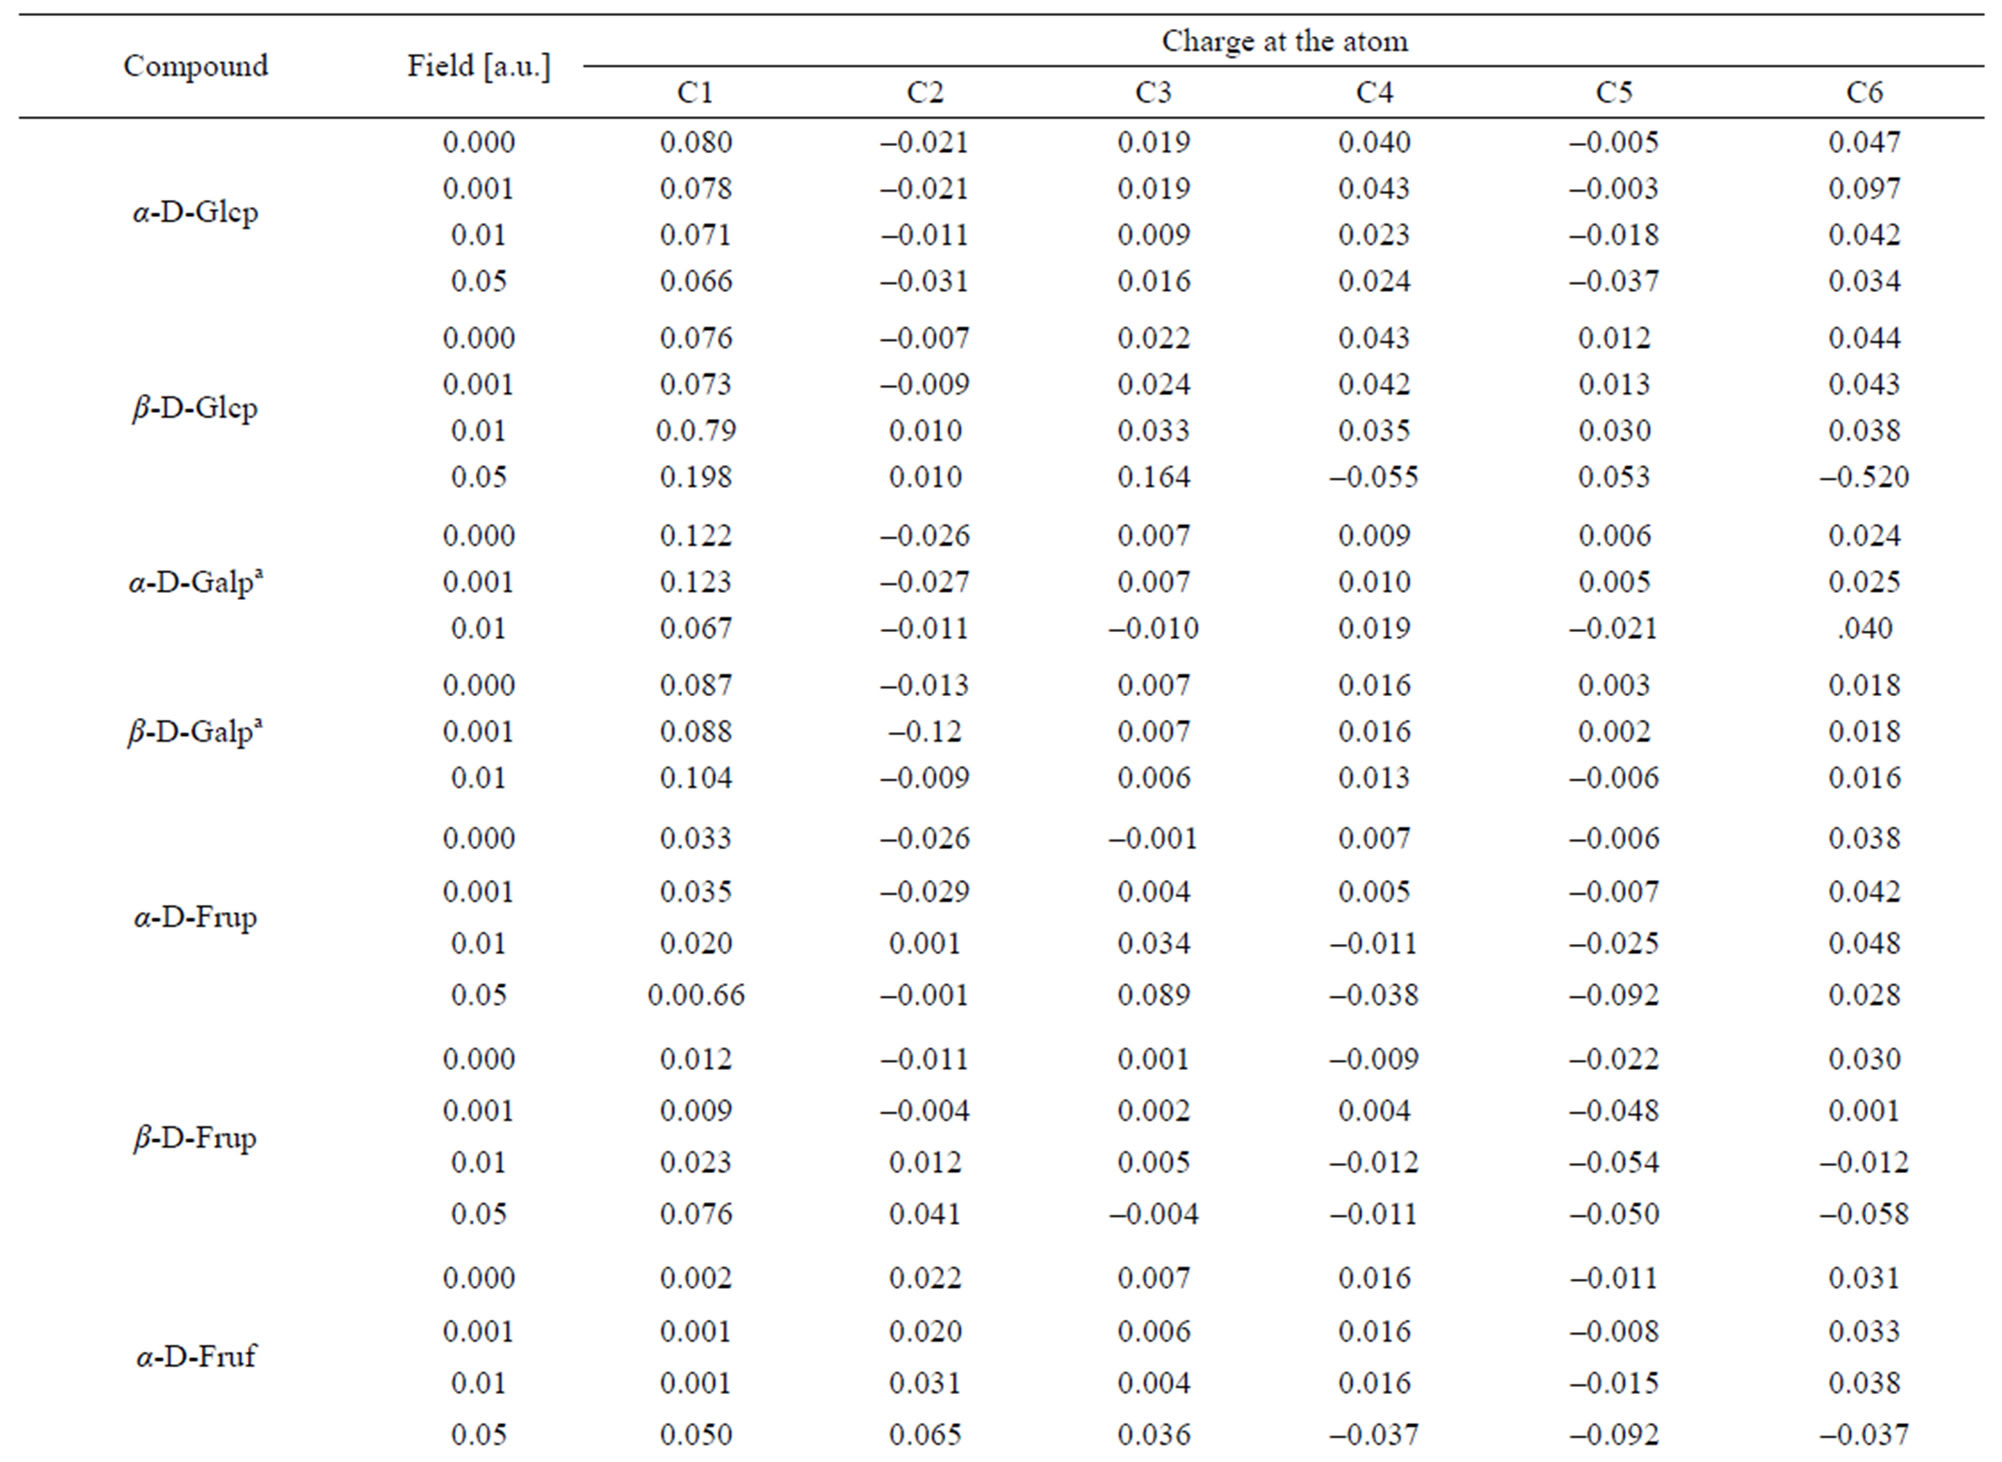
Table 4. Charge distribution at the carbon atoms.
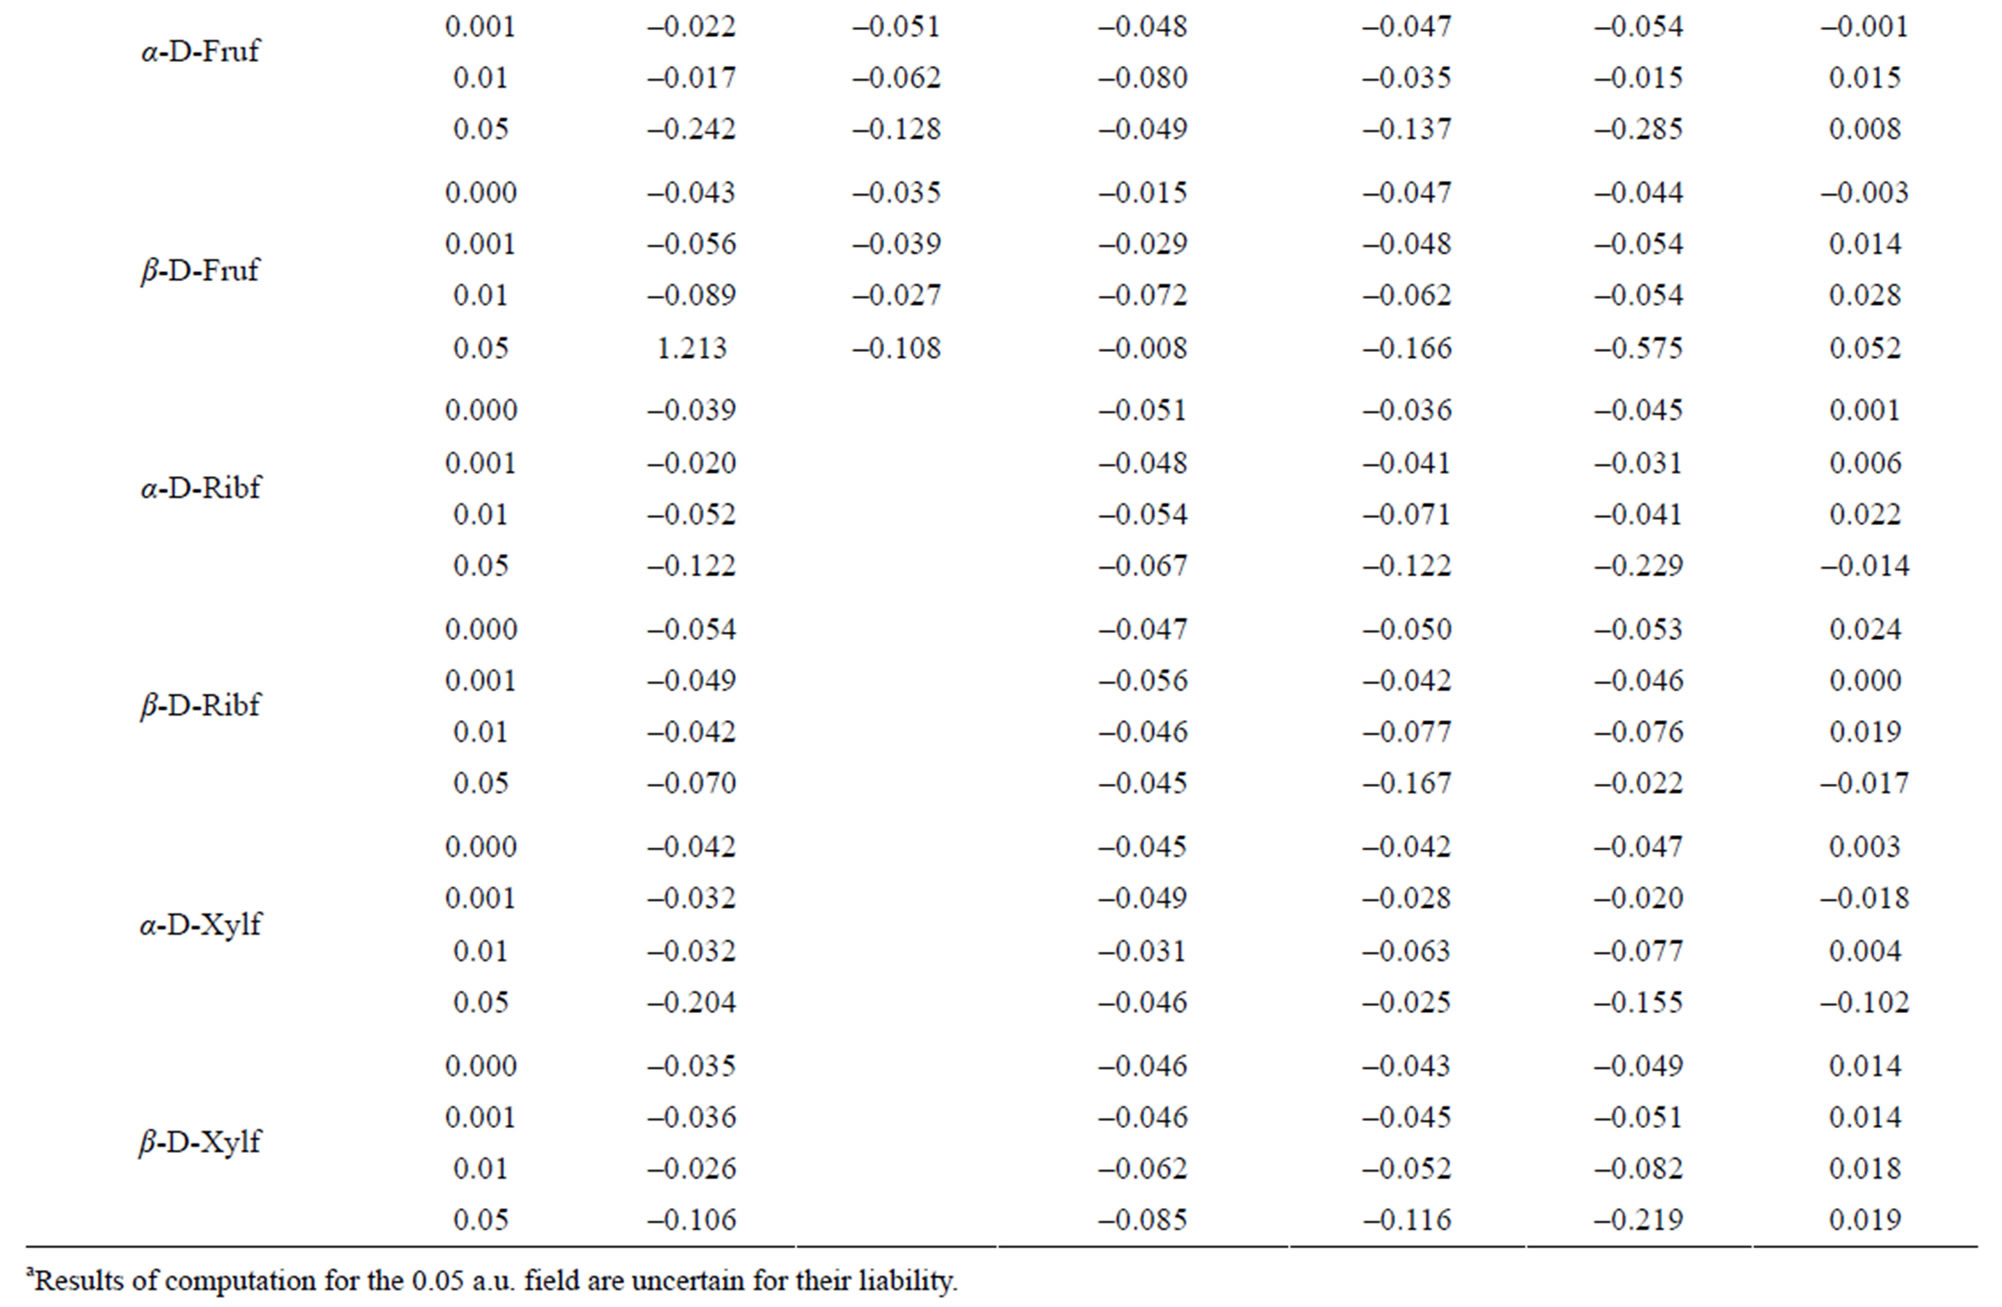
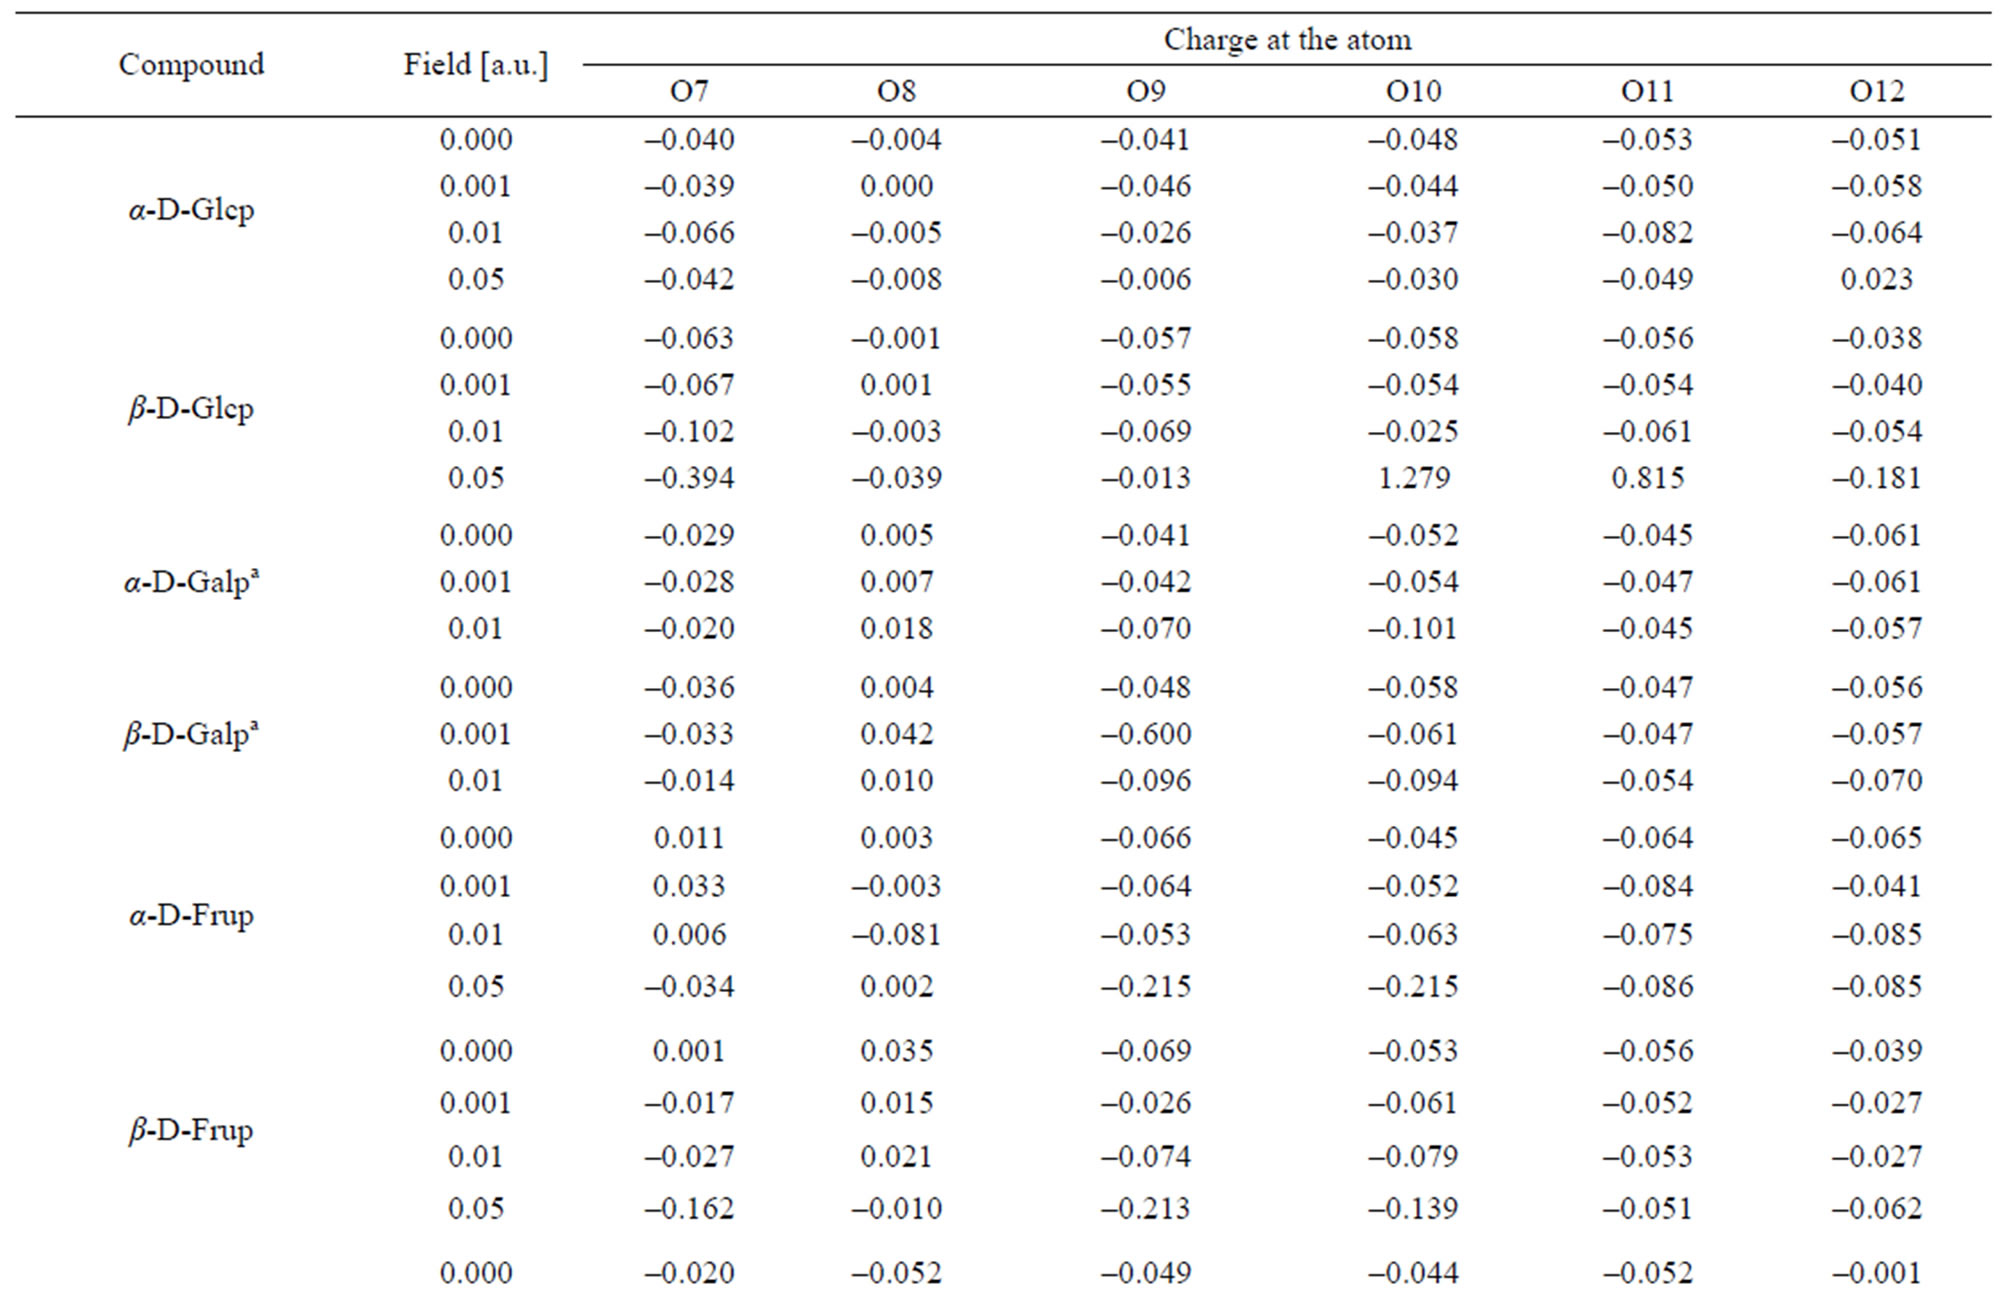
Table 5. Charge distribution at the oxygen atoms.
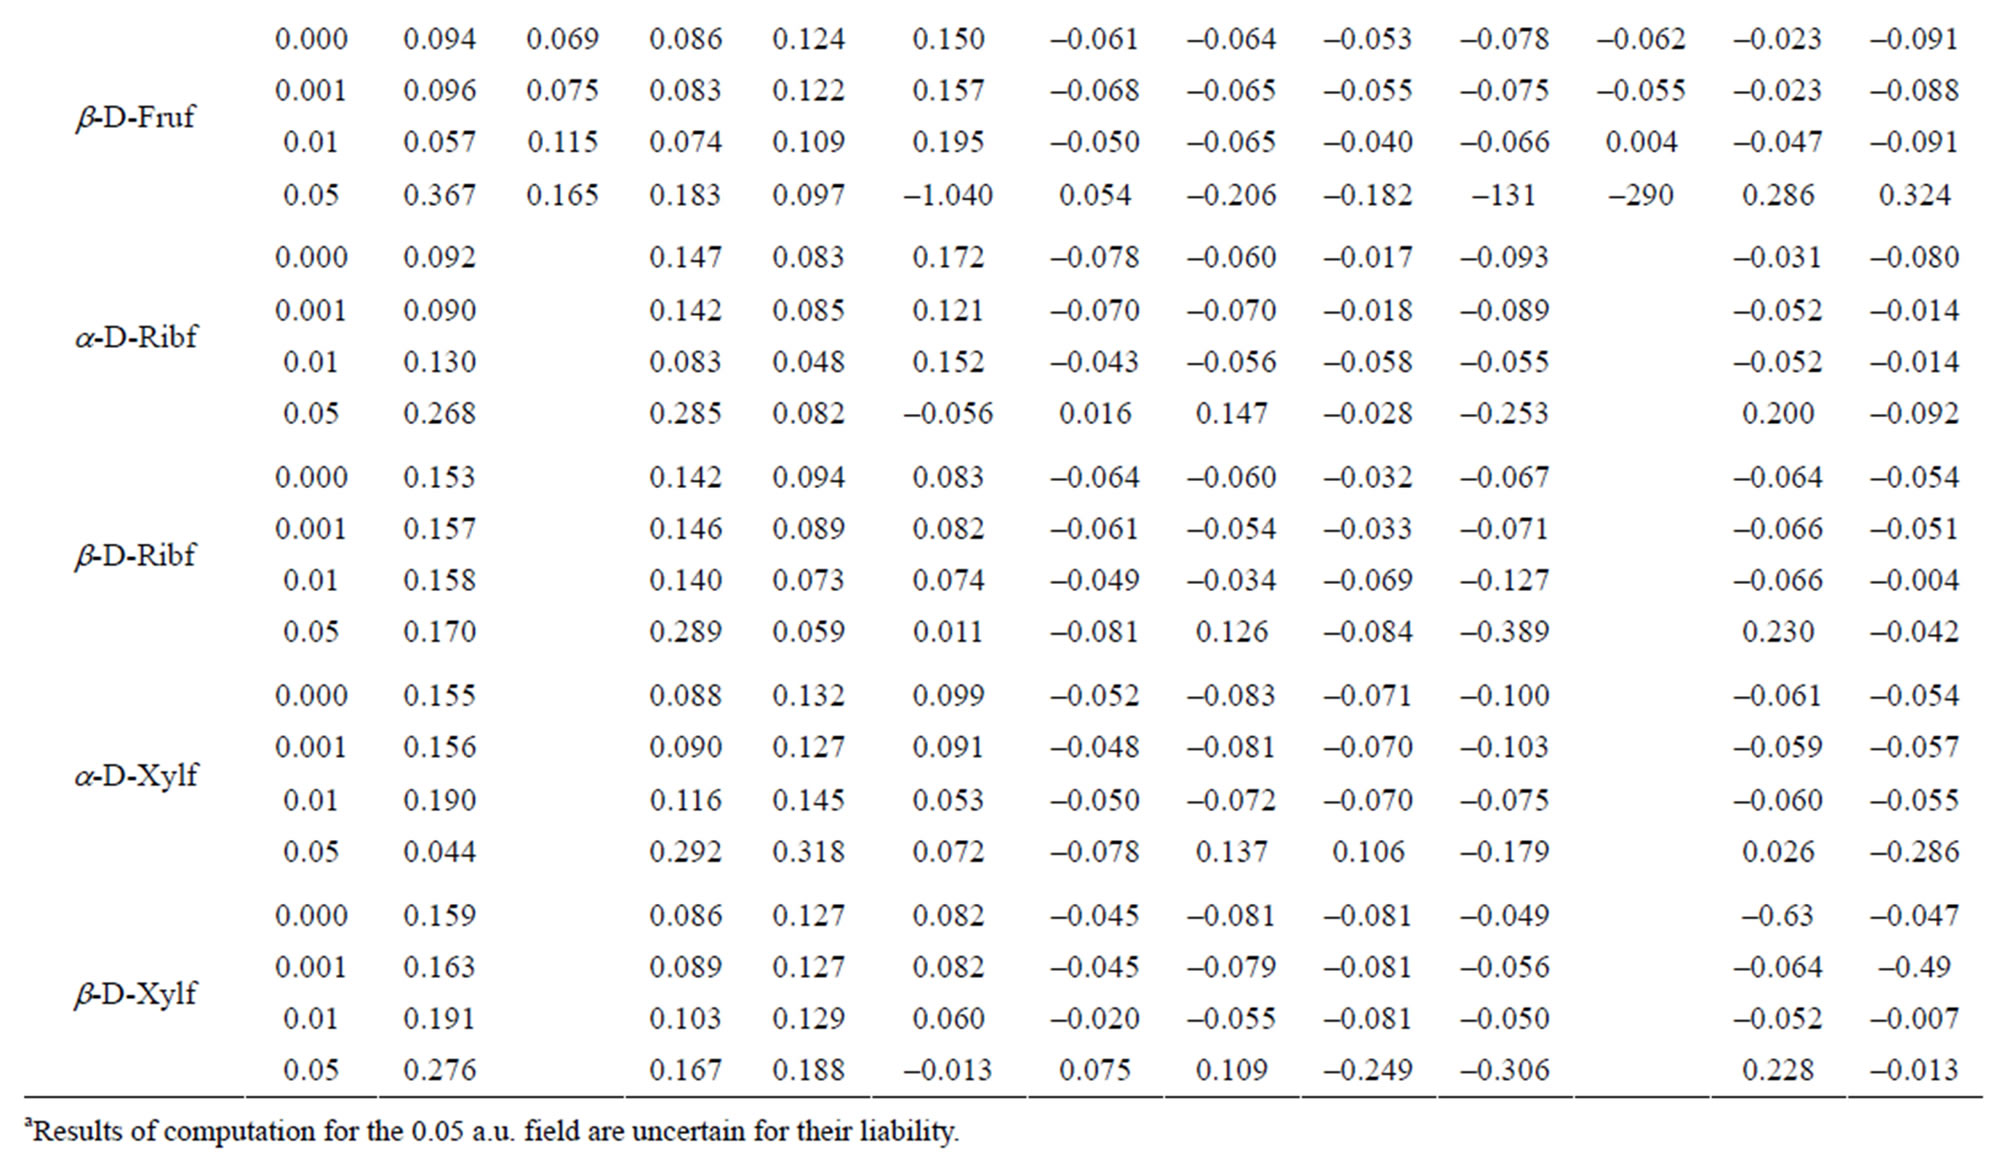
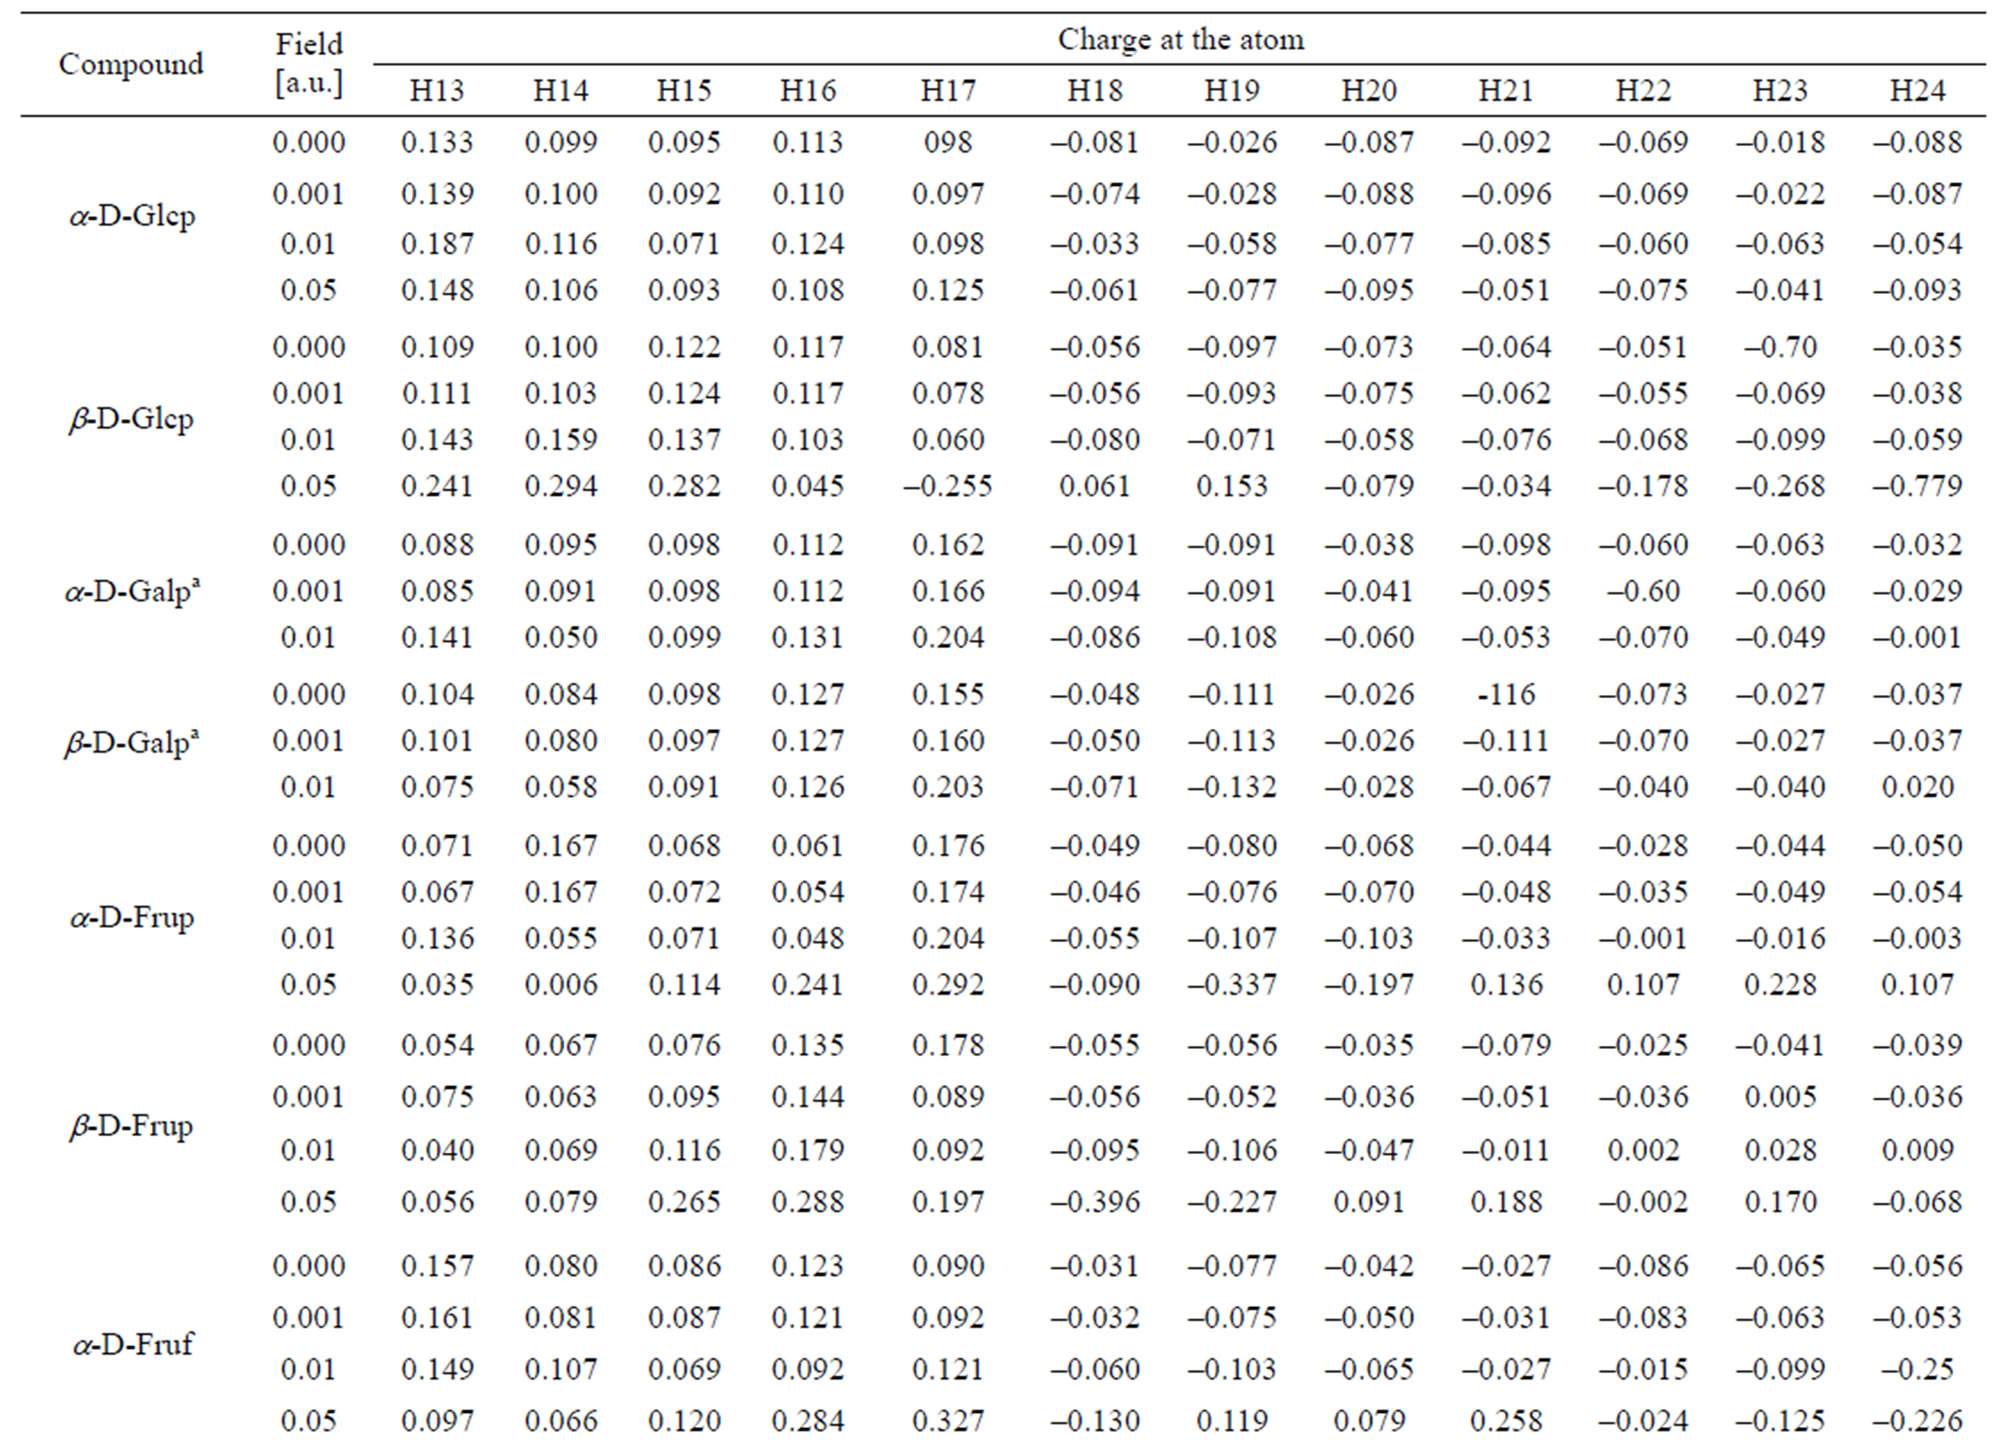
Table 6. Charge distribution at the hydrogen atoms.
a.u. field decreases it.
The reaction of the electron density at H-atoms upon the field strength is more regular. The density at H13, H15, H18, H22 and H24 decreases with the increase in the field strength and regularly increases with that at H14, H19 and H23. Such kind irregular variation of the electron density is observed at H16, H17, H20 and H21.
Like in the α-conformer, in the β-D-Glcp conformer the lowest electron density among the C-atoms is met at C1 atom and the index at C2 is even negative.
Similarly as in α-Glcp the ring O8 atom is the least negatively charged. Among the O-atoms, O7 carries the highest electron density. The O-bound H atoms are poor in electron density; H15 and H17 have the highest and the lowest electron density, respectively. All the C-bound H-atoms are rich in the lectron density. H19 and H24 have the highest and the lowest negative charge indices, respectively. The absolute values of the charge indices at C3, C5, O7,O12, H13, H14, H15, H22, H23 and H24 regularly increase with the field strength and the indices at C4, C6, O10, H17 and H19 decrease under such circumstances. The values of indices at C1, C2, C8, O9, O11, H16, H18, H20, H21 vary irregularly with the field strength.
In α-D-Galp anomeric C1 atom in α-D-Galp is poorer in electron density than C1 in α- and β-D-Glcps, and C2 is richer in the electron density than in two latter molecules. The C3, C4 and C5 atoms are only weakly electron deficient. Among the O-atoms, O11 carries the highest electron density and O8 is slightly electron deficient as shown by a positive charge index. The O-bound H17 and H18 atoms have the highest positive charge index and the most diffuse electron density is at H13. Among the C-bound H atoms H24 and H20 have the lowest negative charge index and the highest negative index is found at H21, H19 and H18. An regular increase of the absolute value of the charge indices along with the field strength is noted at C4, C6, O8, O9, H17 and H20 and the regular opposite effect suffers the charge index at O7, H14, H23 and H24. At remained atoms the indices vary with the field applied in an irregular manner similarly as in the atoms of the molecules discussed above.
In the β-D-Galp molecule positive index in that molecule is lower than that in the a-conformer. Only these at C3 and C5 are weakly positive. Among O-atoms, O10 and O12 and not O11 carry the highest electron density. H17 and H18 atoms are characterized by the highest positive charge index and H21 and H19 atoms have the highest negative index. Regular decrease of the absolute values of the indices with increase in the field strength takes place at C2, C3, C4, C6, O7, H13, H14, H15, H16, H21, and H22 atoms. An increase of these values along with the field strength is noted at C1, O8, O9, O10, O11, O12, H17, H18, H19, H20, H23 and H24 atoms. Generally, the 0.001 a.u. field has a very weak effect upon the electron density at all atoms except O7, O9, O10, H13, H14 and H24. The 0.01 a.u. field changes the electron density distribution at C5 from weakly positive into weakly negative and at H24 from considerably negative into considerably positive.
In the α-D-Frup conformer, there is a relatively low positive charge index at C1, C4 and C6 and negative index at C2, C3 and C5. O7 and O8 exhibit the positive index. The negative indices at O9, O11 and O12 are almost identical and the index at O10 is considerably lower. The most positive index is located at H14 and H17, and the least and the most negative indices are situated at H22 and H19, respectively. Increasing field strength turns originally negative indices at C2 and C3 into positive and positive indices at C4 and O8 into negative. Regular increase in the absolute values of the indices along with the field strength is observed only for C5, C6, O10 and H22 and regular decrease can be seen only for O9 and H16.
The electron density distribution in the β-D-Frup conformer shows that the carbon atoms in that conformer carries relatively low (C1, C4 and C6) or high electron density (C2, C3 and C5). The O7 and O8 atoms have slightly positive indices. The smallest negative index among Oatoms is located at O12. The H16 and H17 atoms have highly positive index and the lowest negative index among C-bound H atoms is located at H21. The H22 atom carries the smallest negative index. Applied external field can change originally negative index at the C2, C4, H22, H23 and H24 atoms into positive and originally positive index at C6 and O7 changes into negative. Regular increase in the absolute values of the indices along with the field strength is observed solely at C3, C5, O10, H15, H16, H18 and H20. No regular decrease in these values along with the field strength is found.
In the α-D-Fruf conformer a relatively low positive index is concentrated at C2 and, to a higher extent at C6. Only C5 carries negative index. All O atoms except O12 are characterized by a considerable negative charge index. The largest positive index is located at H13 and H16 and all C-bound H-atoms are characterized by negative indices, the smallest at H18 and H21. The 0.001 a.u. electric field slightly affects original electron density distribution. The most remarkable effect of that field is recognized at H13 and the C-bound H-atoms. The 0.01 a.u. field turns a weak negative index at O12 into positive but at C1, C3, C4 and H21 its effect is either negligible or none. The field regularly decreases the positive index at C3 and H17, and so increases it at C6 and H14. The negative index regularly turns more negative under such influence at H18 and H20 and, simultaneously regularly becomes less negative at H22 and H24.
In the β-D-Fruf conformer a high positive index is located at C1 and C6 and C2 and C3 have negative indices. O12 carries the smallest negative index. The lowest positive index among O-bound H-atoms is located at H14; the smallest index is at H23. The influence of the 0.001 a.u. field upon the electron density distribution is more remarkable in that conformer than in the a-conformer. That field turns a slightly negative index at O12 into positive one and the 0.01 a.u. field turns the sign of the index into opposite at C3, C5 and H22. Regular changes of the indices along with the field strength are noted at C1, C2, C3, O7, O9, O10, O12, H14, H15, H16, H17, H21 and H22.
In α-D-Ribf the indices for C1 and C5 atoms are highly positive and at remained C-atoms they are negative. All O-atoms except O12 are characterized by negative indices and the latter have positive index. Increased electric field strength increases that index. The highest positive index at O-bound H-atoms is located at H15 and H17. Regular changes of the electron density along with the field strength occur at C1, C4, O10, O12, H15, H18, H20, H21, H23 and H24.
As compared to the a-conformer, in β-D-Ribf, the positive at C1 and C5 is significantly lower. Also C2 atom with negative index in the α-conformer has a weak positive index which in the 0.01 a.u. field turns into negative. In contrast to other O-atoms O12 has the positive index and its sign does not change at the electrical field. Regular changes of the index along with the field strength are observed at C1, O7, H13, H16, H17, H18, H19, H20, H21 and H24. The index at the latter atom is particularly sensitive to changes of the field strength.
In α-D-Xylf all C-atoms in the molecule have positive index although at the 0.01 a.u. field the index at C4 changes into negative. All O-atoms except O12 have negative indices. The index at O12 in the 0.001 a.u. field turns into negative in order to return into positive in the 0.01 a.u. field. The indices at C1, C4, C5, H13, H15, H17, and H19 vary regularly with the electric field applied. The index at H20 is practically insensitive to the change of the field strength.
As compared to the a-conformer, in α-D-Xylf the positive index at C atoms is lower. The highest positive index is located at C5. The C2 atom has negative indices regardless the strength of the electric field. That field of 0.01 a.u. changes the positive index at C3 into negative. The O12 atom has positive index. Regular changes of the indices with the field strength are observed at C2, O10, O11, H13, H15, and H19. The index at H20 is completely insensitive to the change of the field regardless its strength.
Results of computations imply that saccharides present in the living organisms may participate in the response of the living organisms to the external electric field affecting metabolism of the molecules in the body fluids by fitting molecules to the enzymes. Structural changes of saccharide components of the membranes can influence the membrane permeability. Redistribution of the charge in the saccharide molecules undoubtedly affects their hydration and, hence, the macrostructure of the solutions resulting in the viscosity changes and, in the consequence, in the transport of the fluid components in tissues and across their membranes.
4. CONCLUSIONS
1) “Native” plasma and that induced by external electric field differ from one another not only by the concentration of excited species.
2) Controlled manipulation with external electric field can result in adjusting physical and chemical properties of organic compounds.
3) External electric field can affect transport and metabolism of saccharides in biological fluids and properties of biologic membranes.
REFERENCES
- Bucci, O.M., Gennerelli, C. and Savarese, C. (1998) Representation of electromagnetic fields over arbitrary surface by a finite and nonredundant number of samples. Antennas and Properties Transactions, 46, 353-359.
- Zon, J. (2000) Bioplasma and physical plasma in the living systems. A study in science and philosophy. KUL Editorial Office, Lublin.
- Zon, J. (2005) Physical plasma switchability in the brain. Electromagnetic and Biological Medicine, 24, 273-282. doi:10.1080/15368370500379665
- Adamski, A. (2006) Bioelectronic processes in human sensual perception and psychical functions. Editorial Office of the Silesian University, Katowice (in Polish).
- Korotkov, K.G. (2007) Principles of analysis of GDV bioelectrography. Renome Editorial Office, Renome, Sankt Petersburg (in Russian).
- Opalinski, J. (1979) Kirlian-type images and the transport of thin-film materials in high-voltage corona discharges. Journal of Applied Physics, 50, 498-504. doi:10.1063/1.325641
- Mazurkiewicz, J. and Tomasik, P. (2010) Contribution to the understanding effects of weak electrical phenomena. Natural Science, 2, 1195-1210.
- Bonnel, J.A. (1982) Effects of electric fields near power transmission plant. Journal of the Royal Society of Medicine, 75, 933-941.
- Dawson, T.W., Stuchly, M.A. Caputa, K., Sastre, A., Sheppard, R.B. and Kavet, R. (2000) Pacemaker interface and low-frequency electric induction in humans by external fields and electrodes. IEEE Transactions of Biomedical Engineering, 47, 1211-1218. doi:10.1109/10.867951
- Dube, J., Methot, S., Moulin, V., Goulet, D., Bourdage, M., Anger, F.A. and Germain, L. (2005) External electric fields induce morphological changes in human skin cells cultured in vitro. ProcGA05/KP54.
- Mazurkiewicz, J. (1997) Structure of aqueous D-fructose solutions. Polish Journal of Food and Nutrition Sciences, 6, 99-106.