Health
Vol.5 No.7(2013), Article ID:34592,7 pages DOI:10.4236/health.2013.57148
Psychological and physiological effects of stereoscopic movies of real-world scenes containing improper three-dimensional settings
![]()
1Health Research Institute, National Institute of Advanced Industrial Science and Technology (AIST), Osaka, Japan; *Corresponding Author: h.watanabe@aist.go.jp
2Human Technology Research Institute, National Institute of Advanced Industrial Science and Technology (AIST), Ibaraki, Japan
Copyright © 2013 Hiroshi Watanabe, Hiroyasu Ujike. This is an open access article distributed under the Creative Commons Attribution License, which permits unrestricted use, distribution, and reproduction in any medium, provided the original work is properly cited.
Received 30 April 2013; revised 31 May 2013; accepted 15 June 2013
Keywords: Stereoscopic Display; Visually Induced Motion Sickness; Visual Fatigue
ABSTRACT
By using psychological and physiological indicators, the effects on the body of three-dimensional (3D) movies containing improper settings were evaluated with 139 university students. The experiment consisted of two sessions: 1) a 3D movie containing improper 3D settings was compared with a 2D movie containing only the rightside images presented to both eyes, and 2) the original 3D movie was compared with the same 3D movie altered to contain improper 3D settings. The results of this experiment demonstrated clear deterioration of the subjective psychological indicators (degree of motion sickness after watching the movies and comfort level at 1-min intervals during the movie) with respect to the 3D movie containing improper settings. On the other hand, the physiological indicators (LF/HF ratio indicating the status of the autonomic nervous system) changed as a result of watching a 3D movie, but were unaffected by the presence or absence of improper 3D settings.
1. INTRODUCTION
The adoption of three-dimensional (3D) displays and 3D movies is spreading rapidly, and 3D images that previously could be viewed only with the aid of special devices and settings are now becoming widely accessible. This is related to the expansion of the market for imaging devices, the increasing creative freedom of filmmakers, and the increasing number of entertainment options available to consumers of media content. On the other hand, the gathered knowledge about the influence of new video devices and movie content on the body remains limited, and it is desirable to collect statistically meaningful data by methods used often in ergonomics. From this perspective, in recent years an increasing number of studies have examined the biological influence of general 3D viewing environments on viewers [1,2].
In the study presented in this paper, we aim at qualitatively elucidating the psychological and physiological changes induced by watching a movie incorporating images that are “improper” in terms of 3D movie settings.
We used a 3D movie custom-made for this study by a professional filmmaker who understands from experience that 3D movies can cause visual fatigue and knows techniques for reducing it. Based on interviews with this filmmaker, we learned that the causes of visual fatigue include excessive parallax, geometrical misalignment, and disparity in color or timing between the images presented to each eye. These causes coincide with past academic ergonomics research (introduced below). Therefore, regarding the movies for the experiment conducted in this study, first we ordered a 3D movie prepared with 3D settings regarded as “proper” based on the experience of the filmmaker (denoted as original3D). Next, another 3D movie was prepared by adding “improper” factors, considered to be related to visual fatigue, to the original 3D movie (denoted as altered3D), and a 2D movie (denoted as 2D) was prepared by presenting only the right-side images from the original 3D movie to both eyes.
Previous research has shown that such improper factors cause viewers to experience discomfort such as general fatigue, accommodation difficulties, headache, loss of sense of balance, eye strain, and nausea [3]. These factors are divided into the following two main categories: differences between retinal images [4-9], and mismatch between accommodation and convergence [10-15]. The experiment was conducted by using two different groups of participants: movies original3D and altered3D were compared in one group (referred to as the original3D-altered3D group), and movies 2D and altered3D were compared in the other group (referred to as the 2D-altered3D group). The participants were given the task of reporting their level of comfort or discomfort before and after watching the movies, as well as at 1-min intervals during each movie. In addition, from a physiological viewpoint, the status of the autonomic nervous system was evaluated from the time-series data in electrocardiograms acquired while the participants were watching the movies.
2. METHODS
2.1. Participants
The participants in the experiment were university students in their 20s and had normal or corrected to normal eyesight. There were 41 men and 32 women in the original3D-altered3D group, and 35 men and 33 women in the 2D-altered3D group. Written consent was obtained from each participant in the study. Prior to the experiment, the participants were not given any information about the content of the movies or the purpose of the experiment. Participants were informed that the movies were 10 min long, that wearing polarized glasses for stereoscopic vision would be required (however, the participants were not informed whether the viewed content was 2D or 3D), and that watching the movies might cause discomfort (this negative effect was noted on the informed consent form). The experiment was approved by the Committee for Ergonomic Experiments of AIST.
2.2. Equipment
The movies were presented to individual participants on a JVC 3D LCD display (GD-463D10, 46 in.) through a Windows PC (DosPara Prime Galleria ZA with an Intel Core i7-950 3.07 Hz CPU, 4GB of RAM, an nVidia GeForce GTX 285 graphics card, and a built-in Blue-ray disc player), and sound was played through sound-isolating headphones. An electrocardiogram (ECG) was acquired through a pair of Ag-AgCl electrodes placed on the chest of the participant. All analog signals were amplified and digitized at a 1-kHz sampling rate (12-bit resolution) using an ECG collection system (MP100, BIOPAC Systems Inc., Osaka, Japan) and stored on the hard disk of a PC (SONY VPCEB29FJ with an Intel Core i5-450M CPU, 4GB of RAM, and a 5400-rpm Serial ATA hard disk drive) for later analysis. Subjective reports were collected at 1-min intervals using a switch box, and the data were stored on the same PC via the ECG system.
2.3. Movies
The movies presented to the participants were prepared by a professional filmmaker (Furusawa Toshifumi, visiting professor at the Beijing Film Academy), and were based on an original 10-min movie (GO AHEAD!) showing two sisters (played by professional models) visiting an amusement park (Figure 1). Fourteen parts of the original movie were manipulated by introducing disparity in coherence, parallax, and playing speed between the images shown to each eye. A summary of the manipulations is shown in Table 1.
2.4. Procedure
After being provided with an overview of the experiment, a participant entered a darkened experiment room and sat at a distance of 172 cm from the display (viewing angle 33.7˚ horizontally and 18.9˚ vertically). The two movies were played in random order to both groups. The participant was asked to complete a simulator sickness questionnaire (SSQ) [16] for all movie conditions before and after viewing each 10-min movie. Upon completing the questionnaire before the start of each movie, the participant put on polarized glasses for stereoscopic vision and sound-isolating headphones for sound reproduction, and then watched the movie. While viewing the movie, the participant provided a subjective evaluation of their level of comfort or discomfort at 1-min intervals by ranking the experience on a five-level scale from “very uncomfortable” to “very comfortable” [9,17]. The timing
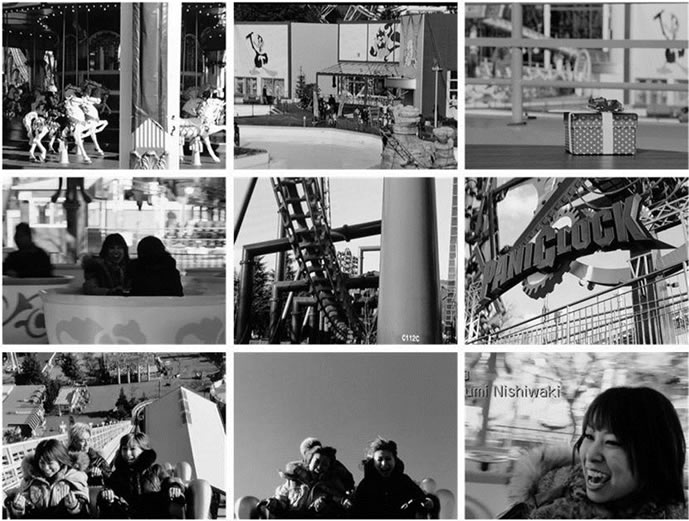
Figure 1. Examples of scenes from the movie used in the experiment.
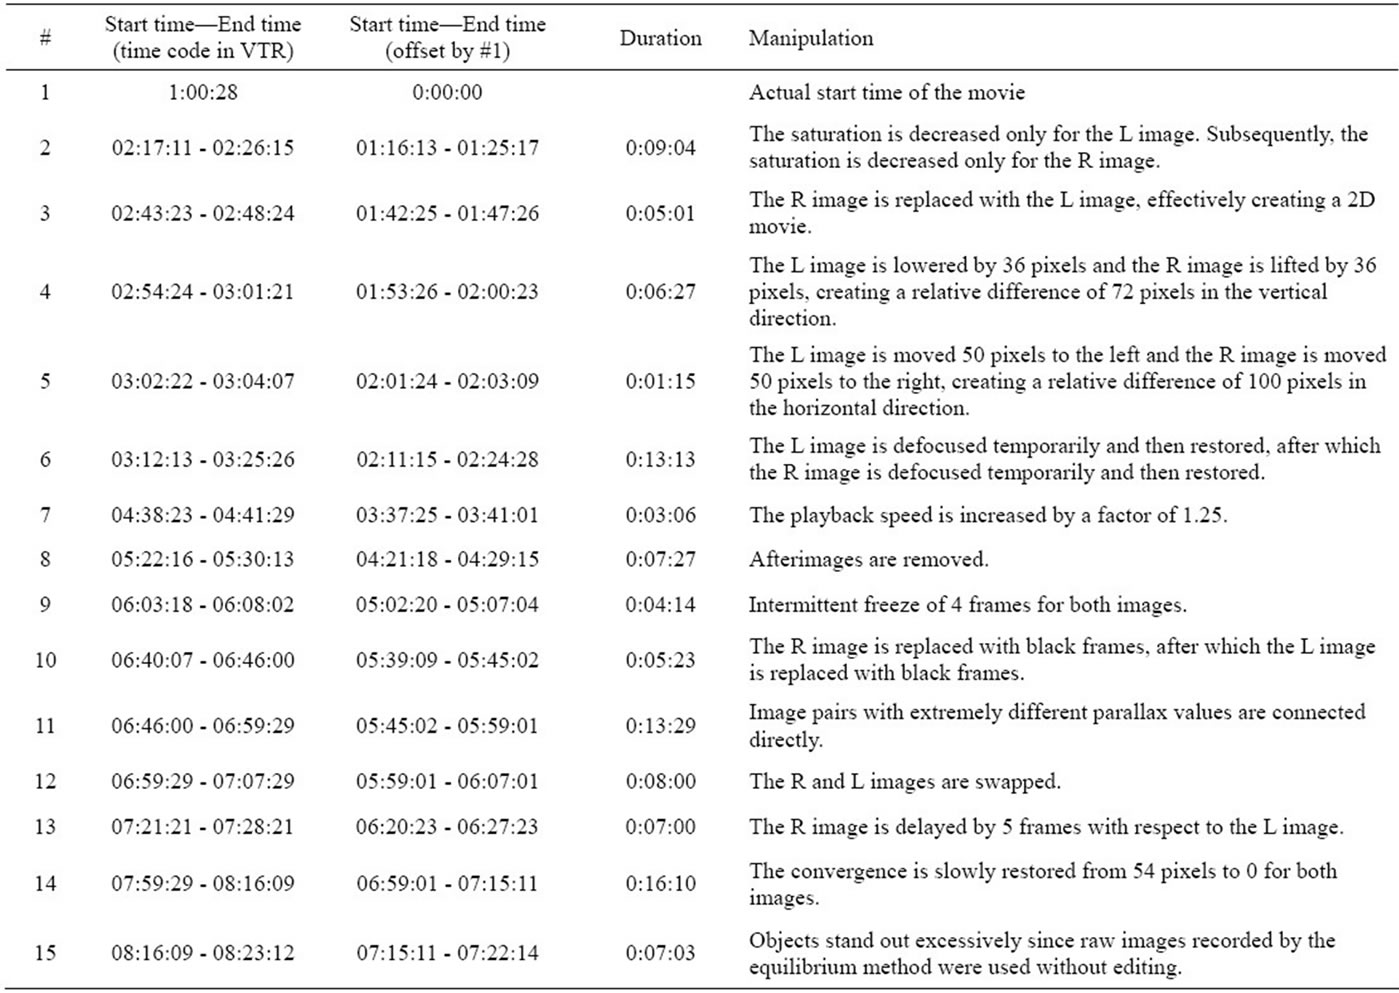
Table 1. Improper settings introduced into the original movie.
of each evaluation step was announced with a buzzing sound added to the audio content of the movie, and the participant indicated a response by pressing a button placed in front of him or her. In addition, electrodes were attached at three places on the participant’s body (on the chest and the abdomen) to obtain electrocardiograms (sampling frequency: 1 kHz) [18] in order to evaluate the status of the autonomic nervous system.
3. RESULTS AND DISCUSSION
The results indicated that the status of the autonomic nervous system, as well as the subjective evaluation, exhibited characteristic changes while the participants watched 3D movies. Table 2 lists the results of analysis of variance (ANOVA) for the original3D-altered3D group and the 2D-altered3D group for the SSQ scores given before and after watching the movies, the subjective level of comfort or discomfort indicated at 1-min intervals while watching the movies and the status of the autonomic nervous system.
The SSQ questionnaire consists of 18 questions distributed in four categories (nausea, oculomotor, disorientation, and total), where a specific weight is assigned to the raw score at the time of analysis [16]. The responses for the 2D-altered3D group are shown in Figure 2(a), and those for the original3D-altered3D group are shown in Figure 2(b). The results of a three-factor ANOVA performed by taking sex as a between participant factor and the observation conditions and the SSQ categories as within-participant factors indicated significant main effects with regard to the conditions in both the 2D-altered3D and original3D-altered3D groups. These results show that the SSQ marks were higher for the altered3D movie than for the other two movies (2D and original3D). In addition, significant main effects were also confirmed for the SSQ categories, and the results of multiple comparison indicated that the score for nausea was significantly lower than that for the other three categories in both groups (2D-altered3D and original3D-altered3D). Also, the oculomotor and disorientation categories had similar results with relatively high scores.
Continuing with the evaluation of the level of comfort or discomfort at 1-min intervals during the movies, Figure 3(a) shows the responses provided by the 2D-altered3D group, and Figure 3(b) shows the responses
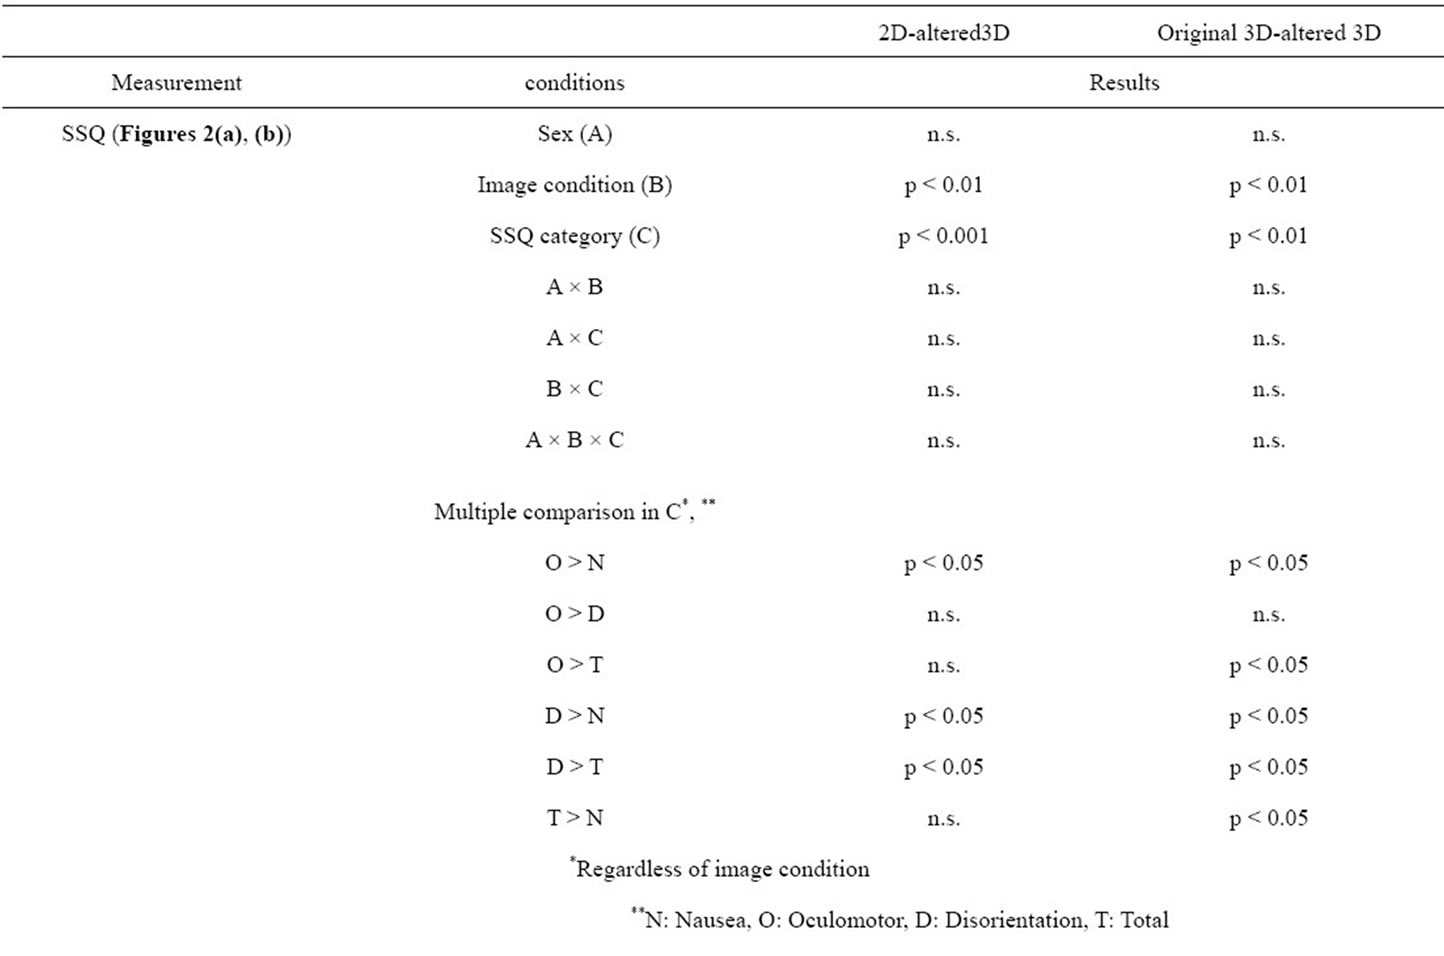
Table 2. Results of ANOVA for the original3D-altered3D and 2D-altered3D groups in the order of SSQ evaluation before and after watching the two movies, subjective evaluation of the level of comfort or discomfort at 1-min intervals during the movies and activity of the autonomic nervous system.
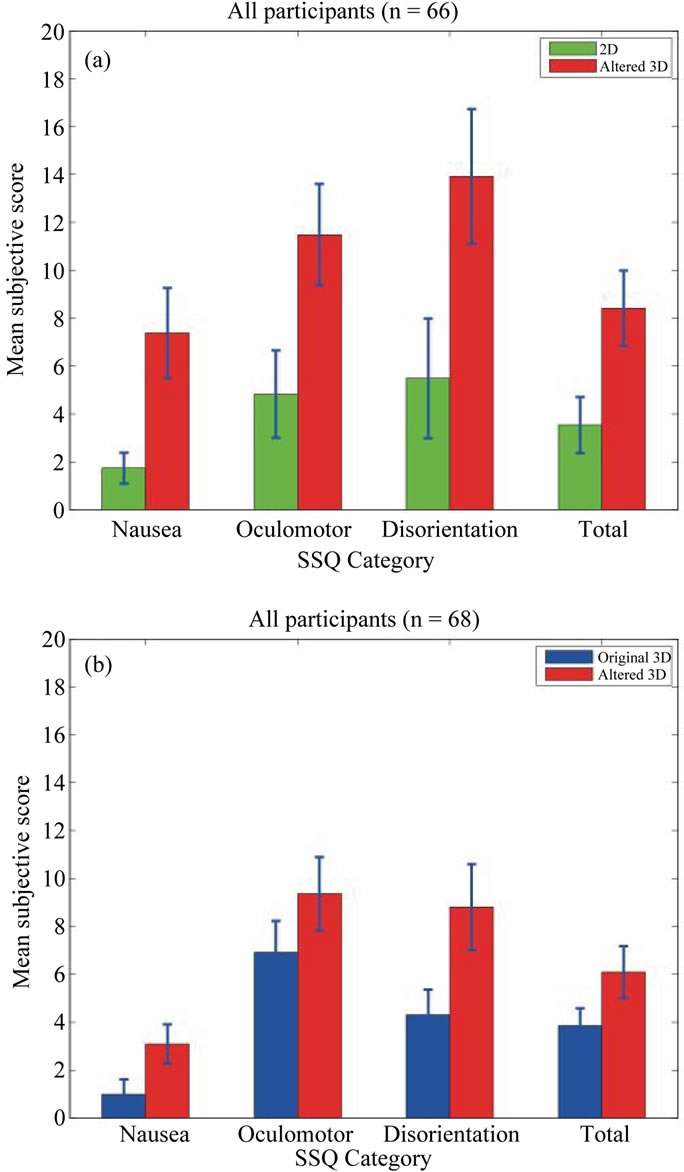
Figure 2. Variation in the subjective evaluation of the degree of motion sickness before and after watching movies: (a) 2D (green)-altered3D (red) group and (b) original3D (blue)-altered3D (red) group. Error bars indicate integrated squared error. Each figure displays, from left to right, the score for the categories “Nausea”, “Oculomotor”, “Disorientation”, and “Total”.
provided by the original3D-altered3D group. The results of an ANOVA performed by taking sex as a between participant factor and the observation conditions and the time of evaluation as within-participant factors indicated significant main effects of the observation conditions, where the participants clearly experienced higher levels of discomfort while watching the altered3D movie as compared with the other two movies (2D and original3D). In addition, a main effect was also confirmed for the response time, and simple effect verification was performed owing to the significant interaction between the conditions of the observed movies. As a result, it was revealed that high level of discomfort was experienced at 2, 4, 6, 7, and 8 min into the altered3D movie in the 2D-altered3D group and at 2, 6, and 8 min into the al-
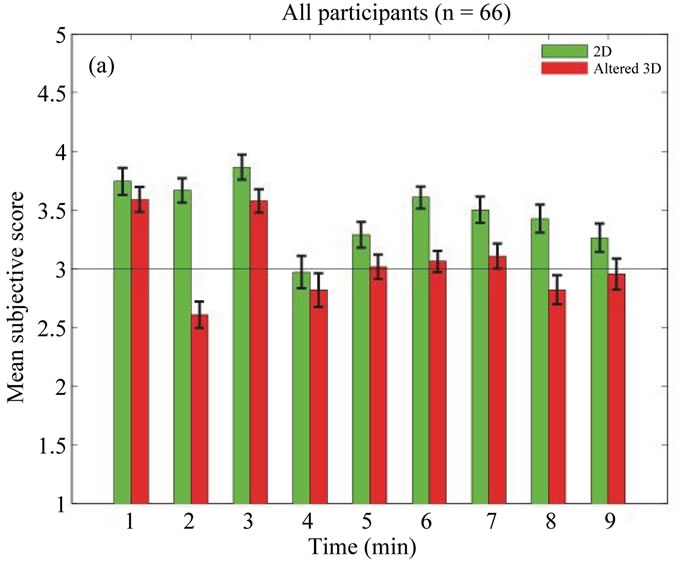
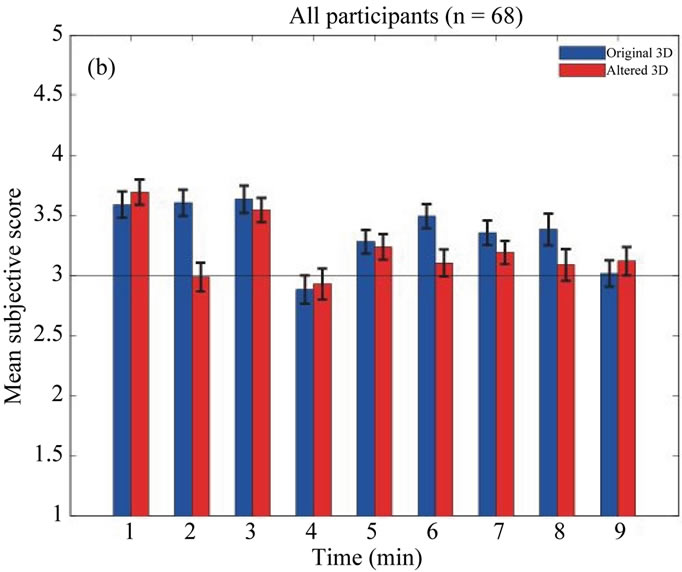
Figure 3. Evaluation of the level of comfort or discomfort as indicated at 1-min intervals during viewing of movies: (a) 2D (green)-altered3D (red) group and (b) original3D (blue)-altered3D (red) group. Error bars indicate integrated squared error. Along the vertical axis, the upper part corresponds to “very comfortable”, the lower part corresponds to “very uncomfortable”, and the center corresponds to “Neither”. The horizontal axis shows the time since the beginning of the movie in minutes.
tered3D movie in the original3D-altered3D group. Since considerable alterations common to both groups were introduced into the original movie at times 2, 6, and 8 min, this suggests that the participants were strongly aware of the disparity between the images presented to each eye.
Finally, we focus on the status of the autonomic nervous system of the participants during the movies. The time at the peak of the R-wave for the pulse for each participant was calculated from an electrocardiogram obtained while the movie was viewed, and the time interval was calculated between adjacent peaks (R-R interval). Since this R-R interval consisted of time-series data with non-uniform sampling, we converted it into a uniform data set by re-sampling it at 0.5 s periods. Taking the R-R interval as a function of time and subjecting it to frequency analysis, the LF/HF ratio of the area of the region with frequency below 0.15 Hz (LF component) to that of the region with frequency above 0.15 Hz (HF component) was calculated. The time-series change in the LF/HF ratio was calculated by using the LF/HF ratios for 3 min periods whose onsets were 1 min apart, starting from the beginning of observation. Figures 4(a) and (b) shows the averaged time-series change in the LF/HF ratio for all participants in each group. The LF/ HF ratio is considered to reflect the status of the autonomic nervous system, which consists of the sympathetic nervous system and the parasympathetic nervous system, and higher values suggest increased activity of the sympathetic nervous system [17].
The results of an ANOVA performed by taking sex as a between-participant factor and the observation conditions and time as within-participant factors indicated significant main effects of the movie conditions in the 2D-altered3D group, suggesting that watching a 3D movie with introduced disparity relative to the display and/or a set of disagreement factors between the images presented to each eye affects the autonomic nervous system. In addition, interaction was confirmed between the observation time as a main effect and the movie condition: at times 4, 5, and 6 min, the LF/HF ratio was significantly higher during viewing of the altered3D movie as compared with the 2D movie. On the other hand, there was no significant difference in LF/HF ratio with regard to the movie conditions in the case of the original3Daltered3D group, and the main effect was related only to the time series. This result suggests that the action of watching a 3D movie itself affects the activity of the autonomic nervous system.
4. CONCLUSIONS
Based on the above results, although watching a 3D movie induces changes in the autonomic nervous system, the conscious labeling of its status in terms of comfort or discomfort is related to the disparity between the leftand right-side images in the movie. The type and degree of improper settings used in this study were not controlled, and they did not determine the level of discomfort or the influence on the autonomic nervous system. In the future, it will be necessary to further elucidate the relation of disparities and changes thereof with differences in brightness and related factors.
As the indicator of the activity of the autonomic system, LF/HF was obtained from time-series analysis using moving averages of heart rate variability over 3 min intervals whose onsets were 1 min apart. It is impossible to directly associate this with 1 min discrete changes in the
Figure 4. Time-series changes in the LF/HF ratio, which reflects the activity of the autonomic nervous system, as obtained from measurements of the heart rate: (a) 2D (green)-altered3D (red) group and (b) original3D (blue)-altered3D (red) group. Error bars indicate integrated squared error. The vertical axis shows the normalized LF/HF ratio, and the horizontal axis shows the time since the beginning of the movie in minutes.
subjective evaluation of comfort or discomfort.
However, the fact that significant time-series changes were found in psychological and physiological indicators is rather important. An analysis method that synchronizes these time scales should be considered in future work.
5. ACKNOWLEDGEMENTS
We thank Keiko Suzuki, Hiromi Kamiiwa, and Seiko Fujisaki from the Health Research Institute at AIST for their assistance in analyzing the research data. The present study was conducted as a “2009 JapanUS collaboration project toward a novel low carbon society by the Ministry of Economy, Trade and Industry (METI)”. The funding source had no role in the study design, data collection and analysis, decision to publish, or preparation of the manuscript.
![]()
![]()
REFERENCES
- Polonen, M., Jarvenpaa, T., and Bilcu, B. (2013) Stereoscopic 3D entertainment and its effect on viewing comfort: Comparison of children and adults. Applied Ergonomics, 44, 151-160. doi:10.1016/j.apergo.2012.06.006
- Polonen, M., Salmimaa, M., Takatalo, J. and Hakkinen, J. (2012) Subjective experiences of watching stereoscopic Avatar and U2 3D in a cinema. Journal of Electronic Imaging, 21, 011006.
- Kuze, J. and Ukai, K. (2008) Subjective evaluation of visual fatigue caused by motion images. Displays, 29, 159-166. doi:10.1016/j.displa.2007.09.007
- Kooi, F.L. and Toet, A. (2004) Visual comfort of binocular and 3D displays. Displays, 25, 99-108. doi:10.1016/j.displa.2004.07.004
- Nojiri, Y., Yamanoue, H., Hanazato, A., Emoto, M. and Okano, F. (2004) Visual comfort/discomfort and visual fatigue caused by stereoscopic HDTV viewing. Proceedings of the SPIE IS&T Electronic Imaging, 5291, 303- 313.
- Seuntiëns, P.J.H., Meesters, L.M.J. and IJsselsteijn, W.A., (2005) Perceptual attributes of crosstalk in 3D images. Displays, 26, 177-183. doi:10.1016/j.displa.2005.06.005
- Speranza, F., Tam, W.J. and Renaud, R. (2006) Effect of disparity and motion on visual comfort of stereoscopic images. Proceedings of the SPIE, 6055, 94-103.
- Wopking, M. (1995) Viewing comfort with stereoscopic pictures: An experimental study on the subjective effects of disparity magnitude and depth of focus. Journal of the Society for Information Display, 3, 101-103. doi:10.1889/1.1984948
- Yano, S., Ide, S., Mitsuhashi, T. and Thwaites, H. (2002) A study of visual fatigue and visual comfort for 3D HDTV/HDTV images. Displays, 23, 191-201. doi:10.1016/S0141-9382(02)00038-0
- Hale, K.S. and Stanney, K.M. (2006) Effects of low stereo acuity on performance, presence and sickness within a virtual environment. Applied Ergonomics, 37, 329-339. doi:10.1016/j.apergo.2005.06.009
- Chase, C., Tosha, C., Borsting, E. and Ridder 3rd, W.H., (2009) Visual discomfort and objective measures of static accommodation. Optometry and Vision Science, 86, 883- 889. doi:10.1097/OPX.0b013e3181ae1b7c
- Emoto, M., Niida, T. and Okano, F. (2005) Repeated vergence adaptation causes the decline of visual functions in watching stereoscopic television. Journal of Display Technology, 1, 328-340. doi:10.1109/JDT.2005.858938
- Emoto, M., Nojiri, Y. and Okano, F. (2004) Changes in fusional vergence limit and its hysteresis after viewing stereoscopic TV. Displays, 25, 67-76. doi:10.1016/j.displa.2004.07.001
- Hoffman, D.M., Girshick, A.R., Akeley, K. and Banks, M.S. (2008) Vergence-accommodation conflicts hinder visual performance and cause visual fatigue. Journal of Vision, 8, 1-30.
- Ukai, K., Oyamada, H. and Ishikawa, S. (2000) Changes in accommodation and vergence following 2 hours of movie viewing through biocular head-mounted display. In: Franzen, Richter and Stark, Eds., Accommodation and Vergence Mechanisms in the Visual System, Birkhauser Verlag, Besel, 313-325.
- Kennedy, R.S., Lane, N.E., Berbaum, K.S. and Lilienthal, M.G. (1993) Simulator sickness questionnaire: An enhanced method for quantifying simulator sickness. The International Journal of Aviation Psychology, 3, 203-220. doi:10.1207/s15327108ijap0303_3
- Ujike, H. and Watanabe, H. (2011) Effects of stereoscopic presentation on visually induced motion sickness. Proceedings of the SPIE, 7863, 786314.
- Watanabe, H., Teramoto, W. and Umemura, H. (2007) Effect of predictive sign of acceleration on heart rate variability in passive translation situation: Preliminary evidence using visual and vestibular stimuli in VR environment. Journal of Neuroengineering and Rehabilitation, 4, 36. doi:10.1186/1743-0003-4-36