Engineering
Vol.09 No.10(2017), Article ID:79620,12 pages
10.4236/eng.2017.910050
Time Optimizing near the Pay Zone
Ali K. Darwesh, Thorkild Maack Rasmussen, Nadhir Al-Ansari
Department of Civil, Environmental and Natural Resources Engineering, Luleå University of Technology, Luleå, Sweden

Copyright © 2017 by authors and Scientific Research Publishing Inc.
This work is licensed under the Creative Commons Attribution International License (CC BY 4.0).
http://creativecommons.org/licenses/by/4.0/


Received: September 18, 2017; Accepted: October 13, 2017; Published: October 16, 2017
ABSTRACT
Well control techniques are used in oil and gas drilling operations to control bottom hole pressure and avoid any fluid influx from formation to the well. These techniques are highly important near the pay zone in term of time. Controlling formation fluid pressure and thereby the formations behavior in a predictable fashion will help toward more optimized environmental friendly drilling operation. Time consumed to control the formation fluid pressure will range between few hours to many days. This paper discusses hydrostatic pressure distribution and changes near the pay zone for one oil blocks in Kurdistan, in the northern part of Iraq. Obtaining homogeneous increase in some drilling fluid properties will help the engineer to better interpret sampling of the lithological columns and reduce potential hole problems and operation time.
Keywords:
Fluid Pressure, Well Control, Drilling Fluid, Formation, Pay Zone

1. Introduction
Implementing well control circulating techniques are the first and most proper responses to changes in pressures downhole. Driller method and Wait and wait method are the most popular Circulating well control techniques after those come concurrent and reverse circulation methods [1] .
Further advances in well-controlling systems appeared in term of non-circulating well control techniques like volumetric method and Bull heading methods. Up to date, all the evaluations for the controlling methods are based on faster and easier one to have sufficient weight to maintain hydrostatic pressure control by keeping bottom hole pressure (BHP) greater than formation pressure (FP); i.e. BHP ≥ FP to prevent kicks [2] .
The worst kind of kicks is gas kicks when the gas influx ignored or not detected on time. Gas will migrate to the borehole and then to the surface to make serious problems in most cases. Expanding uncontrolled, displacing fluid from the well leads to further reducing Hydrostatic Pressure (HP) and allowing more kick fluid to enter the circulating path. Gas kicks will expand quickly giving personal little and valuable time to think and react towards controlling the problem. Gas behavior and immiscibility depend on the type of fluid in use, pressure, temperature, pH, and the amount of time that the gas is exposed to the drilling mud. The volume that gas can occupy is related to the pressure in the gas (Boyle’s Law). If a gas is NOT allowed to expand, pressure stays constant except for changes in temperature.
There are serious consequences of allowing a well to get out of hand. Loss of human life, natural resources spell, environmental pollution and rig equipment damage are among the main losses we can face them when the well will be out of control, Figure 1 shows one of uncontrolled Bottom Hole Pressure (BHP) situation [3] .
Through close monitoring all operational related parameters, we can get indications of gas kicks. Based on the type of the parameters that have been monitored the next step will be evaluated to overcome the problem in term of time. So acting in time to changes in drilling fluid, fluid flow, pump pressure and speed, string rotation and pit gains needs quite close monitoring [4] . Kicks will develop mostly to well blow out, which means that we have very low-density mud to make a balance between the hydrostatic pressure and the formation pressure. There are many indicator events that make the crew be ready and start account the time for problem appear and solve it at a time, like these indicators:
1) Trip tank volume (gain) start to increase.
2) Mud flow rate speed increase.
3) Unstable drilling rate in short intervals.
4) The decrease of and pipe pressure.

Figure 1. Well blowout [3] .
5) The gas bubble starts to appear.
6) Continuous flows after shut down.
7) The sudden increase of total hook load.
Besides of all the above-mentioned indicators, there are also many other shared operational events that may be in sometimes be an indicator for gas influx or kicks. In most cases, the gas influx cannot be killed in by one circulation. Inefficient hydrostatic pressure and fluid displacement in the annulus make the controlling process more difficult with the increase in depth. For that the controlling the well within one circulation in most cases is impossible, and the dynamic controlling process will implement. Still, the most important point during the appearance of the first indicator remains to shut in the well directly for pressure reading. Then the normal routine steps will be keeping and increasing pumping rate, increase mud density 0.2 ppg to 0.4 ppg per circulation, check for flow after each complete circulation finally if still flowing, repeating the process.
For optimum operation, timing is important to modify mud properties with a safety margin. The aim of all modifications in the drilling fluid system is to reduce the numbers of mud circulation towards controlling the influx.
For a better understanding of time optimizing, we must know that the bottom hole and surface pressures are a summation of all exist pressures that are active in time. So, the bottom hole pressure is a combination of several types of pressures like FP, hydrostatic pressure (HP), circulating friction pressure and choke pressure. In general formation pressure (FP), hydrostatic pressure (HP) and circulating friction are constant during the initial stages of well control; the only way to change pressure will be by choke manipulation. Choke adjustments depend on the frictional properties of different fluids that go through it like the type of fluid, the rate of fluid flow, fluid density, fluid viscosity and gel strength. The two-main controlling the borehole pressure are circulating and non-circulating methods.
2. Circulation Methods
Most of the time is going to be spending near the pay zone to control the borehole pressure. When a kick occurs, the first action or response comes will be shutting the well-in and begin recording Static Initial Drill Pipe Pressure (SIDPP) and Static Initial Casing Pipe Pressure (SICP), until pressures stabilize, followed by the recording of pit gain. Depending on the killing method, we may begin with weighting-up mud in pits. The most purpose behind the weighting is to return the hydrostatic pressure balance between BHP and the formation pressure. Importance of the time optimizing starts with and when the new mud will be ready to circulate, hold choke (casing) pressure at its SICP value and slowly bring pump up to Kill Rate Speed (KRS). This pressure is the Initial Circulating Pressure (ICP) and must be held by adjusting the Kill Rate Pressure (KRP) until when/if kill fluid will be pumped. So, the original static drill pipe pressure (SIDPP) and the killing rate (KRP) will be our initial casing or annular pressure ICP.
In general, there are six types of well-controlling methods, some of them are considered as circulating methods and the other as non-circulating methods. Circulating techniques are like Driller, Engineer (Wait and Wait) and Reserve Circulation Methods. None circulating techniques are like Concurrent, Volumetric and Bullhead Methods [3] .
Driller’s Method is the most common and easier method to implement in killing gas kicks with high migration rates that may result in shut-in problems. This method used to remove kicks that are swabbed in during a trip out of the hole. It is also good to be used when not enough weighting material is available or when there is some shortage of personnel and/or equipment [5] . More time to kill the well is needed in this method rather than other methods. This method is not considered as an environmentally friendly due to the increase of pollution time also.
Wait and Weight method kills the kick faster and keeps wellbore and surface pressures lower and stable than any other method. This method requires good mixing facilities, full crews, and more supervision than most other methods. The first calculation that has to be done in this method is killing fluid density calculation. Fluid weight is increased before circulation begins. In this method also there are also many challenges in getting accurate data to make the crew success in killing the well in the first circulation.
Volumetric Method is a way of allowing controlled expansion of gas during migration. It controls volume with pressure (or vice versa) to maintain bottom hole pressure (BHP) equal or a little higher than FP.
3. Data Collection
After 2003 international oil companies started to work in more than 50 oil blocks in Kurdistan, North of Iraq. One of these blocks is Bazian block the red color in Figure 2. Bazian-1(Bn-1) was spudded in 2009 and finished in 2010 [6] .
Our case study is Bn-1 which was the first exploration oil well in Bazian block, there were no helpful offset data in relating to the Formation Pressure (FP) or Fracture Gradient (FG). Collected drilling operation data for this study was concentrated on the real field data related to the drilling, survey, and mud data. The nearest wells drilled in the area were KC1 and Meran West on west and east of Bn-1 as. Oil wells drilled in TaqTaq oil field to the northwest of Bn-1 were about far from the key study as can be seen in Figure 3. In general, KC1 and Miran West didn’t make a quite enough offset data due to some differences in the structural geology in the area. The main previously drilled sections information like drilled section size and casing setting depth are presented in Table 1. All the drilled sections of 30”, 20” and 13 3/8” were also not easy and were out of the plan. Problems like Loss of Circulations (LOC) in 20” section and fishing in 13 3/8” were dominant in the drilling operation. Because of those problems, a lot of time has been spent before we reach the section 9 5/8” in which there were

Figure 2. Oil blocks in Kurdistan region―Iraq.

Figure 3. Nearby oil wells to Bn-1.

Table 1. Drilled sections data.
also many problems like bridging and tight spotting which led to fishing and side trucking also in this section.
All daily drilling data reports, geological daily reports, and Mud Logging Unit (MLU) data, with close monitoring, has been performed for 9 5/8” section. The nearest oil well from the Bn-1 was KC it was dry, but the wells to the east were productive and the probability to face the gas zone was high.
4. Geological Prognosis
The Prognosis of formation thickness and top of formations is collected based on the drilled wells as bench marks and geological surveys. Stratigraphic column established as in Table 2 with the lithology and some more information. There was a good matching between what we had drilled and what we had collected from the drilling operation. Based on the Drilling and geological data indications the primary reservoir targets were expected to be in Shiranish, Kometan and Qamchuqalimestones. The secondary target will be the lower Jurassic and Upper Triassic. The drilling situation was the leader in most cases with all these data as in most exploration wells in the world.
5. Drilling Fluid Program
Although no information on pore and fracture pressure was available an attempt was made to design a conservative drilling fluid program with information gathered from offset data.
The Kolosh and Aliji formations have shown to be tectonically stressed as in the nearby KC-1 well and make a potential that this will be the case in Bn-1 also due to similarities in folding and faulting [9] .
The pore pressure follows the normal hydrostatic pressure profile at least to the bottom of the Cretaceous.
The Jurassic and Triassic formation may be slightly over-pressured. Limited borehole information is available due to the lack of well penetrating this deep [10] .
6. Formation Pressure Calculation
This information was not available in advance as an offset data. Calculations
Table 2. Formation tops and thicknesses.
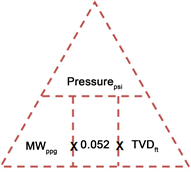
have been done to provide these data prior to start the drilling process. Accurate calculations for pore pressure for different penetrated geological formations till the target which was in Qamchuqa formation have been done using the Hydrostatic Pressure (HP) below.
(HP) = Mud weight (PPG) × 0.052 × TVD (ft) (1)
Also through the below triangle relation, we can emphasize the relationship of the hydrostatic pressure to the mud weight and the depth.
Different Formation Pressure (FP) have been calculated based on the hydrostatic pressure and Shut In pressure
After get Shut In Drill Pipe Pressure from the following relationship;
(FP) = (HP) + Shut-In Drill Pipe Pressure (SIDPP) (2)
Table 3. Calculated Pore Pressure Bn-1.
The result of the calculation was as below in Table 3.
7. Operation Review
In this paper, we discuss the time optimizing of the drilling operation near the pay zone in Bn-1 oil well as a case study. Many problems accrued to all the other drilled intervals, like LOC, fishing, and sidetracking. The main problem in the production section was how we can able to control the well due to the gas influx.
All the needed surface preparation has been made to control the well on the surface in case of an expected increase of BHP near the pay zone as in Figure 4. During the drilling operation, there was a lot of time spend to control the BHP due to the gas influx. The total of about 5 days with a full operation was spent to control the well. A similar scenario happened in many other oil blocks in Kurdistan. During the normal drilling operation from 2200 m down, there was an indication of Loss of Circulation (LOC) as was expected before from the prognoses information as shown in Figure 5. A lot of Loss Circulating Materials (LCM) was pumped in the upper part of the production section at 2200 m as the first reaction of LOC problem. The LOC made became a serious problem after the sliding drilling operation at 3630 m when the gain pit increased in volume of 10 bbls in a very short time which was the kicks. Shut in the well was the first response from the operation team and the driller. After that pit volume increased up to 10 bbls [7] . Shut-in the well and monitoring the pressure started as shown in Figure 4.
After seven circulation stages of using the driller method which took almost 51 hours the problem not controlled. In this section, there were pumping a lot of LCM to control LOC in the upper part and weighting of mud in the lower part to control the pressure. The increase of mud density from 8.6 ppg to 12.1 ppg linearly and change to other controlling techniques like Wait and Wait and Volumetric Method has been implemented to control the well. All the pressure changes of Drill Pipe Pressure (DDP), Circulation Pressure (CP), Pumping Rate

Figure 4. Bn-1 on-site surface preparation to control BH.

Figure 5. Expected LOC Interval.
in Stroke per Minute (SPM) and Loss Rate have been recorded with the spent time in hours. Figure 6 and Figure 7 show some stages of circulation to control records using the driller and volumetric methods respectively.
Driller and Volumetric Methods were implemented starting with increasing the mud density from 8.6 ppg to 12.1 ppg to control the well and reach the situation of SIDPP and SICP to be zero psi [8] . Due to the continuous increase in gas influx, the difference between the DDP and CP was very big. As in Figure 5, we can observe that when we increase the density from the 9.3 ppg to 9.5 ppg the gap between DDP and CP goes to increase in the state to decrease. The process of well controlling took 5 days and this was a high cost and increased the Non-Production Time (NPT) and environmental pollution also.

Figure 6. Well control parameters in the 1st circulation.

Figure 7. Volumetric attempt to control the kicks.
8. Operation Time
The drilling operation time spent to control the well was five days. Loss of Circulation (LOC) was dominant in the upper part of the production section after 2200 m and then kicks during the sliding drilling from 3630 m down. Pumping of Loss Circulating Materials (LCM) was pumped at the upper part of the section and an increase in pit volume up to 10 bbls [11] .
After seven circulation stages with different mud properties and pumping a lot of LCM to control LOC the well was not controlled totally [8] . Three different techniques have been implemented with a dramatic change in the mud density from th 8.6 pp to 12.1 ppg. Engineer and Volumetric Techniques also have been implemented to control the well. Figure 6 and Figure 7 show some stages of circulation to control the well using Driller and Wait and Wait for control technique.
Total controlling time was 5 days which leads to increase the cost and NPT overall. Table 4 shows the total time spent in implementing different Well Control Techniques to control the kicks.
9. Results
There are many well-controlling methods; each has its advantages or disadvantages in a location or drilling operation situation. Extending the setting point of the production casing pipes to deeper setting point between 3200 m to 3500 m in Shiranish formation will isolate the problematic interval more and more. Application of the Wait and Weight Method may even give us higher shoe pressures if the drill pipe pressure schedule is not calculated and followed properly.
Drilling near the pay zone and the liner section in Shiranish formation with new mud system of homogeneous increase of density, viscosity and gel strength makes the drilling operation safer and without a problem.
10. Conclusions
It is preferred that the hydrostatic pressure trend be in the middle between overburden pressure and pore pressure when the drilling operation be near the pay zone. The optimized operation can be reached when we put some safety margin on our overbalanced drilling operation depending on the amount of pore pressure. Performing some operations like reaming in and out and losing time in preparing drilling fluid will make the operation cost to increase exponentially
Table 4. Time spent to control the kicks.
when the formations near the pay zone contain more clay or shale.
Drilling long intervals with different geological properties above the pay zone make the fluid invasion controlling more difficult. Leaving the well-controlling decision until problems occur makes the operation cost much higher. Uncertainty in selections between well controlling methods also leads to more loss of valuable time. Low experience level of drilling personnel, limited field practice with well control methods are significant problems also.
Cite this paper
Darwesh, A.K., Rasmussen, T.M. and Al-Ansari, N. (2017) Time Optimizing near the Pay Zone. Engineering, 9, 848-859. https://doi.org/10.4236/eng.2017.910050
References
- 1. Bourgoyne Jr., A.T., Chenevert, M.E., Milheim, K.K. and Young Jr., F.S. (1986) Applied Drilling Engineering. Society of Petroleum Engineers, Richardson.
- 2. Gatlin, C. (1960) Drilling and Well Completions. Department of Petroleum Engineering, University of Texas.
- 3. Wild Well. Well Control Methods. http://www.wildwell.com/literature-on-demand/literature/well-control-methods.pdf
- 4. Skalle, P. (2011) Pressure Control during Oil Well Drilling. BookBoon.
- 5. Rabia, H. (2002) Well Engineering & Construction. Entrac Consulting Limited.
- 6. Alan131210. Kurdistan Oil & Gas Development, https://northerniraq.info/forums/viewtopic.php?t=5889
- 7. Darwesh, A. (2014) RIH Intermediate Section Casing in Bazian-1 Exploration Oil Well. WIT Transactions on Ecology and the Environment, 186, 559-569. https://doi.org/10.2495/ESUS140491
- 8. Saad, Z.J. and Jeremy, C.G. (2006) Geology of Iraq.
- 9. (2009) Korean National Oil Corporation K. Daily Geological Report. 21.
- 10. (2009) Korean National Oil Corporation, KNOC, Daily Drilling Reports. 3.
- 11. (2009) Korea National Oil Corporation, KNOC, MLU DATA, MLOG 0-3000.