Engineering
Vol.5 No.6(2013), Article ID:33266,5 pages DOI:10.4236/eng.2013.56066
Oil Transmission Pipelines Condition Monitoring Using Wavelet Analysis and Ultrasonic Techniques
School of Engineering, Manchester Metropolitan University, Manchester, UK
Email: wsabushanab@gmail.com
Copyright © 2013 Waheed Sami Abushanab. This is an open access article distributed under the Creative Commons Attribution License, which permits unrestricted use, distribution, and reproduction in any medium, provided the original work is properly cited.
Received February 19, 2013; revised March 21, 2013; accepted March 30, 2013
Keywords: Ultrasonic; Abaqus; Continuous Wavelet Transform (CWT)
ABSTRACT
In this paper, a reliable and sensitive diagnostic method for oil pipelines based on wavelet analysis and ultrasonic technique. This will be achieved by the use of 3-D finite element modeling software (Abaqus CAE 6.10) combined with a power full wavelet based signal processing technique will be used to collect the empirical ultrasonic data to validate the developed diagnostic method. The affect known seeded faults i.e., 1 mm hole at 25%, 50%, 75% and 100% depth in pipe wall were investigated using FEM techniques. A developed acoustic transceiver (Air Ultrasonic Ceramic Transducer 235AC130) will be used to collect the empirical ultrasonic data to validate the developed diagnostic method. The amplitudes and frequency spectra of the ultrasonic signals were measured and the predicted results were found to be in good agreement with the measured data, and that to confirm that this method can provide important information on pipe defects.
1. Introduction
Diagnosis of damage in pipelines requires the identification of the location and the type of damage and quantification of the degree of damage. Most of the recent damage detection methods rely on visual inspection or on localized measurements such as acoustic or ultrasound methods, magnetic field methods, radiography, eddycurrent methods and thermal field method which requires that the vicinity of the damage area is known a priori and that the portion of the structure being inspected is readily accessible [1]. Those methods can detect damage on or near the surface of the structure [2]. Piezoelectric ultrasonic has been utilized for wall thickness measurements and crack detection. These tools work well in liquid filled pipelines since the fluid being transported is coupling the pressure wave generated by the piezoelectric transducers to the pipe wall. However, in natural gas pipelines this coupling mechanism does not work since nearly all of the acoustical energy generated by the transducer in the gaseous product is reflected by the pipe wall and does not travel into the pipe wall [3]. The ultrasonic sensor generates ultrasonic waves inside the pipe wall itself through a combination of Lorentz forces and magnetostriction, no matter what medium is present in the pipe [4]. The material being inspected is its own transducer, eliminating the need for a liquid coupling as required in traditional ultrasonic transducer methods [4]. Hu et al. [5] carried out a case study that shows the application of harmonic wavelet analysis to the problems of pipeline small leak detection with time-frequency domain analysis. A comparison was made between leak detection results of harmonic wavelet and Daubechies wavelet and it was found that harmonic wavelet based small leak detection approach performed better. Meurer et al. [6] used Lamb wave propagation in the wall of a pipe generated in a standoff manner for defect detection and found that this approach is accurate measurement of wall thickness on all kinds of materials and size only at the point of physical contact and not along the circumference of the pipe. Sun et al. [7] used the ultrasonic techniques based sensing network for underground pipeline monitoring by jointly utilizing the measurements of different types of sensors that are located both inside and around the underground pipelines. The magnetic induction-based sensor detects and localizes leakage throughout the pipeline network and reported to the administration center in real-time-guided waves and was not affected significantly by the presence of insulation. In the research mentioned above, it was noted that no rigorous analysis on ultrasonic techniques technology was carried out and its capabilities are not yet fully investigated. The research proposed here focuses on developing finite element model to understand ultrasonic techniques advantages and limitations and pave the path for developing reliable oil pipes diagnosing systems.
2. Numerical Simulation
The elastic-plastic brick elements in Abaqus are intended to provide inexpensive solutions for problems involving part-through surface cracks in shell structures loaded predominantly in Mode I by combined membrane and bending action in cases where it is important to include the effects of inelastic deformation. When the brick element model reaches theoretical limitations, the shell-tosolid sub modeling technique is utilized to provide accurate J-integral results. The energy domain integral is used to evaluate the J-integral for this case.
3. Geometry and Model
The pipe has an inside radius of 2.15 mm, wall thickness of 3.5 mm, and 1m long. The mesh is shown in Figure 1. Four of flaws have ratios of 0.25 (a shallow crack), 0.5 and 0.75 (a deep crack) and it’s refined around the crack by using multi-point constraints (MPCs). The shell elements type is C3D8R in the symmetric of 8-node linear brick along the crack. Five different flaws are studied. All have the semi-elliptic geometry and in all cases.
4. Material
The pipe is made of an elastic-plastic metal (Carbon Steel Pipe), with a Young’s modulus of 2 GPa, a Poisson’s ratio of 0.3, an initial yield stress of 482.5 MPa, and constant work hardening to an ultimate stress of 689.4 MPa at 10% plastic strain, with perfectly plastic behavior at higher strains.
5. Loading
The loading consists of uniform internal pressure applied to all of the shell elements, with edge loads applied to the far end of the pipe to provide the axial stress corresponding to a closed-end condition. Even though the flaw is on the inside surface of the pipe, the pressure is not applied on the exposed crack face. Since pressure loads
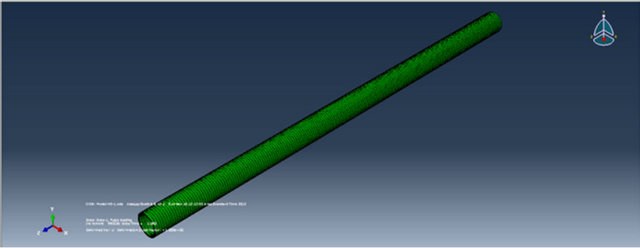
Figure 1. Pipe meshing.
on the flaw surface of brick elements are implemented using linear superposition in Abaqus, there is no theoretical basis for applying these loads when nonlinearities are present. I assume that this is not a large effect in this problem. For consistency with the brick element models, pressure loading of the crack face is not applied to the shell-to-solid sub-model.
6. Modelling Results
The brick elements provide J-integral values directly. Figures 2 and 3 show the J-integral values and the strain at the whole model as functions of applied pressure for the four flaws and healthy. In the input data the maximum time increment size has been limited so that adequately smooth graphs can be obtained. Figures 2 and 3 shows the displacement of specific node at the end edge of pipe for the half-thickness crack (3_a/t = 0.5), at pressure levels. The results are agreed closely to experimental results.
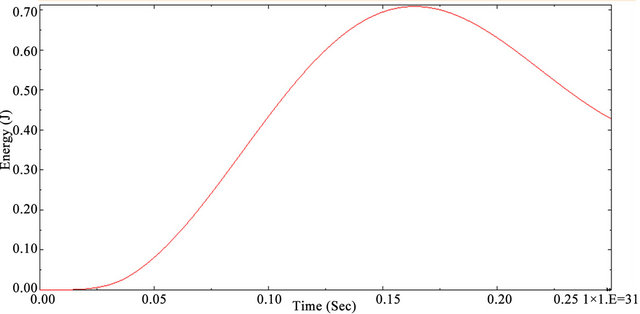
Figure 2. Healthy pipe strain energy, whole model.

Figure 3. 50% Whole model strain energy.

Figure 4. Shows the aluminium stand and sensor set angle of 70˚.
7. Experimental Procedures
Series of experiments were carried out to investigate the propagation of ultrasound wave signal from a real 1 meter length healthy carbon steel and other real four 1 meter length carbon steel pipes with seeded 1mm hole at vary depth in each pipe and sources to an array of sensors. The overall purpose was to evaluate the potential of ultrasound monitoring to be used in real piping systems, acknowledging the effects of external (support, burial) environments may have on the propagation of the waves. To this end, five sets of experiments were carried out where the nature of the source and the environment were varied in a systematic way.
Five carbon steel pipes were used in research experiments. All pipe are from the same materials and has the same diameters that shown in Table 1 below.
Five sets of experiments were carried out with the pipes suspended on aluminium stands in order to obtain a preliminary indication of the type of propagation behaviour shown by a wave generated from a simulated source. Sensor was mounted from one end of the pipe at 70˚ angle which is the best angle that shows clear result, whilst the other sensor was incrementally moved axially along the pipe to the other end at the same angle as shown at Figure 4.
8. Experiments Results
A time domain signatures of oscilloscope results for the five experimental sets (healthy, 1mm hole at 25% 50% 5% and 100% in depth) was recorded by Mat lab software and shows no clear differences as shown in Figures 5 and 6 (zoom in) respectively.
Based on the results of time domain signatures above, A frequency domain signatures of oscilloscope results for the five experimental sets (healthy, 1mm hole at 25% 50% 75% and 100% in depth) was recorded by Mat lab software and shows no clear differences as shown in Figure 7.
As a result, a continuous wavelet transform (CWT) is used to divide a continuous function into wavelets, which shows clear differences in Figure 8.
9. Summary of Experiments
The frequency and angle of a specific Lamb wave mode was selected based on two aspects; first, incident angle for mode is equal to transducer frequency multiplied by material thickness and second is that ultrasonic and longitudinal velocities in the steel pipe and Lucite wedge which measured by be found that 70˚ degree present the best signal with transducer with an oscilloscope and ultrasonic pulsar/receiver frequency of 235 KHz.

Figure 5. Time domain signatures for the five set of research experimental results.

Figure 6. Time domain signatures for the five set of research experimental results (zoomed).
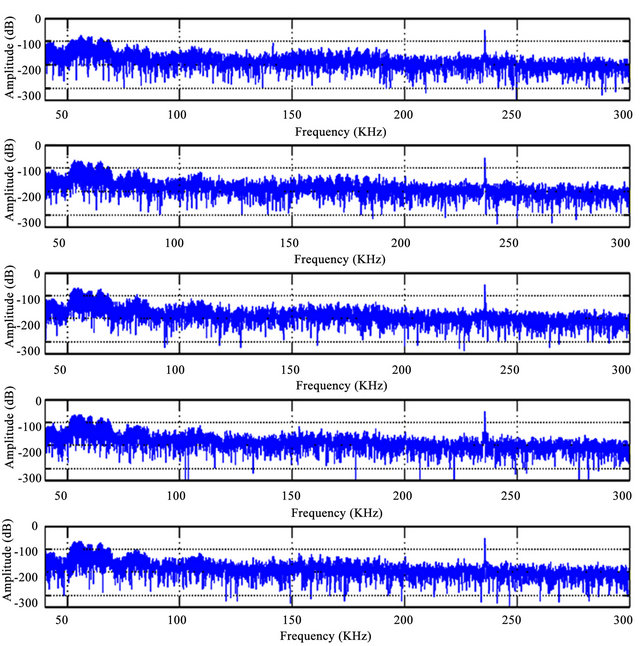
Figure 7. Frequency domain signatures for the five set of research experimental results.

Figure 8. CWT signatures for the five set of research experimental results.
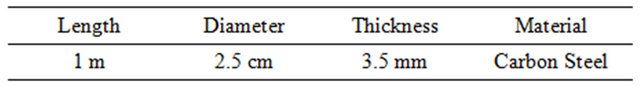
Table 1. Experimental five sets of pipes diameters.
The Time/Frequency domain are insufficient analyses as shown in Figures 5-7 for since all signatures doesn’t shows any differences between each cases, while CWT signature (Figure 8) is to be considered a sufficient analyses and the novelty of the research since red colour density that present the energy is increase in directly proportional to the increase of the depth of the hole.
REFERENCES
- A. Carvalho, J. Rebello, M. Souza, L Sagrilo and S. Soares, “Reliability of Non-Destructive Test Techniques in the Inspection of Pipelines Used in the Oil Industry,” International Journal of Pressure Vessels and Piping, Vol. 85, No. 11, 2008, pp. 745-751. doi:10.1016/j.ijpvp.2008.05.001
- J. Laibin and Z. Wei, “Detection of Small Leakage from Long Transportation Pipeline with Complex Noise,” Journal of Loss Prevention in the Process Industries, Vol. 24, No. 4, 2011, pp. 449-457.
- D. Sinha, “Acoustic Sensor for Pipeline Monitoring,” Los Alamos National Laboratory, 2005. http://www.netl.doe.gov/technologies/oil-gas/publications/td/FWP 02FE05_0705Report.pdf
- M. klann and T. Beuker, “Pipeline Inspection with the High Resolution Ultrasonic Ili-Tool: Report on Field Experience,” Proceedings of the 6th International Pipeline Conference, Calgary, 25-29 September 2006.
- C. R. Fuller and F. J. Fahy, “Characteristics of Wave Propagation and Energy Distribution in Cylindrical Elastic Shells Filled with Fluid,” Journal of Sound and Vibration, Vol. 81, No. 4, 1982, pp. 501-518.
- T. Meurer, J. Qu and L. Jacobs, “Wave Propagation in Nonlinear and Hysteretic Media—A Numerical Study,” International Journal of Solids and Structures, Vol. 39, No. 21-22, 2002, pp. 5585-5614. doi:10.1016/S0020-7683(02)00366-9
- Z. Sun, P. Wang, C. Mehmet, M. Al-Rodhaan and A. AlDhelaan, “Magnetic Induction-Based Wireless Sensor Networks for Underground Pipeline Monitoring,” AD Hoc Networks, Vol. 9, No. 3, 2010, pp. 218-227.