Engineering
Vol. 3 No. 1 (2011) , Article ID: 3719 , 4 pages DOI:10.4236/eng.2011.31003
Heat Source Analysis of Hard Disk Drives with Different Wall Conditions using Infrared System
1School of Mechanical and Aerospace Engineering, College of Engineering, Nanyang Technological University, Singapore;
2The Australian School of Advanced Medicine, Macquarie University, Sydney, Australia;
3Product Engineering Department, Hitachi GST Pte Ltd, Singapore
E-mail: mykng@ntu.edu.sg
Received August 6, 2010; revised October 8, 2010; accepted October 11, 2010
Keywords: Heat Transfer; Infrared; Hard Disk Drive; Heat Source Analysis; Heat Sink Conditions
ABSTRACT
Increasing performance parameters of hard disk drive (HDD) such as higher capacity and faster data access speed with decreasing physical size make HDD more susceptible to thermal effects. Contact temperature measurement using thermocouple is not suitable for the rotating platter of HDD. Heat analysis using simulation software requires accurate initial parameter setting such as thermal (initial & boundary) conditions of certain regions. Temperature measurement using infrared (IR) system avoids these limitations; it is non-contact, responsive and does not require initial parameter setting. Thermal pattern distribution can be studied from the thermal images. However, emissivity of the target has to be known and calibration of the system is essential for accurate temperature reading. This paper showed that temperature within the HDD increases with ambient temperature and time, but the thermal distribution pattern in the HDD was not affected by different ambient temperatures. Three wall boundary conditions were conducted to study the thermal distribution pattern in the HDD. A solution was then proposed based on the results obtained from the experiments to improve the heat transfer rate and steady state temperature, and reduce the detrimental effects from high thermal generation in future prototypes. Another important finding was that the averaged temperature of the head cap was generally higher compared to that of the disk, as the spindle motor is the primary heat source within the HDD. Heat source analysis of HDD with IR system allows designers to have better visibility of the temperature generated in different components of the HDD. Proper cooling may enhance disk life as well as ensure the stability and integrity of the system.
1. Introduction
Modern computer systems demand high-capacity HDD storage devices with short access time and small physical dimensions. As of July 2008, the capacity of HDDs has reached 1.5 terabyte, making the largest jump in capacity in the history of hard-disk development [1]. The fastest “enterprise” HDD spins at 15,000 rpm, and are able to achieve sequential media transfer speeds above 1.6 Gbit/s [2]. HDD’s form factor has also been reduced from “8 to 0.85” over the past 25 years.
The primary way to decrease access time and increase storage capacity is to increase rotational speed and area density on the magnetic disks. These developments inevitably expose HDDs to thermal effects such as the irregular and inefficient heat distribution that may affect HDDs performance and reliability. In the worst case, disk failure could result in disastrous loss of data. One of the possible causes of disk failure is due to thermal effects. Thus it is important to study the temperature distribution and heat transfer in the HDD for the future development of highly reliable and efficient HDDs. Some of these thermal related problems include thermal expansion [3-6], thermal protrusion on the air-bearing surface (ABS) [7] and higher heat dissipated from high speed spindle motor [8].
Conventional temperature measurement using thermocouples or other probe type sensors is not suitable for HDD as the platter of HDD is moving which may risk breaking the lead wires. In addition, the temperature monitoring method has to be responsive to the dynamic changes of heat transfer in the HDD. The study of thermal effects of the HDD with simulation software such as STEAM [8] and ANSYS version 10.0 [9] also require accurate parameter setting of initial and boundary conditions. This paper presents experimental data and analysis of the heat transfer and heat distribution in HDD using the infrared (IR) system. A non-contact and responsive method of monitoring hard disk temperature which does not require initial parameter setting is examined. Possible heat source in running HDDs is investigated experimentally instead of mathematical analysis using IR system with proper calibration and emissivity setting.
2. Literature Review
2.1. Measurement Theory
2.1.1. Radiation and Blackbody
Electromagnetic radiation (any object with temperature of above absolute zero, –273oC) may be viewed as energy propagation in the form of a wave, in energy packets called photons. For radiation propagation in a particular medium, the standard wave properties of frequency f and wavelength l applies: f = c/l where c is the speed of light. The IR region of the EM spectrum is not visible to the human eye as the energy of the photon is too low to elicit a response. Light of 700 to 3,000 nm is generally called near IR and longer than 20 μm (20,000 nm) to 1,000 μm is called far IR.
The black body is an ideal surface. It absorbs all incident radiation, regardless of wavelength and direction. For a prescribed temperature and wavelength, no surface can emit more energy than a blackbody which is a diffuse emitter [10]. As a perfect absorber and emitter, the blackbody does not reflect or transmit any IR energy. It serves as a standard against other actual surfaces to which their radiative properties can be compared.
A blackbody’s spectral emission power has the form of:


where h, k and c are Planck Constant, Boltzmann constant and speed of light respectively.
2.1.2. Surface Absorption, Reflection, Transmission and Emissivity
For a semi-transparent object such as glass, acrylic or thin clear plastic, part of the IR energy striking the object surface will be absorbed, a portion transmitted and the remaining will be reflected. Therefore, a (absorptivity) + r (reflectivity) + t (transmissivity) = 1.0. The absorption and transmission of a semi-transparent material are dependent on material thickness. The transmission of a partially transparent material decreases with increasing thickness. If the reflectivity remains constant, the absorption, and hence, emissivity increases as the transmission decreases. As more IR energy is being absorbed, more IR energy will be emitted. In the case of most solid objects which are opaque to the human eye, transmission is zero as IR energy cannot pass through the object.
Real surfaces do not emit all radiation as described by Planck’s blackbody radiation law. Instead, they emit a fraction of it, given by emissivity of a surface as the ratio of the radiation emitted by the surface to the radiation emitted by a blackbody at the same temperature. Different materials have different emissivities, and will therefore emit IR at different intensities for a given temperature in which the IR detector will response differently to the objects’ radiation. Therefore, the temperature of an object cannot be determined by simply measuring its emitted IR energy, the object’s emissivity must also be known. The apparent emissivity, as received by the detector, is affected by the wavelength sensitivity of the sensor and the emission angle. It is important that correct adjustment of the IR measuring device to the target emissivity is done to ensure accurate temperature reading.
2.2. Hard Disk Drive (HDD)
A HDD is a sealed device which stores digitally encoded data on rapidly rotating platters with magnetic surfaces. HDD record data by magnetizing ferromagnetic material directionally, to represent either a 0 or a 1 binary digit. The data is read by detecting the magnetization of the material.
Figure 1 shows a typical HDD unit, which consists of a spindle motor that holds one or more flat circular platters, onto which the data is recorded. These platters are made of a non-magnetic material, usually aluminum alloy or glass, and are coated with a thin layer of magnetic material.
The platter is spun at very high speed where the information is written to a platter as it rotates past device called read-and-write head that operates up to nanome-
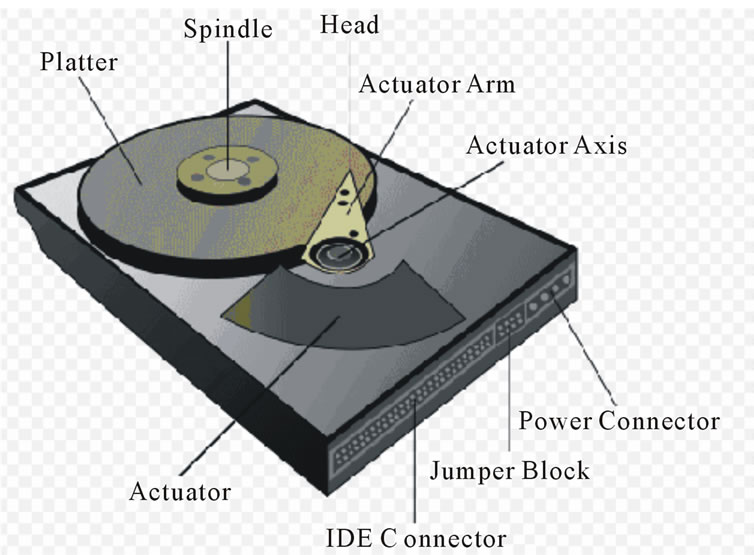
Figure 1. Diagram of a typical HDD.
ters over the magnetic surface. The read-and-write head is used to detect and modify the magnetization of the material immediately under it.
An actuator arm (or access arm) moves the readand-write head radically across the platter as they spin, allowing each head to access almost the entire surface of the platter as it spins. The read/write head is kept from contacting the platter surface by an air cushion called the air bearing that is extremely close to the platter. To achieve high recording density beyond 1 Tbit/in2, slider disk spacing can be as close as 10 nm. As a result, the thermal effect at the interface can be a big issue because any excessive heating might cause significant structural distortion, which results in hard disk failure. Therefore it is crucial to understand the heat transfer process across the interface and the effect of several key parameters on this process so that a more reliable design can be proposed.
2.3. IR Measurement System
A typical IR system consists of 4 important components. They are mainly the target object, atmosphere through which the IR emits, detector, display and interface for further analysis of data. Target in the IR system is the object to be measured. Atmosphere in terms of gases, water, vapour and other aerosols in the sight path of the sensor affects the temperature reading due to atmosphere attenuation. The function of the lens is to focus the IR energy on to the detector and the detector converts the IR energy received to an electrical signal that can be displayed in units of temperature (Figure 2).
The surrounding area temperature is the background of the target and it reduces the accuracy of the IR temperature reading of the target due to stray radiation emitted by the environment surrounding. A blackbody reference source is used to calibrate the IR system; its internal
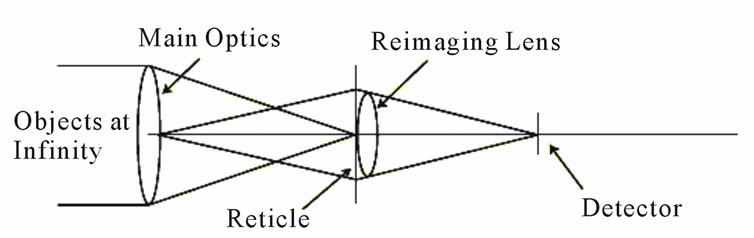
Figure 2. Example of an optics configuration of an IR system.
heated cavity provides a target of known temperature and is designed to closely approach a blackbody unity emissivity.
To assure accurate IR temperature measurement, the following points must be considered: 1) Field of View, 2) Environmental Conditions [11], 3) Ambient Temperatures and 4) Emissivity. The field of view is the angle of vision at which the IR system operates, and is determined by the optics of the unit. The optical system of an IR sensor collects the IR energy from a circular measurement spot and focuses it on the detector. Optical resolution is defined by the ratio of the distance from the IR system to the object, compared to the size of a spot being measured (D/S ratio). The larger the ratio the better the instrument's resolution, and the smaller the spot size can be measured from a greater distance. To obtain an accurate temperature reading, the target being measured should completely fill the field of view of the IR device, otherwise stray radiation from the background will affect the accuracy of the temperature reading [12].
Emissivity of the object being measured must be known and incorporated into the measurement so that accurate data can be obtained. The effective emissivity ε* is obtained from determining the emissivity of each component in the HDD (Aluminum base plate, disk, spindle motor, logic board) experimentally.
There are five ways to determine the emissivity of a material to ensure accurate temperature measurements [13-15]:
1) Heat a sample of the material to a known temperature, using a precise sensor, and measure the temperature using the IR instrument. Then adjust the emissivity value to force the indicator to display the correct temperature.
2) For relatively low temperatures (up to 260°C), a piece of black masking tape, with an emissivity of 0.95, can be measured. Then adjust the emissivity value to force the indicator to display the correct temperature of the material.
3) For high temperature measurements, a hole (depth of which is at least 6 times the diameter) can be drilled into the object. This hole acts as a blackbody with emissivity of 1.0. Measure the temperature in the hole, and then adjust the emissivity to force the indicator to display the correct temperature of the material.
4) If the material, or a portion of it, can be coated, a dull black paint will have an emissivity of approx. 1.0. Measure the temperature of the paint, and then adjust the emissivity to force the indicator to display the correct temperature.
5) Standardized emissivity values for most materials are available. These can be entered into the instrument to estimate the material’s emissivity value.
3. Experimental Approach
3.1. Experimental Set-Up
3.1.1. Determining Key Components’ Hot Spots Using Thermal Distribution of HDD
Key components with possible hot spots were determined within the HDD; the HDD’s thermal distribution image was obtained using an IR system at 24 ± 0.1°C ambient temperature. An original metallic cover of the HDD has to be removed. Instead of using a transparent acrylic cover, a thin transparent film (food wrap) is used to achieve a better estimation of the internal thermal distribution released by the HDD. The secondary heat source radiated from the surrounding is much lesser compared to the heat source from the HDD and negligible [13].
The thermal distribution of the HDD was captured using AVIO IR system (TVS-2,000 MKII, spectral range of 3-5.4 µm, temperature resolution of 0.1°C at 30°C blackbody, accuracy ±0.4%: full scale) with post-processing thermal software, PicEd Avio Ver 4.05 from NIPPON AVIONICS Co. LTD (see www.avio.co.jp). The central processing unit (CPU) was used to power up the HDD. During operation, the disk was spinning at 15,000 rpm and was secured with a clamp. The heat shield was used to minimize the influence of surrounding heat sources or cold draft to the measured HDD temperature. The heat shield’s black interior was to reduce the reflection of light.
The camera head of the IR system was placed 50 cm from the HDD as the system has a minimum focus distance of 20 cm [14]. In addition, the background should not have any hot spot which might be reflected off the plastic cover surface and thus affecting the measurement.
To determine the duration of each experiment, the HDD was set to run at a controlled ambient temperature of 24 ± 0.1°C (unless otherwise stated) with same operating condition. The steady state temperature of the HDD was reached at 60 minutes which was close to the 50 minutes as reported in [16,17]. Time duration of 60 minutes was thus used for all subsequent experiments in this study.
The captured thermal images of the HDD at 10 and 60 minutes have a similar thermal pattern, suggesting that regions which were exposed to higher temperatures included the spindle with head cap and the disk (Figure 3).
3.1.2. Determination of Emissivity
There is an equivalent emissivity at a certain wavelength and temperature, normally the emissivity does not change with temperature unless there is a drastic temperature variation. However, emissivity does changes with wavelength, as such when determining emissivity of a targeted surface, it is critical to comply at the wavelength of which, the temperature of that surface will be taken [18]. For this experiment, both the black tape and the thermocouple methods were used to determine the emissivity of a targeted surface. Each method was performed using three different temperatures, which will be further elaborated subsequently.
Two sets of parameters with three emissivities each were determined using the black tape and thermocouple methods. Each set was averaged to obtain the mean value. The two averaged emissivity obtained using the two different methods were then compared to further verify the accuracy of both methods. Both average emissivities were used if their values were within the same order of magnitudes.
To determine the emissivity of a targeted surface, the surface was heated to at least 38°C above ambient tem
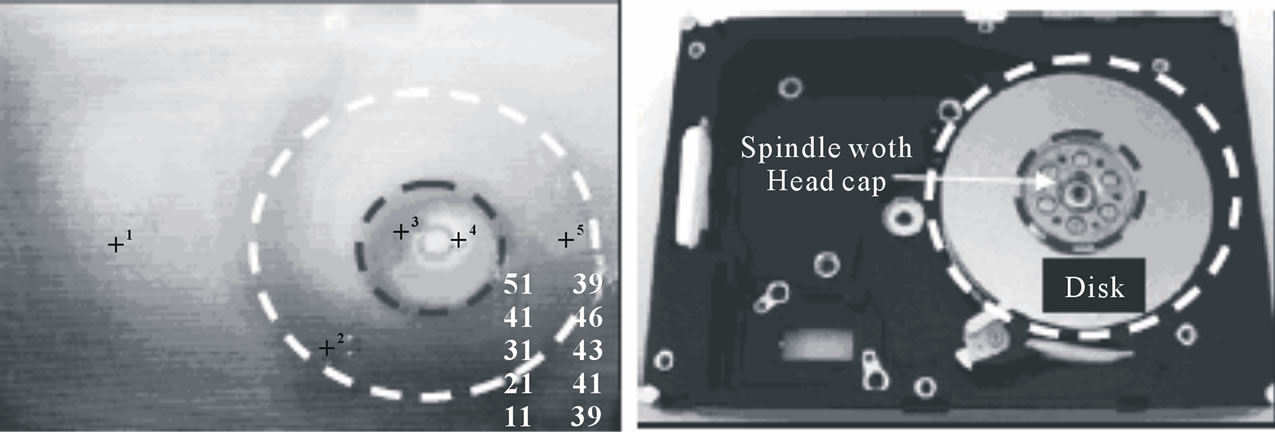
Figure 3. Identifying the key components with hot spots.
perature. For this experiment, the disk was heated to 99°C, 85°C and 75°C (taking ambient as 24°C) using the hotplate. The black tape was then measured using the emissivity setting of 0.97 (value of black tape) as shown in Figure 4.
Once the temperature of the black tape was determined to be 99.03°C and since the disk was uniformly heated up, the temperature for the black tape and uncoated portion should be the same. As such, by adjusting the emissivity so that the disk temperature at point 2 (uncovered region) shows about 99°C, the emissivity of 0.27 was obtained. The aforesaid procedure was repeated for 85°C and 75°C and both experiments resulted in the same emissivity of 0.27.
After heating the disk on the hotplate, a thermocouple was used also to determine the temperature of the disk surface. For the first experiment, the disk was heated using the hotplate and its temperature determined by the thermocouple was 99.92°C. The emissivity to provide the closest possible temperature to 99.92°C was determined to be 0.27. The disk was heated up again to 85°C and 75°C with emissivities of 0.26 and 0.28 being obtained respectively. The final glass disk emissivity value of 0.27 was thus determined.
Since the emissivity obtained by either black tape or thermocouple method produced identical result, only the black tape method was used to determine the emissivity of the head cap, which gave an averaged value of 0.24.
A food wrap has high transmission for a wide range of wavelengths. To obtain its transmissivity, a heat source (hot plate) was placed behind each film (without contact) to determine the temperature deviation from the actual heat source when the IR is used to measure through them. The experimental setup for determining the transmissivity of the plastic wrap is illustrated in Figure 5.
The temperature of the hotplate was measured by setting the emissivity at 0.94 obtained from the black tape
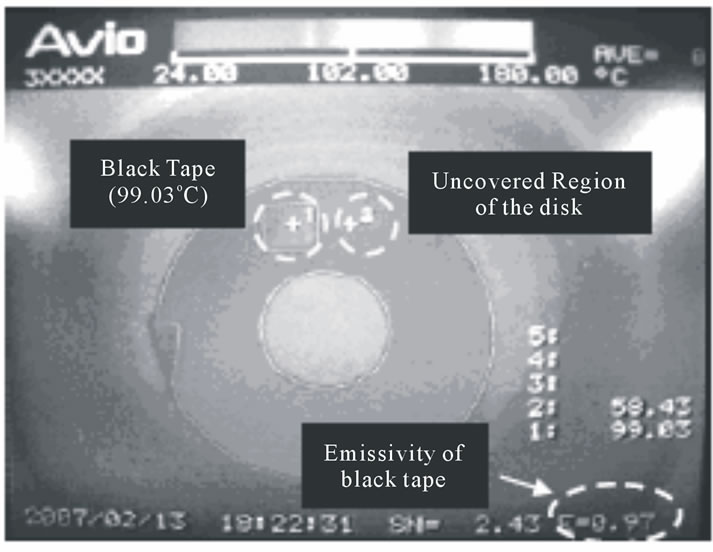
Figure 4. Measuring the black tape temperature for disk emissivity.
method. The measured average temperatures of the hotplate for 40°C setting via IR system without and with food wrap were 41.52 and 40.29°C, respectively with temperature difference of 1.23°C. The measurement was repeated twice using 50 and 60°C hot plate baseline temperatures and the temperature differences were determined to be 1.68°C and 1.81°C, respectively. The deviation averaged between the three different temperature settings (40, 50 & 60°C) was not significant at 1.57°C. Since the HDD components were not subjected to drastic temperature changes, a value of 1.57°C was to be added to all temperatures measured through the food wrap cover.
3.2. Measuring the Thermal Distributions of HDD
The HDD was operated at 12 different ambient tempera ture settings (4°C, 8°C, 12°C, 16°C, 20°C, 22°C, 24°C, 26°C, 28°C, 30°C, 34°C and 38°C) in an environmental
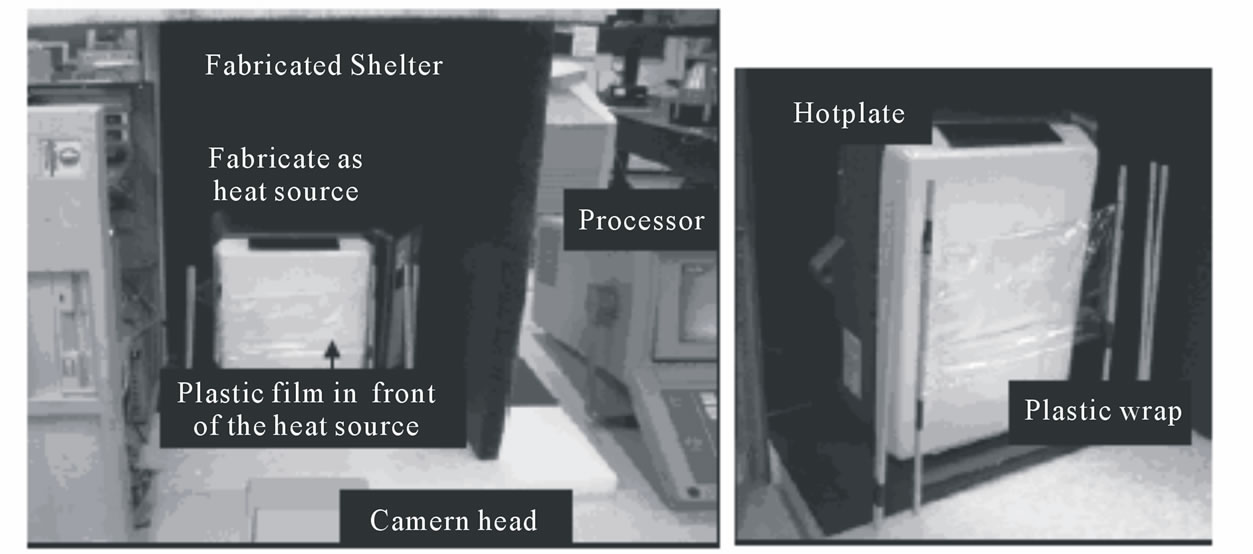
Figure 5. Experiment set-up for determining the transmissivity of food wrap.
chamber. For each ambient temperature, the HDD thermal distribution and temperatures of the disk and head cap were determined at an interval of 5 minutes for duration of 60 minutes.
Figure 6(a) shows a typical thermal image of the head cap where five points were selected to monitor its overall temperature. Points 1 to 4 measured the temperatures registered at four different positions on the head cap and their averaged temperature implied the temperature of the head cap at 5 minutes intervals. Point 5 was selected to determine the temperature of the region near the shaft of the spindle which contributes to the heat built up on the head cap. Five points were also selected to measure different portions of the disk as shown in Figure 6(b).
4. Results & Discussion
4.1. Effect of Ambient Temperature on the HDD Heat Pattern
Comparing the thermal distributions obtained at the ambient temperature of 20˚C to that of the 30°C (not shown here), regions that experienced high temperature were similar. Ambient temperature affects the temperature within the HDD but not the trend of thermal distribution within the HDD.
4.2. Wall Condition 1: Insulation Effect on Thermal Distribution of HDD
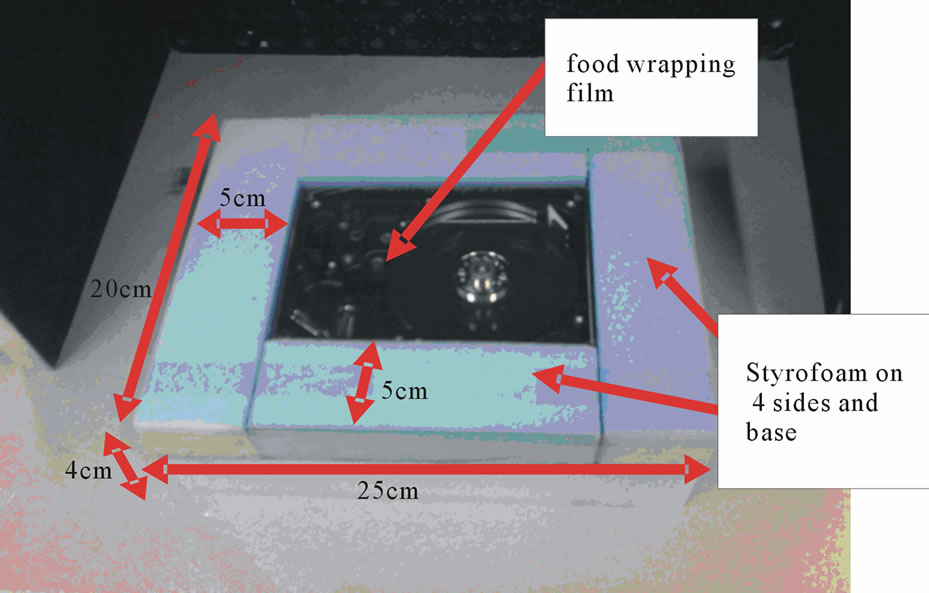
The insulated effects were achieved by mounting a thick layer of Styrofoam (20 × 25 × 4 cm) with conductivity of 0.033 W/mK. Styrofoam was mounted in contact with the HDD to minimize conduction and convection (zero heat flux) effects from the sides and the base of the HDD (Figure 7). Thermal distribution of the HDD was measured with food wrap being used as the cover for the HDD and the logic board and the spindle motor as the heat sources.
Figure 8 shows the location of the points in the IR camera for measurement in all the three experimental wall conditions. The temperature of disc reaches steady state at 110 mins at 37.5˚C (on points F, G, H, I, J). The temperature of HDD base however reaches steady state at 120 mins at 50˚C (on the points A, B, C, D, E).
4.3. Wall Condition 2: Effects of Aluminum Base Plate Conduction with 3 HDD Sides Insulated
A large aluminum plate (44 × 31 × 2.5 cm) was attached on the base of the HDD. It is approximately 3 times the size of the HDD. The 4 sides of HDD are insulated by Styrofoam of conductivity (K = 0.033 W/mK) while the large aluminum plate with the conductivity of 250 W/mK is attached to the HDD base.
The temperature of disc reached steady state at 20 mins at 30.3°C (on points F, G, H, I, J). The temperature of HDD base however reached steady state at 40 mins at 38°C (on points A, B, C, D, E).
4.4. Wall Condition 3: Effects of Base Cooling Plate but without All the Side Insulation
Set up of condition 3 is similar to condition 2 but without the 4 side insulation of HDD. Again, aluminum base plate is attached to the HDD base.
The temperature of disc reached steady state at 20 mins at 30.84˚C (on points F, G, H, I, J). The temperature of HDD base reached steady state at 40 mins but at 32.15˚C (on points A, B, C, D, E).
4.5. Comparison between the Temperature Distributions under the 3 Different Wall Conditions
Figure 9 shows the disc average temperature under the 3 experimental conditions. When fully insulated (wall condition 1), it takes longer time (120 mins) for the temperature to reach steady state of 37.5˚C. The disc temperature under condition 1 is the highest among the 3 conditions since heat transfer through conduction and convection was kept to minimum from the sides and the base, radiation heat transfer mode is dominant here.
Wall condition 2 was conducted by insulating the 4 sides of the HDD, but allowing conduction through an aluminum base cooling plate. By introducing a condition path, it is observed that temperature of the disc reached steady state at 30.5˚C at 40 mins. There is a temperature reduction of 7.5˚C and thus a higher heat transfer rate.
Wall condition 3 allows convection on the 4 sides of the HDD as well as conduction through the base of the HDD. Though there is an improvement in lower steady state temperature at 29˚C and reached in 20 mins, however, the effects of convection do not have the significant impact on the heat losses from the disc.
Figure 10 shows the average temperature of the 3 experimental conditions on the HDD base. Condition 1 shows that it takes longest time for the temperature to reach steady state of 50˚C at 110 mins. Similar to the disc, the temperature of the HDD base in condition 1 is the highest among the 3 tested conditions and that radiation heat transfer is dominant here.
With wall condition 2, it is observed that temperature of the base reaches steady state at 38˚C at 55 mins. There is a temperature reduction of 12˚C and a higher heat
 (a)
(a) (b)
(b)
Figure 6. Thermal image of (a) head cap; (b) disk surfaces.
 (a)
(a)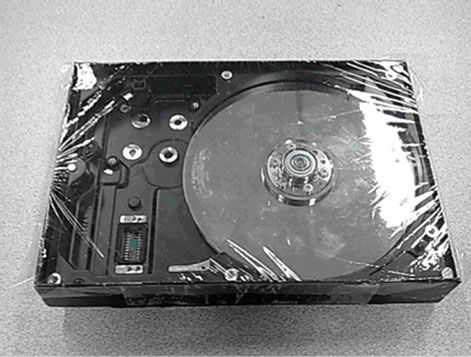 (b)
(b)
Figure 7. HDD with (a) sides and base insulated with Styrofoam; (b) food wrap on HDD.
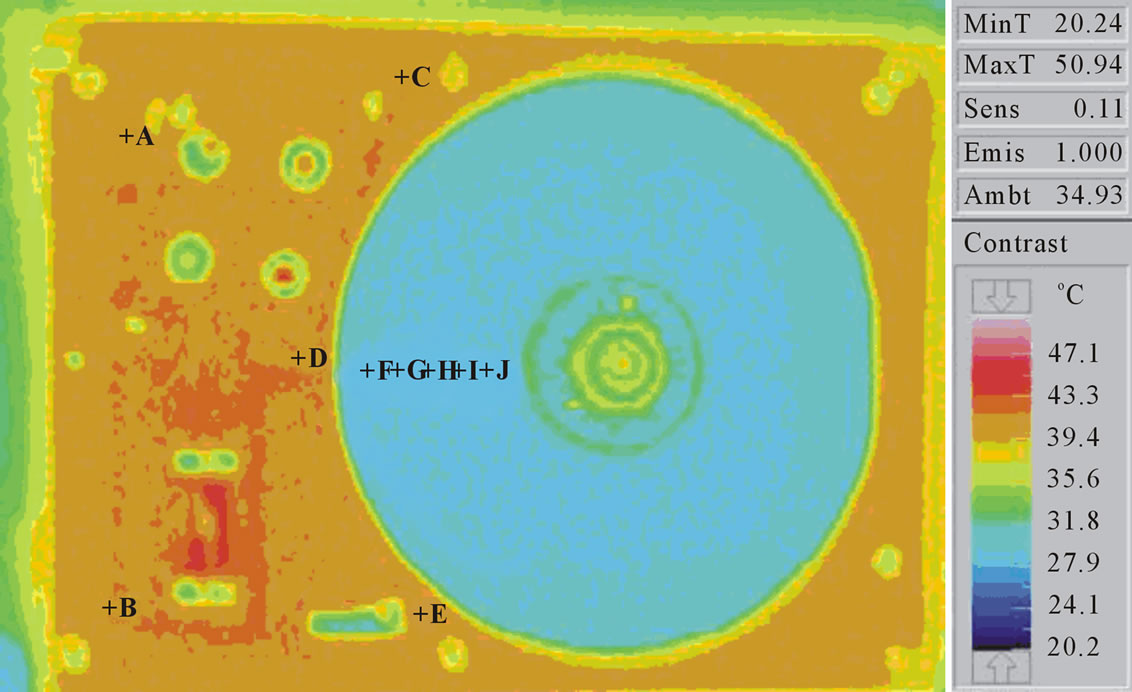
Figure 8. Temperature distribution of HDD at 30 mins.
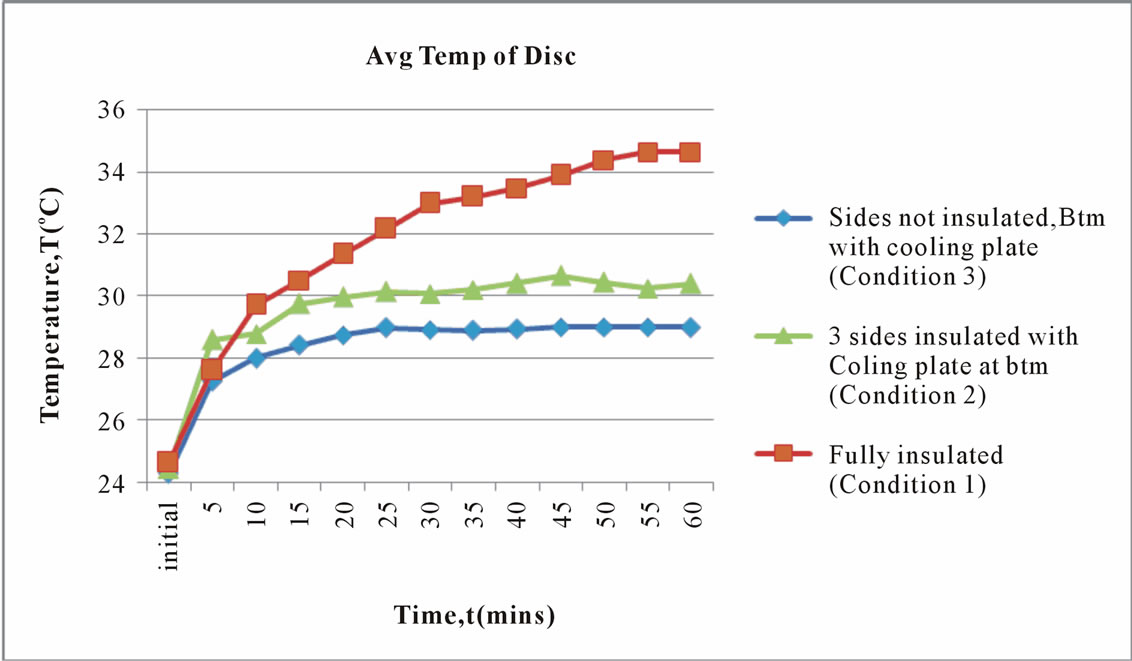
Figure 9. Average temperature of disc under the 3 different wall condit-ions.
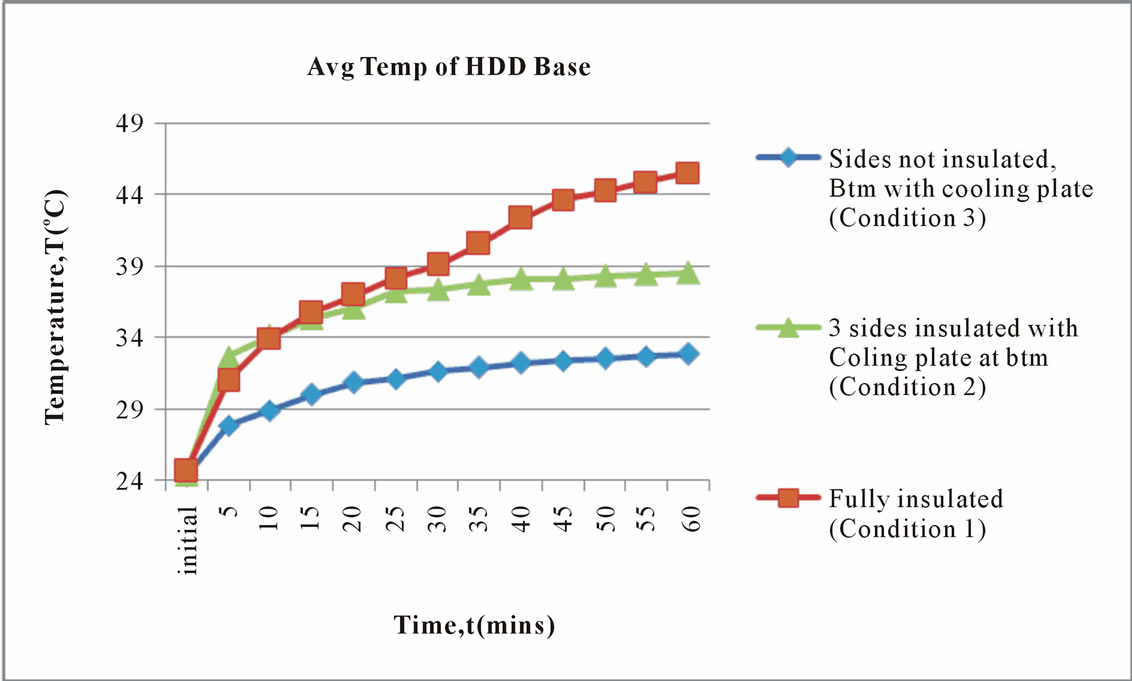
Figure 10. Average temperature of HDD base under the 3 different wall conditions.
transfer rate compared to condition 1. The higher temperature difference here is attributed to the higher conductivity of the HDD aluminum base plate.
Wall condition 3 introduces convection on 4 sides of the HDD and conduction through the base of the HDD. There is an improvement in lower steady state temperature at 33°C that reached in 40 mins.
A comparison is made between the experimental results on the disc by the IR camera and the results by Saniel et al. [19]. Both the temperature trend suggests a decreasing temperature distribution on the disk with disc radius. This is due to the outer area of the disk experiences turbulent flow and higher rate of heat transfer that explains the decrease in temperature trend. As the distance between the disks pans to zero, the airs between the disks behaves like a rigid body rotation [20].
4.6. Temperature Distribution of the Spindle Motor
The demand of high speed and friction causes an increase in power consumption. Figure 11 shows the temperature distribution of the spindle motor measured by the IR camera for the 3 wall conditions. A steady state temperature of the spindle motor is reached in 25 mins at 31.7°C when the HDD is attached with an aluminum base cooling plate to enhance heat transfer rate. The steady state temperature of spindle motor reached 34.2°C in 40 mins when no side insulation and no base cooling plate are used. However, temperature of the spindle
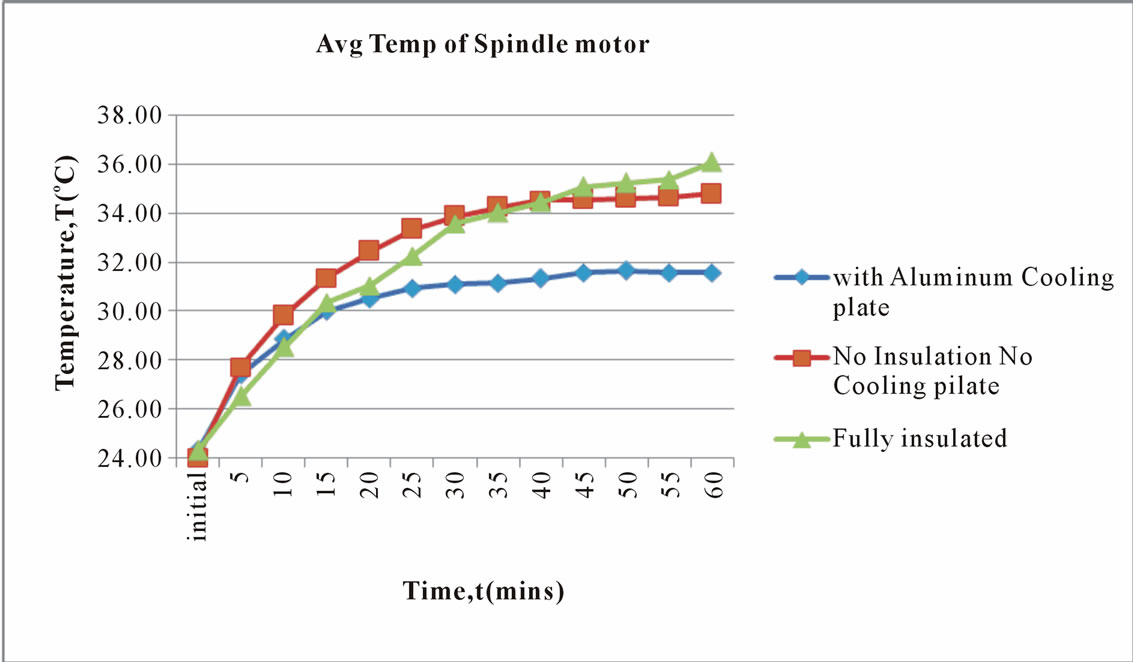
Figure 11. Average temperature of spindle motor with aluminum base cooling plate.
motor doesn’t achieve steady state in 60 mins when HDD is fully insulated. Overall, the temperature trend measured is very similar to the temperature field simulated by Jang et al [21].
To sum up, the IR thermography can be used to determine the critical regions within the HDD during operation. The temperatures obtained from the disk and head cap at different ambient temperatures allows researchers to better visualize of the temperature experienced in different components of HDD. The averaged temperature of the disk and head cap exhibits similar temperature profile. However, the averaged temperature of the head cap was generally higher compared to that of the disk, as the spindle motor is the dominant heat source (joule heating of motor coil) inside the HDD. Better understanding of the actual thermal condition within the HDD, and the temperature experienced by its components during operation enables accurate initial parameter setting and the needed boundary conditions. In the actual mounting bracket of the HDD for a typical CPU configuration, the bracket can be replaced by aluminum of high conductivity. From our results, test-condition 2 introduces a conduction path using a large base cooling plate suggests a significant reduction in steady state temperature and with enhanced heat transfer rate. Further studies can be made to determine the effective thickness and geometric dimensions for the base cooling plate to optimize heat conduction rate. Test-condition 3 permits both conduction and convection by removing the insulation from the 4 sides of the HDD shows that convection mode also helps in improving the heat transfer rate and reducing the steady state temperature of the HDD. Heat transfer can be optimized by a better controlled and quantifiable means of convection with a ducted (parallel or vertical) air way to allow forced convection via the air vents [22].
5. Conclusions
The paper deals with a measurement technique to evaluate the temperature distribution of the components in HDD. In order to determine the thermal distribution of the components using the IR system, their emissivities are first to be determined correctly using the black tape method. The temperature of spindle motor measured is comparable to the model by Jang et al. This validates the non-contact methodology used in this work to measure the temperature distribution.
By insulating the HDD fully from the 4 sides and the base as test-condition 1, higher steady state temperature is reached at a prolonged time. Significant reduction in steady state temperature and increased rate of heat transfer is achieved in test-condition 2 by introducing a conduction path through a large base cooling plate. Reduction in steady state temperature is also observed when convection is allowed by removing the insulation from the 4 sides of the HDD. The improvements in the heat transfer rates and steady state temperature through the test-conditions 1 and 2 can be used to formulate a solution to dissipate the heat from the HDD. The best passive cooling solution is to provide more thermal paths between the HDD to chassis wall or to enhance the convection to the lower ambient air temperature. A solution is proposed to improve heat transfer rates by 2 methods: heat conduction by a mounting bracket made of aluminum; a better controlled convection through an air duct can be designed and installed in the chassis of the CPU.
Further experiment are required to determine the effective thickness, size and geometric dimensions for the base cooling plate to enhance conduction away from the HDD. This should also include numerical heat transfer module such as computational fluid/heat dynamics with the use of ANSYS software. The actual configuration of the air ducts should then be constructed with the temperature of the HDD closely monitored. More advanced multi-objective optimization of flat plate heat sink geometry such as using the Taguchi based grey relational analysis or even the respond surface methodology method towards parameter optimization design of a flat plate heat sink dealing with the reduction of thermal resistance (i.e., by maximizing its average convective heat transfer coefficient) is proposed as future work.
6. Acknowledgements
The authors would like to thank Mr. W. Lee for their assistant during the editing phase of this study.
7. REFERENCES
- Matthew Elliott, “Seagate Product Press Release,” accessed 10 June. http:// news.cnet.com/8301-17938_105- 9987407-1.html
- Seagate Technology LLC, “Seagate Datasheet Cheetah 15k.5,” accessed 10 August. http://www.seagate.com/ docs/pdf/datasheet/disc/ds_cheetah_15k_5.pdf
- P. A. Eibeck and D. J. Cohen, “Modeling Thermal Characteristics of a Fixed Disk Drive,” IEEE Transaction on Components, Hybrids and Manufacturing Technology, Vol. 11, No. 4, December1998, pp. 566-570.
- C. M. Kozierok, “HDD Head Actuator,” accessed 10 August. http://www.pcguide.com/ref/fdd/constActuator-c. html
- N. J. Clauss, “A Computational Model of the Thermal Expansions within a Fixed Disk Drive Storage System,” M.S. Thesis, University of California, Berkeley, 1988.
- S. H. Kim, “The Reduction of Air-Borne Noise in Hard Disk Drive,” Asia Pacific Magnetic Recording Conference, Tokyo, 2000.
- M. Kurita, J. Xu, M. Tokuyama, S. Seagusa, Y. Maruyama and H. Fukui, “Simulation of Thermal Protrusion on Magnetic Head Element,” JSME International Journal, Series C, Vol. 48, No. 3, 2005, pp. 359-362. doi:10.1299/ jsmec.48.359
- S. Gurumurthi, Y. Kim and A. Sivasubramaniam, “Using STEAM for Thermal Simulation for Thermal Simulation of Storage System,” IEEE Micro Computer Society, Computer Architecture Simulation and Modeling, 2006, pp. 43-51.
- P. S. Goh, “Numerical Simulations of Thermal Effects in Computer HDDs,” Final Year Project Report, School of Mechanical & Aerospace Engineering, Nanyang Technological University, Singapore, 2006.
- F. P. Incropera and D. P. DeWitt, “Fundamentals of Heat and Mass Transfer,” John Wiley & Sons, Hoboken.
- J. Merchant, “Infrared Temperature Measurement Theory and Application,” Mikron Instrument Company Inc., (private communication).
- Omega Engineering Inc., accessed 10 August. http://www. omega.com/
- K. D. Gruner, “Principles of Non-Contact Temperature Measurement,” 10 August. http://www.raytek.com/Raytek/en-r0/IREducation/Principlesof+IR.htm
- E. Y. K. Ng, D. H. M. Lim and F. Gao, “Monitoring and Characterising of Hard Disk Drive Thermal Sources,” Heat Transfer Engineering Journal, Vol. 30, No. 8, 2008, pp. 649-660. doi:10.1080/01457630802659920
- Jenoptik and Jena, “Determining Emissivity Using an Infrared Imaging Radiometer,” accessed 10 August. http://www. ircameras.com/emissivitydisc.html
- Y. Kim, S. Gurumurthi and A. Sivasubramaniam, “Understanding the Performance-Temperature Interactions in Disk I/O of Server Workloads,” Proceedings of the International Symposium on High Performance Computer Architecture (HPCA), Austin, 2006, pp. 179-189.
- LAND Instruments International, “Temperature Measurement with Infrared Thermometers,” accessed 10 August. http://www.landinst.com/infrared/downloads/pdf/ temperature_measurement_radiation_ thermometers.pdf
- E. Y. K. Ng and Z. Y. Liu, “Prediction of Unobstructed Flow for Co-Rotating Multi-Disk Drive in an Enclosure,” International Journal for Numerical Methods in Fluids, Vol. 35, No. 5, March 2001, pp. 519-531. doi:10.1002/ 1097-0363(20010315)35:5<519::AID-FLD98>3.0.CO;2- F
- N. Saniel, E. Erturan and A. Olcay, “Heat Transfer Augmentation of a Co-Rotating Disk Assembly with Special Emphasis on the Lower Disk,” Heat Transfer Engineering, Vol. 25, No. 4, 2004, pp. 80-89. doi:10.1080/014576 30490443811
- M. A. Suriadi, C. S. Tan, Q. D. Zhang, T. H. Yip and K. Sundaravadivelu, “Numerical Investigation of Airflow Inside a 1-in Hard Disk Drive,” Journal of Magnetism and Magnetic Materials, Vol. 303, No. 2, 2006, pp. e124- e127. doi:10.1016/j.jmmm.2006.01.212
- G. H. Jang, S. J. Park and S. H. Lee, “Electromechanical Analysis of a HDB Spindle Motor,” IEEE Transactions on Magnetics, Vol. 41, No. 5, 2005, pp. 1608-1611. doi: 10.1109/TMAG.2005.845020
- J. Chang, C. W. Yu and R. L. Webb, “Identification of Minimum Air Flow Design for a Desktop Computer Using CFD Modeling,” 7th Intersociety Conference on Thermal and Thermomechanical Phenomena in Electronic Systems, 2002, pp. 330-338.