Intelligent Control and Automation
Vol. 4 No. 3 (2013) , Article ID: 35554 , 17 pages DOI:10.4236/ica.2013.43031
Constant Force Feedback Controller Design Using PID-Like Fuzzy Technique for Tapping Mode Atomic Force Microscopes
Department of Electrical Engineering, Tungnan University, New Taipei City, Chinese Taipei
Email: yuanjaywang@mail.tnu.edu.tw
Copyright © 2013 Yuan-Jay Wang. This is an open access article distributed under the Creative Commons Attribution License, which permits unrestricted use, distribution, and reproduction in any medium, provided the original work is properly cited.
Received November 30, 2012; revised January 2, 2013; accepted January 9, 2013
Keywords: Atomic Force Microscope; Piezoelectric Tube Scanner; Tapping Mode; PID-like Fuzzy Controller
ABSTRACT
A novel constant force feedback mechanism based on fuzzy logic for tapping mode Atomic Force Microscopes (AFM) is proposed in this paper. A mathematical model for characterizing the cantilever-sample interaction subsystem which is nonlinear and contains large uncertainty is first developed. Then, a PID-like fuzzy controller, combing a PD-like fuzzy controller and a PI controller, is designed to regulate the controller efforts and schedule the applied voltage of the Z-axis of the piezoelectric tube scanner to maintain a constant tip-sample interaction force during sample-scanning. Using the PID-like fuzzy controller allows the cantilever tip to track sample surface rapidly and accurately even though the topography of the surface is arbitrary and not given in advance. This rapid tracking response facilitates us to observe samples with high aspect ratio micro structures accurately and quickly. Besides, the overshoot which will result in tip crash in commercial AFMs with a traditional PID controller could be avoided. Additionally, the controller efforts can be intelligently scheduled by using the fuzzy logic. Thus, continuous manual gain-tuning by trial and error such as those in commercial AFMs is alleviated. In final, computer simulations and experimental verifications are provided to demonstrate the effectiveness and confirm the validity of the proposed controller.
1. Introduction
In 1986, Binnig, Quate, and Gerber invented the AFM to investigate nano-scale surfaces of insulators in a noninvasive manner [1]. The technique provides a true threedimensional surface-profile and is especially good for examining local properties for a wide range of material properties, including surface topology, surface and near surface friction, ferroelectric domain structure, electric potential and impedance, and the atomic structure of crystals at surfaces [2-4]. Mainly, there are three operation modes in AFMs, including the contact mode, noncontact mode, and tapping mode. Recently, tapping mode AFMs have received more attention and is focus of this study. In this operation mode, a microcantilever with a sharp tip is vibrated near its 1mechanical resonant frequency by an external sinusoidal input and the tip contacts with the sample periodically in each cycle of the oscillation during sample-scanning. The deflection of the tip dynamics in the vertical direction is detected optically. In the presence of tip-sample force interaction, the amplitude, resonant frequency, and phase angle of the oscillating tip are altered. Normally, the variations of these physical quantities can be measured to infer sample topography and material properties in sample surface.
A simplified electromechanical system of a typical AFM is shown in Figure 1. The system consists of a microcantilever driving subsystem, a microcantilever deflection detection subsystem, a signal conversion subsystem, a sample-positioning subsystem, and an intelligent feedback controller subsystem. The microcantilever driving subsystem consists of a microcantilever with a sharp tip driven mechanically by a piezoelectric bimorph. The driving signal of the piezoelectric bimorph is generated by a high frequency resolution numerically-controlled oscillator. Further, the microcantilever deflection detection subsystem, consisting of a position-sensitive photo detector (PSPD), a current-to-voltage converter, a preamplifier, and a low-pass filter, is designed to opti-
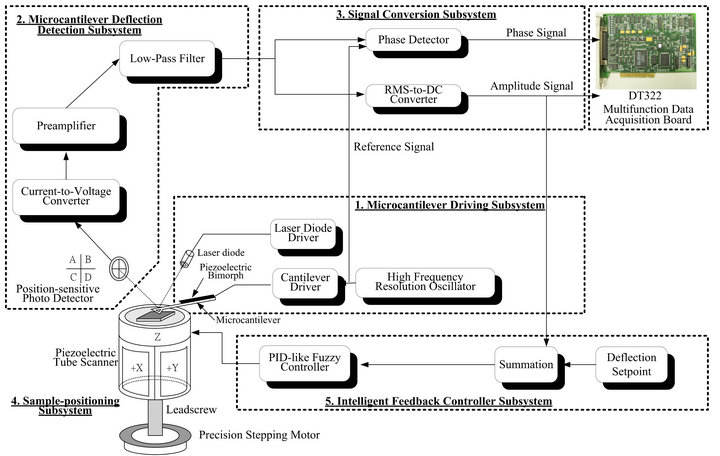
Figure 1. An electromechanical system of a typical AFM.
cally measure the dynamic bending of the microcantilever in the vertical direction. Moreover, the signal conversion system, cascaded with the microcantilever deflection detection subsystem, is exploited to real-time convert the amplitude and phase signals of the oscillating cantilever into corresponding voltage signals. Furthermore, the sample-positioning subsystem, comprised of a piezoelectric tube scanner and a precision stepping motor, enables positioning of the AFM probe both parallel (along the X and Y axes) and perpendicular (along the Z axis) to the sample surface. In addition, the intelligent feedback controller subsystem is utilized to monitor and regulate the vertical deflection of the microcantilever. Figure 2 is a picture of the experimental setup of the homemade tapping mode AFM. Generally, depending on the tip-sample distance, the tip suffers from a long-range attractive force and a short-range repulsive force as seen in Figure 3. Alternatively, the interaction force is a highly nonlinear function of the tip-sample distance. Many experimental and theoretical studies have confirmed the existence of complex chaotic behavior under certain operating conditions [5,6].
In the approach mode of a tapping mode, the microcantilever with a sharp tip is disposed to face the sample surface through a safe approaching mechanism which moves the sample toward the tip step by step in nanoscale, exploiting the above-mentioned precision stepping motor. In general, the approach mode is achieved when an amplitude reduction of the deflection of the oscillating cantilever is detected. This reduction implies the existence of a force interaction between the tip and the sample. Successively, the sample-scanning is carried out under a pre-specified force interaction. During samplescanning, as the sample is moved laterally, the AFM tip scans the sample surface two-dimensionally. In the meantime, depending on the topography of the sample and the tip-sample distance, the amplitude of the oscillating microcantilever changes accordingly. This subsequent change, which corresponds to the topography of the sample, is detected optically by the PSPD and forms a basis for imaging the sample topography. Usually, to maintain a constant tip-sample force interaction during lateral scanning of the sample surface, a feedback controller loop is exploited to regulate the first harmonic amplitude of the oscillating microcantilever by moving the sample vertically relative to the microcantilever. Most commonly, a piezoelectric scanner tube is employed to position the sample relative to the oscillating tip both in the lateral and vertical directions.
The current limitations of AFMs are the length of time required to obtain a high quality image of samples and the inconvenience in adjusting the controller gains. To
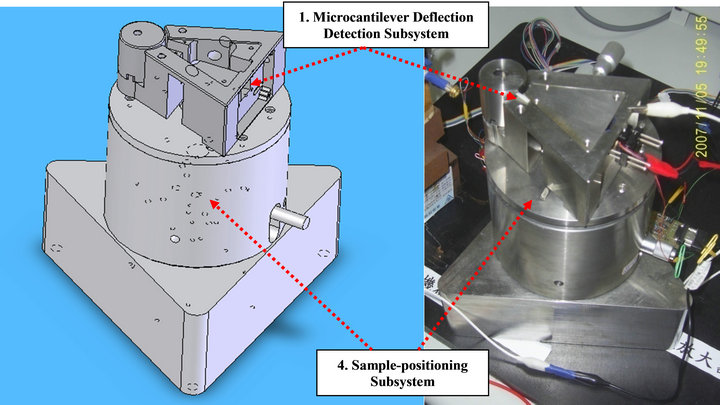
Figure 2. Pictures of the experimental setup of the homemade tapping mode AFM.
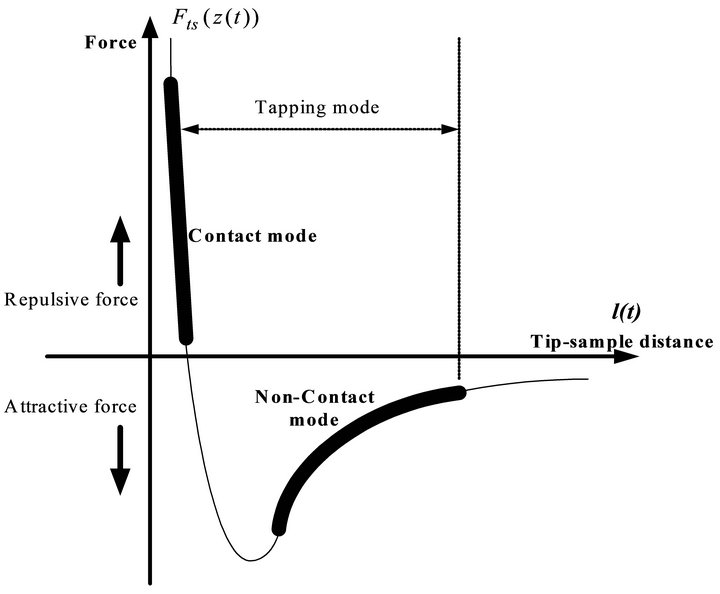
Figure 3. The force and distance relations of the sample and tip.
overcome these limitations, in recent years, several researchers have investigated these problems. Systems and control perspectives have significantly contributed to analyze the dynamics of AFMs as well as to develop novel imaging modes. Many control-based methods have led to considerable improvements in imaging samples at higher speeds [7-12]. In one such study, Battiston et al. applied a feedback mechanism to operate a combined AFM/scanning tunneling microscope (STM) [7]. This allows for simultaneous measuring of the resonance frequency shift of the cantilever-type spring and the mean tunneling current. Later, Hsu and Fu [8] integrated the feedback linearization and the singular perturbation techniques to design a robust output high-gain feedback controller for AFMs to perform sample-scanning at a high data sampling rate. This allows the cantilever tip to track the sample surface quickly and accurately. Further, for high bandwidth and robustness, in [9], Sebastian et al. addressed the AFM imaging problem in the framework of modern robust control, exploiting the stacked H-infinity and Glover McFarlane controllers. They postulated that sample profiles can be accurately imaged without building explicit observers. Furthermore, the dynamical behavior of a tip-sample system that forms the basis for the operation of AFMs is explored in [10]. In this study, the transfer function analysis gives a complete description of AFM dynamics and the exact and analytical expression for the multivariable infinite dimensional transfer function of a surface-coupled cantilever system is derived. Moreover, Wu et al. proposed a novel current cycle feedback iterative learning control (CCF-ILC) approach to achieve high-speed AFM imaging [11]. In particular, the CCF-ILC controller design methodology utilizes the recently-developed robust-inversion technique to minimize the model uncertainty effect on the feedforward control, and removes the causality constraints existing in other CCF-ILC approaches. Recently, Sebastian et al. reviewed the systems approach to the analysis of dynamic-mode AFMs in which the harmonic balance method is exploited to analyze the steady-state behavior of the oscillating tip in the presence of force variations [12]. Herein, a framework for identifying the tip-sample interaction force is suggested and a simple piecewiselinear tip-sample interaction model is identified using the mentioned harmonic balance method.
The main purpose of this study is to propose a novel, alternative method to schedule the feedback dynamics of tapping mode AFMs, exploiting the PID-like TakagiSugeno fuzzy logic controller technique (TSFLC) [13-19] to improve tracking response both in speed and accuracy. Normally, these improvements will enhance imaging quality and enable imaging at higher speeds. The PIDlike TSFLC is a knowledge-based system consisting of a fuzzifier, a fuzzy knowledge base, a fuzzy inference engine, and a defuzzifier mechanism. It is well known to have shorter rise and settling times than the PI-like FLC and thus allows system output to rapidly track desire trajectories with high accuracy [17]. Typically, in order to always achieve an optimal adjustment, the controller efforts are adapted using the fuzzy rules during operation. In this regard, the error and error differentiation signals are inputted to the fuzzy inference engine. Thus, the fuzzy output signal is generated from the fuzzy rule base and is used adaptively to schedule the controller’s efforts to regulate the tip-surface force interaction according to a prescribed force set-point property. In this way, this system achieves high-speed and accurate tracking of the sample topography.
It should be noted that the rapid and accurate tracking response of the PID-like TSFLC allows us to observe high aspect ratio micro structures. Furthermore, the continuous and excess on-line and manual gain-scheduling to improve the tracking response of the traditional PID tuning method can thus be avoided through the use of the proposed fuzzy control method. This is especially beneficial for AFM operators who are not experts in the field of control engineering. They could pay more attention to sample observation without real-time tuning the PID gains as needed in traditional AFMs.
2. Mathematical Model of a Tapping Mode Atomic Force Microscope
In tapping mode AFMs the microcantilever with a sharp tip, as seen in Figure 4, is initially driven into oscillation at a frequency  slightly off resonance using a piezoelectric crystal element with an excitation amplitude
  Normally, in this sequel the microcantilever motion stays almost perfectly sinusoidal. Herein, the equation characterizing the vertical displacement of the free microcantilever center with respect to the sample is
 , (1)
, (1)
where  denotes the dynamic amplitude equation of the oscillating tip and
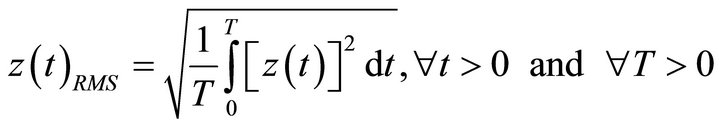
  is the minimum tip-sample distance. Here, for ease of real-time observation and analysis, the continuous variations in the amplitude of the oscillating microcantilever are detected and then converted into their related root-mean-square (RMS) value utilizing a high precision and wideband RMS-to-DC converter [20]. In general, this converter provides an accurate RMS reading regardless of the type of waveforms being measured. The definition of the RMS value of a voltage signal
  is expressed as
 (2)
(2)
where  denotes the duration of the measurement. Equation (2) implies squaring the oscillating signal, taking the average, and obtaining the square root. It is notable that
  can be any instantaneous voltage function of time, but not necessarily periodic. In the following section, the tip dynamics will be analyzed both with and without tip-sample force interactions. Then, the equations governing the tip dynamics at these two mentioned conditions will be established.
2.1. Second-Order Model
Generally, when the tip is far away from the sample, the tip is free and the tip-sample interaction force is minimal as seen in the Phase-1 of Figure 5. In others words, this implies 
 In this condition,
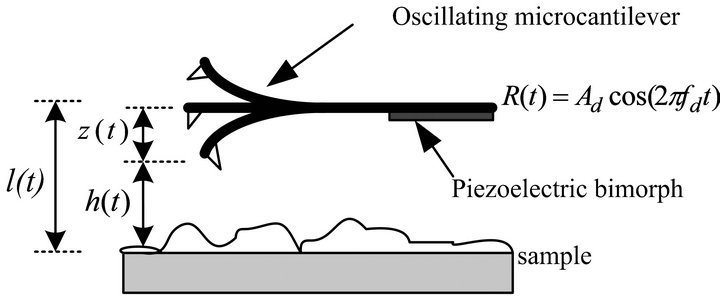
Figure 4. Schematic of an oscillating cantilever.
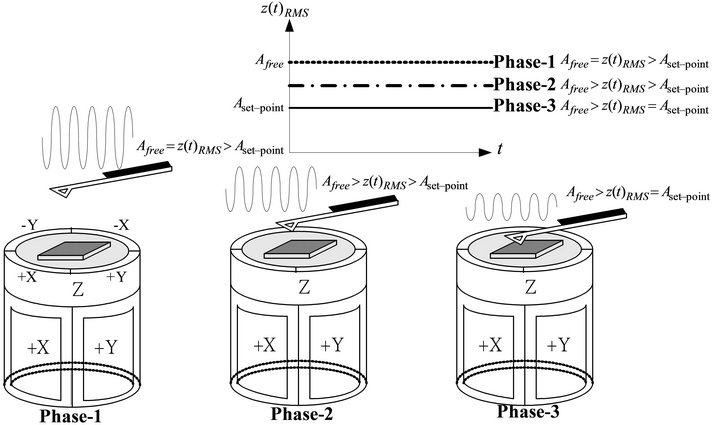
Figure 5. Tip-sample interactions in different tip-sample distances.
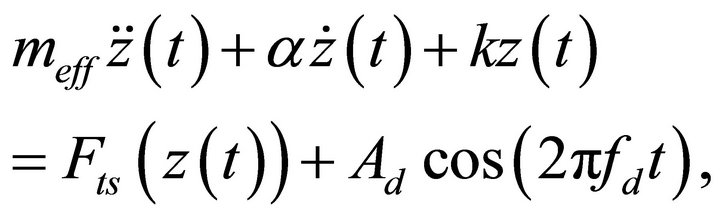
according to Figure 5, considering the vertical motion of the free oscillating microcantilever with a sharp tip, the governing equation of the microcantilever motion without tip-sample force interaction is
 (3)
(3)
where 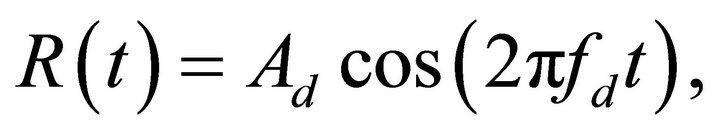
 and
and  denotes the sinusoidal driving signal of the piezoelectric bimorph at time
  Moreover,
 and
and  are the effective mass, the damping coefficient, and the spring constant of the free microcantilever, respectively. Using Equation (3), the eigenfrequency and the quality factor of the free microcantilever are, respectively,
 , (4)
, (4)
and
 . (5)
. (5)
Solving Equation (3) for  by the method of undetermined coefficients, the particular solution of
  subject to the forcing function
  is given by
 (6)
(6)
where
 (7)
(7)
 (8)
(8)
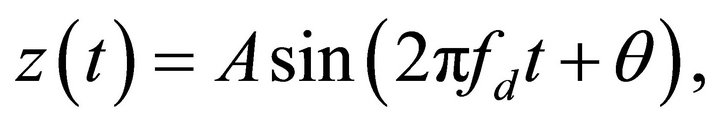
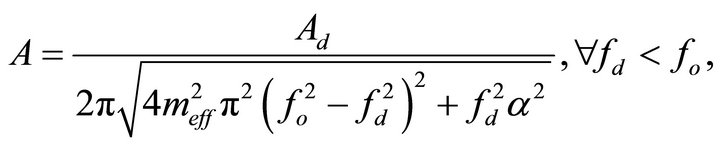
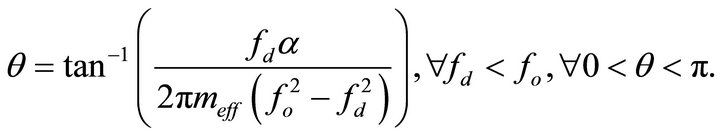
Note that A in Equations (6) and (7) denotes the actual deflection amplitude from the equilibrium of the end of the cantilever in the steady-state and  represents the phase lag between the driving signal
  and the motion signal
  of the oscillating microcantilever. According to Equations (7) and (8), A and
  are functions of the
  and
and ![]() while the mentioned
while the mentioned  and
and  are fixed. Here, for ease of continuously detecting the tip amplitude variations, the
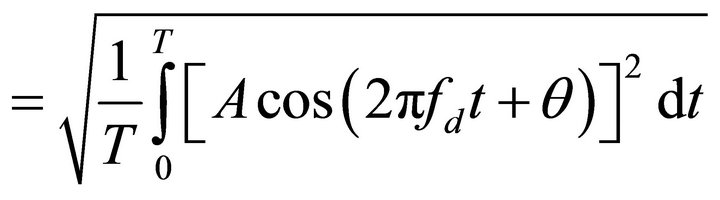
  signal is converted into its corresponding RMS values. Hence, substituting Equation (6) into Equation (2), the RMS value of the amplitude of the free oscillating microcantilever is
 , (9)
, (9)
 , (10)
and is defined as
 . (11)
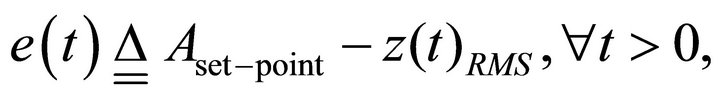
Generally, in real applications, before bringing the tip to the sample surface that has to be imaged, one needs to decide a force set-point for sample-scanning which is relative to an amplitude set-point of the oscillating microcantilever. This force-related amplitude set-point is expressed as  In other words, the aim to maintain a constant tip-sample force during the sample-scanning mode is equal to maintain a constant oscillation amplitude of the microcantilever. Based on this mentioned set-point, the error and error differentiation signals are, respectively, defined as
 (12)
(12)
and
 (13)
(13)
Normally, the error signal in Equation (12) is used as a signal to estimate the termination of the approach mode. Further, it should be noted that the larger the  the larger the oscillation tip amplitude and hence the smaller the tip-sample interaction force. On the contrary, a smaller
  implies a smaller tip-sample distance and a larger tip-sample interaction force. The mentioned oscillation amplitude,
  is kept constant during sample-scanning via a feedback loop.
2.2. Tip-Sample Interactions
In the approach mode, the oscillating microcantilever is moved closer to the sample, step by step, using the above-mentioned precision stepping motor. Once a reduction of the RMS value of the cantilever deflection  is detected, the tip-sample force initiates and the influence of the sample on the cantilever becomes significant enough to be registered by the detection system. In this condition, the tip-sample force regime enters the Phase-2 of Figure 5. This also implies
 and
and 
 Successively, the microcantilever starts experiencing relatively weak attractive forces and on further approach to the sample, the interaction force becomes repulsive in nature. Conventionally, the approach mode is ended if either
  or
or  is achieved as seen in the Phase-3 of Figure 5.
In the Phase-3 regime of Figure 5, the tip-sample interaction force alters the oscillation amplitude , the phase lag
  and the resonant frequency
  of the oscillating microcantilever. Thus, they usually are utilized as signals to infer the surface properties of the sample either in attractive or repulsive force interactions. It is notable that due to the interaction force between the oscillating tip and the sample, the microcantilever with the laser beam collimated and focused on its rear side is deflected and thereby changes the reflection angle of the laser beam spot on the four-quadrant PSPD. Thus, in this condition, the governing equation of the microcantilever motion is modified as
 (14)
(14)
where  is the nonlinear tip-sample interaction force [7], as shown in Figure 2, which demonstrates a long-range attractive force and a short-range repulsive force. Moreover, in many situations, it has highly nonlinear characteristics and is a source of uncertainties in Equation (14). Further, its properties rely heavily on tipsample distance, tip geometry, sample material properties, and operating environments. Thus, this nonlinear tipsample interaction force is one of the key problems in achieving a stable and reliable scanning of the sample. In general, the common force model for the interaction of an intermolecular pair is known as Lennard-Jones potential [11] which is
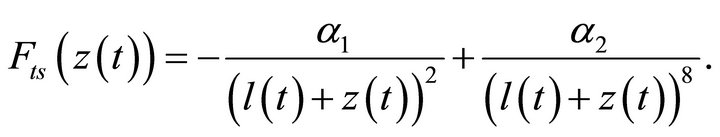 (15)
(15)
This model shows both attractive and repulsive force terms between the tip and sample surface separated by distance  The repulsive force and the attractive force are defined as positive and negative, respectively, and
  and
and  in Equation (15) are the force coefficients.
Furthermore, once the approach mode is finished, the tip and the sample are operated at a prescribed force mechanism which is related to the above-mentioned amplitude set-point  . Locally, in this short tipsample distance, one can reasonably approximate the tipsample force mechanism in Equation (15) and Figure 2 as
 (16)
(16)
where  denotes the force constant and is relatively distance-dependent according to Equation (15). It should be noted that
  in the attractive force region and
  in the repulsive force region. Substituting Equation (16) into Equation (14), one obtains
 (17)
(17)
Rearranging Equation (17), one has
 (18)
(18)
In this condition,  is the effective spring constant of the oscillating microcantilever with tip-sample force interaction. According to Equation (18), the eigenfrequency is changed to
 (19)
(19)
In addition, the equation describing the tip-sample dynamics in the steady-state becomes
 (20)
(20)
where
 (21)
(21)
and
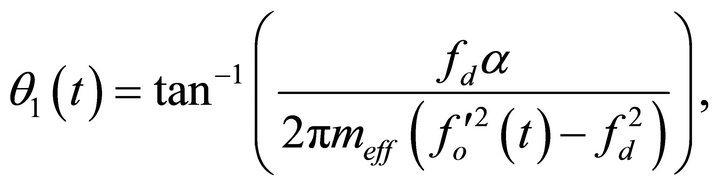 (22)
(22)
are the new oscillating amplitude and phase lag signals. According to Equations (21) and (22), since 
 and α are fixed, thus
  and
and  are timevarying functions of the resonant frequency
  which varies with respect to the effective spring constant
  as seen in Equation (19). Thus, one can easily observe that as long as the tip-sample force mechanism changes, the force constant
  in Equations (17) and (18) and the eigenfrequency
  in Equation (19) will vary correspondingly. In addition, these changes also result in the variations of
  and
and  in Equations (21) and (22). As a consequence, a change in tip-sample force,
  gives rise to a shift in the resonant frequency
  and a corresponding variation in the amplitude and phase lag signals of the oscillating microcantilever.
While performing sample-scanning, the tip interacts with the sample periodically in the end of the negative cycle of the microcantilever oscillation. In this condition, variations in the tip-sample interaction force change the effective spring coefficient  and shift the resonant frequency
  of the oscillating microcantilever. While the microcantilever with a sharp tip is initially driven at a fixed frequency
  below its resonance frequency, this shift of the resonant frequency yields in the reduction of the tip amplitude and the variation of the phase lag. In other words,
  and
and  will vary with respect to the topography of the sample when the microcantilever with a sharp tip is interacting with the sample. As a consequence, when imaging, one possible method to infer the variations of the force gradient acting on the microcantilever end and to measure the topography of the sample is to dynamically detect the amplitude and phase lag changes of the oscillating microcantilever.
2.3. Feedback Control
During sample-scanning, electric voltages are applied between the inner and outer diameter of a thin-walled piezo-tube. This tube is silvered both inside and outside and operates according to the transversal piezo effect. The inside electrode is grounded and the outside electrode is separated into four 90-degree segments, which are the +X, −X, +Y, and –Y, as seen in Figure 5. Since this piezo-tube has four 90-degree segments, it can position the sample, placed over the piezo-tube, in two lateral directions (along the X and Y axes) and one vertical direction (along the Z axis) to the sample surface. Typically, the voltage signals subjecting to two opposite electrodes, for instance +X and −X, have the same magnitude but are out of phase. Hence, placing any applied voltages on opposing electrodes leads to the bending of one end of the piezo-tube if the other end is clamped. Accordingly, the flex in the X and Y directions moves the sample laterally. In general, when the sample translates horizontally relative to the tip, any change in the height of the sample surface causes the tip-sample force  to change simultaneously. In the mean time, when the driving frequency of the microcantilever is near its mechanical resonance frequency
  shown in Equation (19), the local force gradient shifts this resonance frequency. This shift in the resonance frequency causes the amplitude variation of the oscillating microcantilever. The vertical deflection of the micricantilever is sensed by a four-quadrant PSPD using the optical lever method. In this arrangement a small deflection of the microcantilever tilts the reflected laser beam and changes the position of the laser beam spot on the PSPD.
The vertical deflection of the microcantilever, which corresponds to a relative tip-sample force, is held constant as  while sample-scanning is being performed as seen in T1 of Figure 6. In other words, this deflection signal,
  is taken as a reference operation signal. Typically, if the deflection signal increases to
  as seen in T3 of Figure 6, this implies the cantilever tip is farther from the sample than the previous point was. Conversely, since the deflection signal decreases to
 as shown in T2 of Figure 6, this represents that the point of the microcantilever tip is closer to the sample than the previous point. Hence, in order to maintain the microcantilever at the constant oscillation amplitude
  and therefore to maintain a constant interaction force applied to the sample while performing sample-scanning, a feedback control system is necessarily to adjust the input voltage of the Z-axis of the piezoelectric tube scanner to schedule the vertical deflection of this scanner, either downward or upward. In other words, the goal of the probe positioning in the Z-axis is to maintain a constant amplitude set-point value, which corresponds to a constant normal force between the tip and the sample, during the sample-scanning process. Ideally, for any sample height and tip-sample force variations, the reaction of the feedback controller should be made instantaneously and exactly.
While the tip-sample force is held constant by a feedback controller during sample-scanning, the controller’s output signal that allows the probe to follow the contour of the surface corresponds to the height of the sample surface. Thus, usually, changes in the vertical Z-axis de-
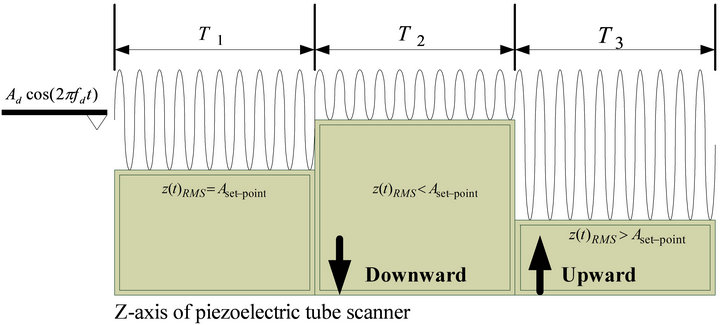
Figure 6. The tip-sample relations while performing sample-scanning.
flection of the piezoelectric tube scanner are also taken as measures of sample topography. In other words, the image of the sample topography can be inferred and estimated by using the vertical Z-axis control signal or the amplitude deflection signal of the microcantilever. Accordingly, to achieve good image quality of the sample surface and to prevent the tip from touching the sample, it is crucial to have a high speed and accuracy feedback control system to optimally schedule the Z-axis position of the piezoelectric tube scanner. This enables the tip amplitude to return to the set-point amplitude quickly and accurately and facilitates the tip to track the prescribed tip-sample interaction force. Furthermore, it should be noted that a good control system allows the oscillating tip to scan the sample with a much smaller amount of force which implies a larger tip-sample distance. This reduced force also prohibits the probe from crashing into the sample during sample-scanning. Henceforth, the rapid and accurate tracking response of the feedback control system with respect to any particular height changes in the topography facilitates high-speed sample-scanning.
In order to both improve the feedback dynamics and shorten the required time to obtain high quality images of samples, in the past years, several authors have used fixed control strategies to regulate the piezo-tube dynamics under pre-specified tip-sample interaction force. However, currently, only PI and PID controllers are used in commercial AFMs. These controllers exhibit poor robustness for the considered system which contains a cantilever-tip system that has large degree of uncertainty. Moreover, the parameters of the mentioned controllers need to be tuned properly in accordance with the characteristics of the tip-sample system dynamics. However, it is tedious for AFM users to manually schedule the P, I, and D gains of the PID controller to improve both the transient and steady-state responses by exploiting potentiometers. On many occasions, the complex gain-tuning process extends the training time for new AFM users. Thus, in order to maintain robustness to accommodate the uncertainties in tip-sample subsystems, to increase the tracking accuracy and the image quality, and to provide a more user-friendly interface of AFMs for those scientists who are not experts in the field of control engineering, an intelligent PID-like fuzzy controller is introduced in the following section.
3. PID-Like Fuzzy Controller Design for Tapping Mode AFMs
Traditionally, control systems are developed based on exact mathematical models in which the control system is described using one or more differential equations that define the system responses relative to its inputs. However, in recent years, intellectual fuzzy control technique has become trend in the development of modern control technology [13-19]. Normally, it is based on empirical methods and is basically a methodical trial-and-error approach. It is very simple conceptually and the objective of fuzzy control is to implant the expert’s experience into controller designs by means of fuzzy logic rules. Generally, the design process of fuzzy control algorithms consists of three parts which are the fuzzification, fuzzy inference, and defuzzification, as shown in Figure 7. The input fuzzification stage maps sensor signals or other inputs to appropriate membership functions and truth values. In other words, the input variables are mapped into their corresponding membership functions which convert crisp input values into corresponding fuzzy values. Then, the fuzzy inference processing stage, shown in the decision-making unit of Figure 7, invokes each appropriate rule, generates a result for each, and combines the results of the rules. Finally, the output defuzzification stage is an interface which converts the combined results derived in the fuzzy inference stage back into a specific control output value. One of the advantages of fuzzy control is that it is not necessary to know the exact mathematical model of the plant under consideration. Thus, it is more beneficial when the considered processes are too complex to be analyzed by conventional quantitative analysis techniques or when the available information of the system is interpreted qualitatively, inexactly, or contains structured and unstructured modeling uncertainty.
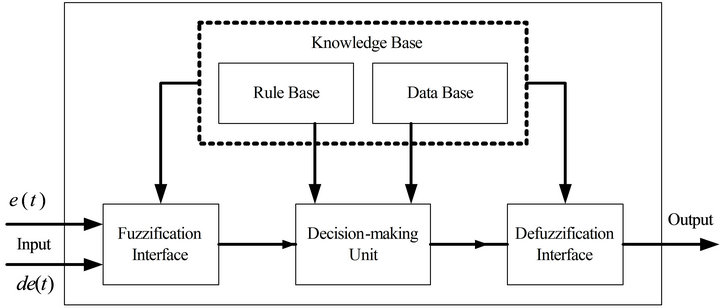
Figure 7. The basic configuration of a fuzzy logic controller.
Furthermore, it shows advantages over traditional control techniques in transient response, steady-state response, and robustness.
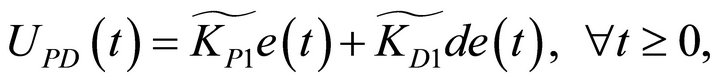
In this section, in order to use the controller efforts to improve the transient response and the steady-state response of the constant tip-sample force feedback control system of the considered AFMs which contain complex system dynamics in the tip-sample subsystem and to provide a more user-friendly interface for sample-scanning, a PID-like fuzzy controller [21] is exploited in the following. In other words, the purpose of this controller is to rapidly and accurately stabilize the AFM dynamics at a prescribed tip-sample interaction force for AFMs in the presence of height changes in topography during sample-scanning. Accordingly, combining Figures 1 and 7 to solve Equation (15) and to achieve a constant tip-sample force control, we obtain a simplified PID-like fuzzy control system block diagram for a tapping mode AFM as shown in Figure 8. As seen in Figure 8, the deflection of the tip amplitude is converted into its related RMS value using the aforementioned RMS-to-DC converter. The RMS value of the amplitude of the oscillating tip is compared with the deflection set-point . The error and error differentiation signals are then fed into the fuzzy controller. This fuzzy control structure with a serially connected PI device [21] simply connects the PD type and the PI type fuzzy controller together in parallel and creates a basic PID-like fuzzy controller. Note,
  and
and  are the scaling factors of the PD-like fuzzy controller, and
  and
and  are the gain constants of the mentioned PI controller. Hence, this PID-like fuzzy controller behaves like a PID controller with time-varying gains.
The design of the PID-like fuzzy controller contains two steps. First, a PD-like fuzzy controller is designed to improve the transient responses and then a PI controller is designed and cascaded with the PD-like fuzzy controller to improve the steady-state responses. In accordance with these two mentioned controllers, the PID-like fuzzy controller allows the constant tip-sample force feedback control system to have a fast rise time and a small overshoot as well as a short settling time.
In order to achieve the aforementioned controller, herein, the input variables of the PD-like fuzzy controller are defined as the cantilever deflection error signal ![]() and the change of the cantilever deflection error signal
and the change of the cantilever deflection error signal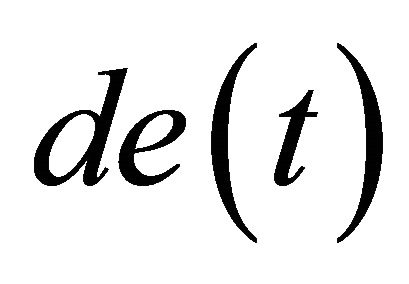 . Besides, the output of the PD-like fuzzy controller
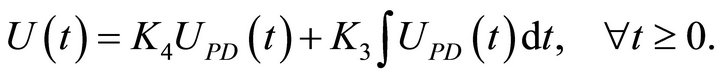
  is fed into the mentioned PI controller to compensate the steady-state response. In addition, the PI controller output is fed into the power operational amplifiers to dynamically adjust the applied voltage of the Z-axis of the piezoelectric tube scanner to regulate the vertical position of the sample, thus achieving a constant tip-sample force interaction. Accordingly, the main purpose of the PID-like fuzzy controller is to maintain the constant oscillation amplitude of the resonating cantilever which is related to a constant tip-sample interaction force.
In order to design the PD-like fuzzy controller, the membership functions of the fuzzy variables, ![]() and
and , are defined as [−10, 10] as seen in Figures 9 and 10. Also, the membership functions of the output variable
  for defuzzification are shown in Figure 11. After the fuzzy input and output variables are ascertained, the relations between the membership functions and the language variables need to be defined. Here, the membership functions LP, SP, ZE, SN, and LN represent large positive, small positive, approximately zero, small negative, and large negative, respectively. The triangular membership function is exploited to conduct the fuzzification and defuzzification processes. Generally, this kind of membership function provides good time response. Note, in the fuzzy variables
 ![]() and
and , the inputs of SP and SN are asymmetric triangle membership functions and the others are symmetric triangles. In addition, all the membership functions of the fuzzy output variable
  are of symmetric triangle form.
The fuzzy controller is designed using a T-S model [13] and the symbolic description of each rule is given as:
 : If e(t) is Ai and de(t) is Bi, then UPD(t) is Ci,
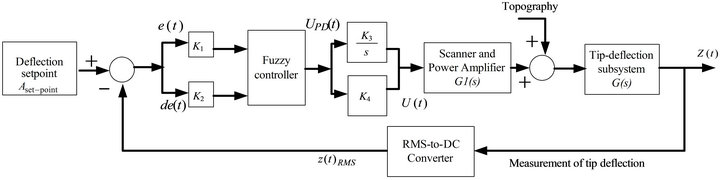
Figure 8. A simplified PID-like fuzzy logic control system block diagram for a tapping mode AFM.
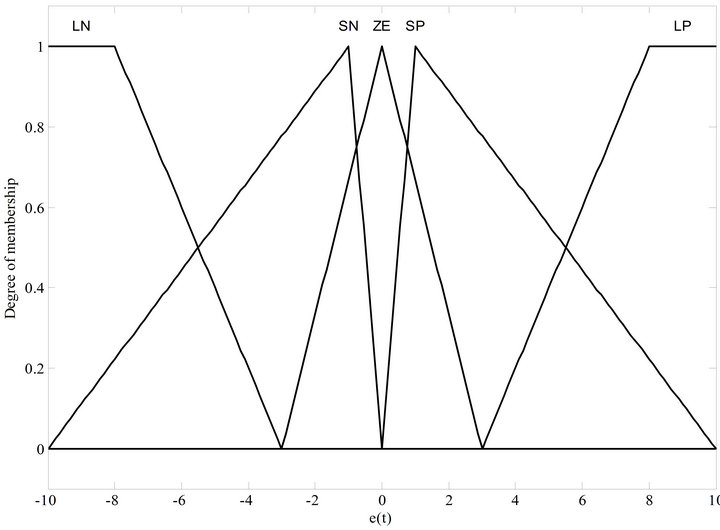
Figure 9. The membership function of e(t).
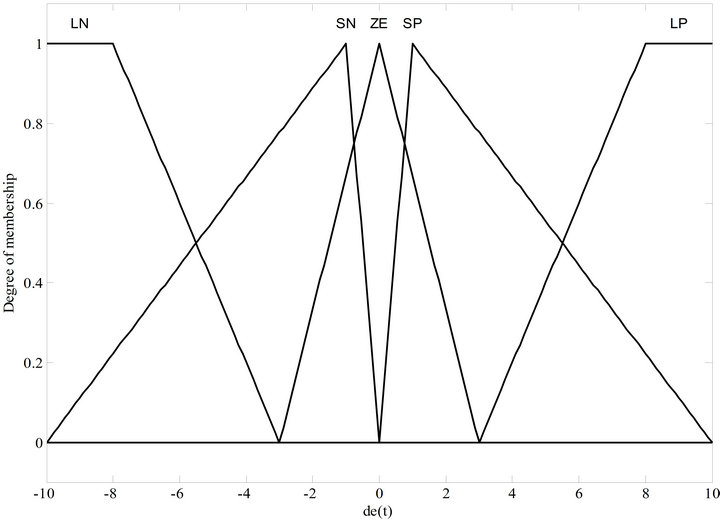
Figure 10. The membership function of de(t).
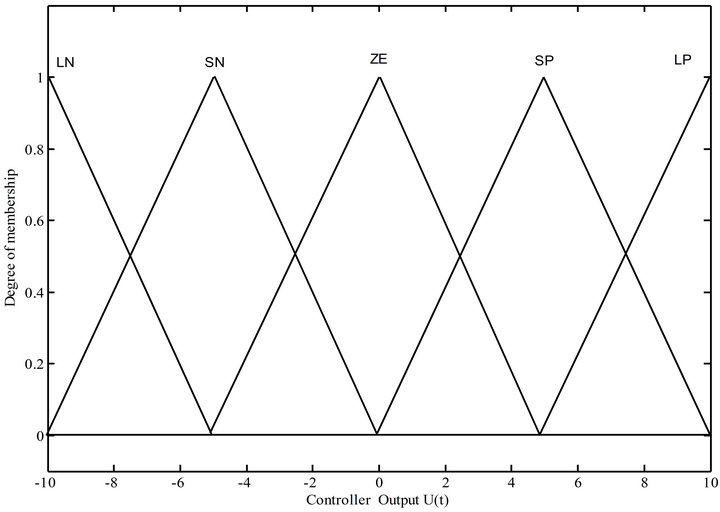
Figure 11. The membership function of UPD(t).
where  represents the i-th rule and A, B, and C are the linguistic values of
![]() ,
,  , and
, and , respectively. Accordingly, the rules of the PD-like fuzzy logic controller are shown in Table 1. Herein, a total of 25 fuzzy rules are used in this case and the control input
  is inferred based on this table. Practically, the intersection cell of the row and the column contains the linguistic value for the output of the fuzzy rule. Based on this, the output of the fuzzy controller is a fuzzy subset.
Generally, before exploiting the fuzzy controller to control the considered object, it is necessarily for the object to be defuzzificated and then converted into an accurate quantity. Figure 12 shows the surface viewer of the fuzzy controller that results from the rules shown in Table 1. Actually, the surface in this figure is equivalent to a superposition of the two fuzzy input variables. Henceforth, using Figures 8-12, the output of the PD-like fuzzy controller can be expressed as
 (23)
(23)
where  and
and ![]() are the equivalent fuzzy output gains of the PD-like fuzzy controller. According to Figure 8, the controller output of the PID-like fuzzy controller is to cascade the PD-like fuzzy controller with a PI controller and can be expressed as
are the equivalent fuzzy output gains of the PD-like fuzzy controller. According to Figure 8, the controller output of the PID-like fuzzy controller is to cascade the PD-like fuzzy controller with a PI controller and can be expressed as
 (24)
(24)
Substituting Equation (23) into Equation (24), Equation (24) can be further rewritten as
 (25)
(25)
where 
 and
and  are the equivalent gains of the output of the PID-like fuzzy controller. In general, these gains could be intelligently self-scheduled by using the aforementioned PD-like fuzzy controllers. On the other hand, the PID-like fuzzy controller [21] mentioned above also retains characteristics similar to the conventional PID controllers. Thus, the PID-like fuzzy controller combines the advantages of the PD-like fuzzy controller and the PI controller, and is exploited here to improve the performance of the constant force feedback control systems of the AFM dynamics which contain nonlinear and large time-varying characteristics in the tip-sample force relations. For more details about the PID-like fuzzy controller method, refer to [21]. In the following section, an illustrative example is provided to illustrate the new technique for designing PID-like fuzzy controllers to achieve the rapid and accurate tip-sample interaction force control of tapping mode AFMs. In addition, some experimental studies will be carried out.
4. Simulation and Experimental Results
In this section, some simulations and experimental studies will be given to show the effectiveness of the proposed method. To derive a mathematical model of the tip-deflection subsystem, a dynamic frequency response analyzer software is developed using a Borland C++ Builder V6.0 and a DT322 multifunction data acquisition board [22]. Figure 13 demonstrates the frequency response of the tip without tip-sample force interaction, where the input is  and the output is
Based on the frequency response characteristic of the
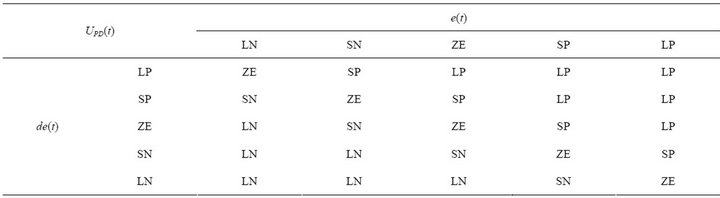
Table 1. Fuzzy rule table of the PD-like fuzzy logic controller.
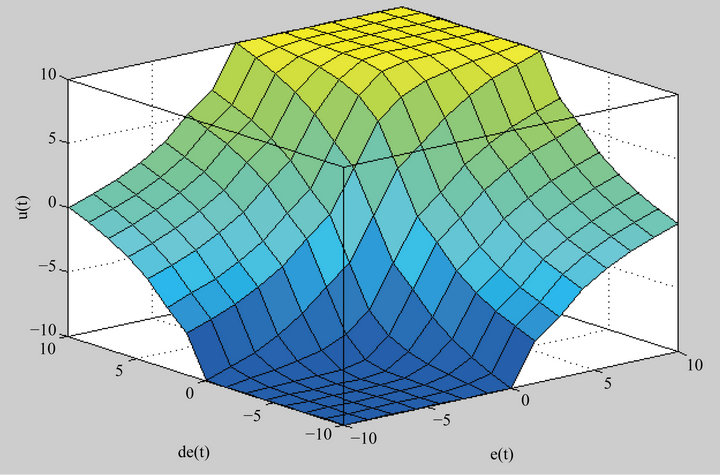
Figure 12. The surface viewer of the fuzzy control rule.
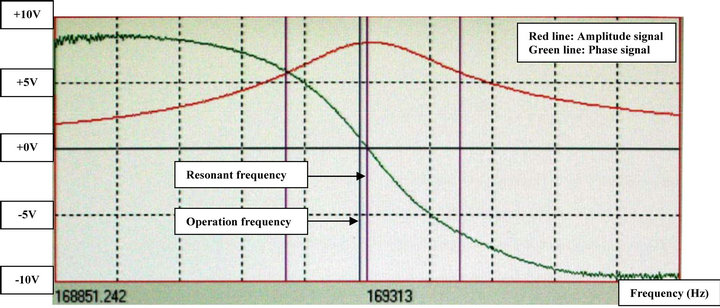
Figure 13. Measured frequency response curves in terms of amplitude and phase of the oscillation tip without tip-sample force interaction. The resonant frequency is 169.313 KHz.
tip-deflection subsystem, the approximate model obtained using the curve-fitting technique in terms of transfer is
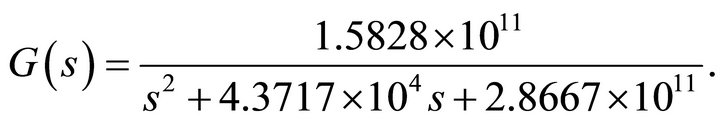 (26)
(26)
It is remarked that the  in Equation (26) will vary with respect to different force settings and different tip geometries manufactured by different companies. In other words, when a user changes tips manufactured by different company with different fabrication processes, the transfer function in Equation (26) changes accordingly. Further, the scanner and power amplifier dynamics, as seen in Figure 8, are modeled in a simplified form as
 (27)
(27)
which has a dc gain of 20. In addition, the scaling factors, K1 and K2, and the gain constants, K3 and K4, in Figure 8 of the PID-like fuzzy controller are given as 0.485, 0.005, 15, and 30, respectively. Note, the surface topography of the sample is represented as another input signal as seen in Figure 8. The simulations of the PID-like fuzzy control system are carried out using the MATLAB and Simulink softwares for verification. In the meantime, for comparisons, the system under consideration will also be controlled with a conventional PID controller, where the PID controller gains are given as KP = 0.5, KI = 0.05and KD = 0.1, respectively.
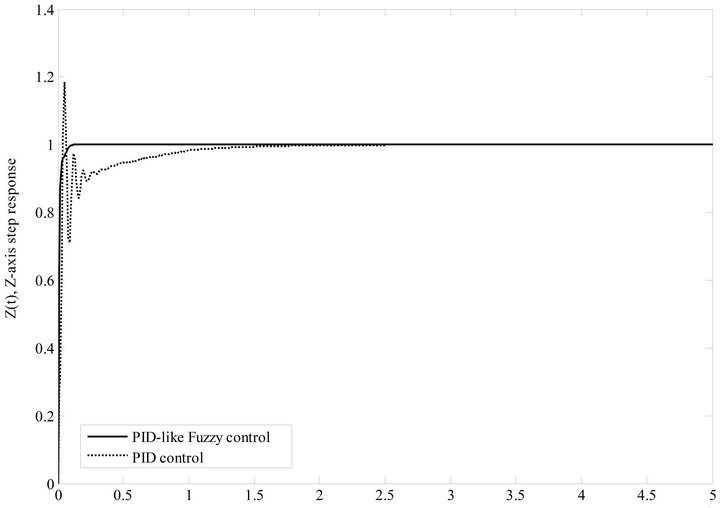
Figure 14 shows the simulation results of the output response with respect to a unit step input which is used to simulate a height change in topography of the sample. It is observed that the settling times for the system considered, subject to a step input, are approximately 0.2 ms and 3 ms for the system with a PID-like fuzzy controller and with a traditional PID controller, respectively. Hence, the time for the tip to return to a prescribed oscillating amplitude set-point for an AFM with a PID-like fuzzy feedback is faster than that of an AFM with a PID controller. Besides, in Figure 14 we can also observe that the overshoot for the considered system with a PID-like fuzzy controller is smaller than that of the system with a conventional PID controller. This reduction in overshoot significantly reduces the possibility for the tip to penetrate from the attractive force region to the repulsive force region and prevents the tip from being damaged. In other words, this also implies that the piezoelectric tube can be rapidly moved upward and downward to return to the desired vertical position. Thus, the movement of the piezoelectric tube in the vertical direction is significantly related to the height of the sample at each point. It should be noted that the rapid transient response characteristic facilitates the operations of the AFM at a higher bandwidth and hence under a higher rate of data sampling.
In addition, Figure 15 shows the controller output U(t) of the considered feedback system with a periodic square
 Time (sec)×10−3
Figure 14. Simulations results of the constant force feedback control system with a step input (solid line: PID-like fuzzy control, dotted line: PID control).
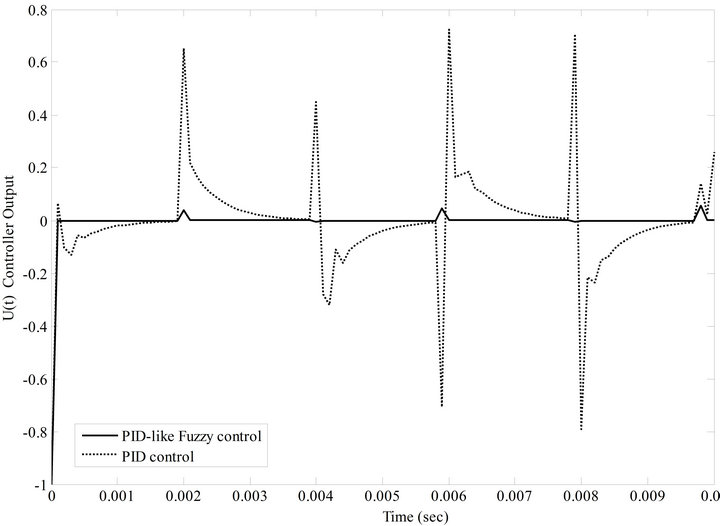
Figure 15. Controller output U(t) of the constant force feedback system with a periodic square wave input (solid line: PID-like fuzzy control, dotted line: PID control).
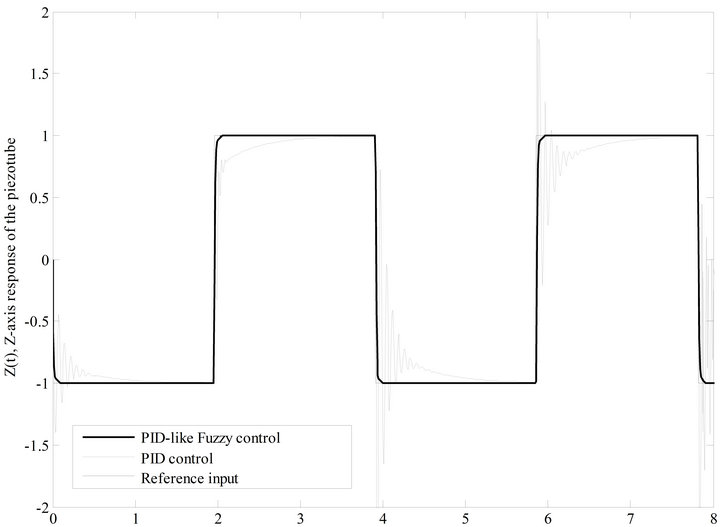
wave input at a frequency of 250 Hz. Since the control effort is applied to schedule the input voltage of the Z-axis of the piezoelectric tube scanner, it usually is considered as a good measure of the sample surface profile. In accordance with this, the large overshoot of the traditional PID control system induces a counterfeit image of the sample. On the contrary, because the overshoot of the PID-like fuzzy control system is smaller, the image quality and accuracy of the sample can be significantly improved. Further, Figure 16 shows the actual and reference displacement tip trajectories of the AFM system with a reference square wave input at a frequency of 250 Hz. Here, this reference square wave input is used to simulate a periodic up-and-down structure in the surface profile of the sample. Note, the thin real line, the dotted line, and the heavy line represent the time responses of the reference square wave input, the traditional PID controller, and the proposed PID-like fuzzy controller, respectively. Clearly, we can observe that the movement of the Z-axis of the piezoelectric tube forces the tip to track the reference square wave input rapidly and with high accuracy by using the PID-like fuzzy controller. In other words, even though the topology of the surface is arbitrary and is not known in advance, the cantilever tip can rapidly succeed in tracking task subjects with only very little error.
For experimental verifications, the AFM system is exploited to examine the surface structure of a highly ordered pyrolytic graphite (HOPG) sample. In general, a HOPG sample contains many steps with different height in the surface profile. Every single HOPG step may have one or more atomic layers. For comparisons, the PID control technique and the PID-like fuzzy control technique are used to maintain a constant tip-sample force interaction while scanning the HOPG sample. Note, the HOPG sample size is 10 um * 10 um and the image size is selected as 256 * 256 pixels. This implies this image has 256 horizontal scan lines and each line has 256 pixels. Figure 17(a) shows the scanning results by using the PID controller. Clearly, the overshoots in the tracking responses of the constant force feedback control system generate counterfeit images in the step edges of the HOPG sample. On the contrary, as seen in Figure 17(b), the step edges of the HOPG sample can be resolved clearly without feedback overshoot by using the proposed PID-like fuzzy control technique. For more detail, Figures 17(c) and (d) show the line profiles of the Figures 17(a) and (b), respectively, at the scan line 180. Clearly, overshoots are obviously found in Figure 17(c) with a conventional PID controller.
By exploiting the proposed PID-like fuzzy control technique, rapid transient response improvements in both the rise time and settling time can be achieved. Shorter settling time enables the AFM system to scan samples at a higher scanning rate and allows us to observe micro surface structures with high aspect ratio. Moreover, a small percent of overshoot allows the cantilever tip to return to the desired vertical position rapidly and safely
 Time (sec)×10−3
Figure 16. Simulations results of the considered system with a periodic square wave input at a frequency of 250 Hz.
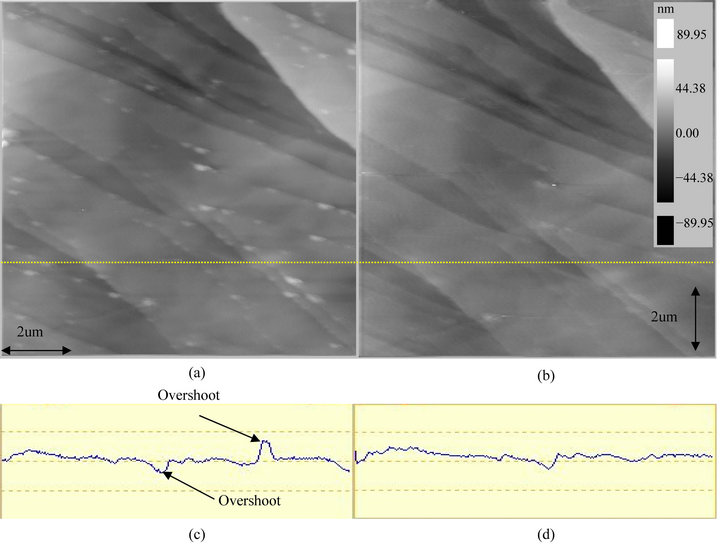
Figure 17. Experimental results comparisons (a) PID control; (b) PID-like fuzzy control; (c) PID control: at scan line 180; (d) PID-like fuzzy control: at scan line 180.
and allows the tip operate continuously in the net-attractive interaction force mode. This also prevents the tip from contacting with the sample and the risk of the tip modifying the sample surface can be minimized.
Thus, the adaptability and flexibility of the PID-like fuzzy controller system allows the tip to trace over individual atoms without damaging the surface. Most importantly, the controller efforts can be regulated intelligently by exploiting the PID-like fuzzy control technique. Continuous and tedious manual gain-scheduling efforts such as those in the traditional PID control AFM systems can thus be alleviated. Above all, the presented simulations and experimental analyses prove the effectiveness and validity of the proposed method.
5. Conclusion
AFM is widely exploited as a manipulation tool for nano particle positioning, pushing, indenting, cutting, nanolithography, and sample observation. It is known that AFMs contain essential and uncertain nonlinear characteristics in the tip-sample interaction subsystem. To solve this, regulating the vertical vibration behavior of AFMs in the Z-axis direction and making the microcantilever tip to track sample topography with high speed and accuracy in nano-scale are very critical. In this paper, combing the PD-like fuzzy controller and the PI controller, a theoretical PID-like fuzzy controller has been realized for a tapping mode AFM system. According to this, the feedback control in the vertical Z-axis direction for tracking the sample topography at a small and constant imaging force is done. Based on this controller, simulation studies and experimental verifications were carried out. According to these simulation and experimental results, the controller efforts to achieve constant tip-sample force interaction can be self-scheduled by using the PID-like fuzzy control technique. Thus, excess on-line gain-scheduling to achieve desired transient and steady-state responses in AFMs with a traditional PID controller can thus be significantly reduced. In addition, it is seen that there is a significant improvement in both the transient and steady-state response as compared with the traditional AFM with a manual-scheduled PID controller. Based on this, during sample scanning, it is possible to rapidly and accurately regulate the controller efforts to maintain a constant tip-sample interaction force and avoid incidental damage to the tip and sample. Most importantly, the sample scanning speed and precision can be remarkably improved. In accordance with these mentioned advantages, more complex and heterogeneous surfaces can be studied in the future with this proposed feedback control technique. Technologically interesting processes, such as the oxidation of semiconductors, catalytic reactions of metals, or the assembly of bimolecular can be studied more easily.
6. Acknowledgements
The author acknowledges Professor Kuang-Wei Han for his continuous guidance and suggestions in preparing this paper. The author also wishes to thank the reviewers for their corrections and helpful comments. This research was supported by the National Science Council of R. O. C. under grant NSC 99-2221-E-236-014.
REFERENCES
- G. Binnig, C. Quate and Ch. Gerber, “Atomic Force Microscope,” Physical Review Letter, Vol. 56, No. 9, 1986, pp. 930-933. doi:10.1103/PhysRevLett.56.930
- F. J. Giessibl, “Advances of Atomic Force Microscopy,” Reviews of Modern Physics, Vol. 75, No. 3, 2003, pp. 949-983. doi:10.1103/RevModPhys.75.949
- A. Sebastian, D. R. Sahoo and M. V. Salapaka, “An Observer Based Sample Detection Scheme for Atomic Force Microscopy,” Proceedings of the 42nd IEEE Conference on Decision and Control, Maui, 9-12 December 2003, pp. 2132-2137.
- S. B. Anderson, “An Algorithm for Boundary Tracking in AFM,” Proceedings of the 2006 IEEE American Control Conference, Minneapolis, 14-16 June 2006, pp. 508-513.
- N. A. Burnham, A. J. Kulik, G. Gremaud and G. A. D. Briggs, “Nanosubharmonic: The Dynamics of Small Nonlinear Contacts,” Physical Review Letter, Vol. 74, 1995, pp. 5092-5059. doi:10.1103/PhysRevLett.74.5092
- M. Ashhab, M. V. Salapaka, M. Dahleh and I. Mezic, “Control of Chaos in Atomic Force Microscopes,” Proceedings of the 1997 American Control Conference, Albuquerque, 4-6 June 1997, pp. 196-202.
- F. M. Battiston, M. Bammerlin, C. Loppacher, R. Luthi, E. Meyer and H. J. Guntherodt, “Fuzzy Controlled Feedback Applied to a Combined Scanning Tunneling and Force Microscope,” Applied Physics Letters, Vol. 72, No. 25, 1998, pp. 25-27. doi:10.1063/1.120635
- S. H. Hsu and L. C. Fu, “Robust Output High-Gain Feedback Controllers for the Atomic Force Microscope Under High Data Sampling Rate,” Proceedings of the 1999 IEEE International Conference on Control Applications, Hawaii, 22-27 August 1999, pp. 1626-1631.
- A. Sebastian, M. V. Salapaka and J. P. Cleveland, “Robust Control Approach to Atomic Force Microscopy,” Proceedings of the 42nd IEEE Conference on Decision and Control, Maui, 9-12 December 2003, pp. 3443-3445.
- R. Vazquez, F. J. Rubio-Sierra and R. W. Stark, “Transfer Function Analysis of a Surface Coupled Atomic Force Microscope Cantilever System,” Proceedings of the 2006 American Control Conference, Minneapolis, 14-16 June 2006, pp. 532-537. doi:10.1109/ACC.2006.1655411
- Y. Wu, Q. Zou and C. Su, “A Current Cycle Feedback Iterative Learning Control Approach to AFM Imaging,” Proceedings of the 2008 American Control Conference, Seattle, 11-13 June 2008, pp. 2040-2045.
- A. Sebastian, A. Gannepalli and M. V. Salapaka, “A Review of the Systems Approach to the Analysis of Dynamic-Mode Atomic Force Microscopy,” IEEE Transactions on Control Systems Technology, Vol. 15, No. 5, 2007, pp. 952-959. doi:10.1109/TCST.2007.902959
- L. X. Wang, “A Course in Fuzzy Systems and Control,” Prentice Hall, Upper Saddle River, 1997.
- C. C. Lee, “Fuzzy Logic in Control System: Fuzzy Logic Controller, Part I and Part II,” IEEE Transactions on Systems, Man and Cybernetics, Vol. 20, No. 2, 1990, pp. 404-435. doi:10.1109/21.52551
- C. W. Tao and J. S. Taur, “Flexible Complexity Reduced PID-Like Fuzzy Controllers,” IEEE Transactions on Systems, Man and Cybernetics, Part B: Cybernetics, Vol. 30, No. 4, 2000, pp. 510-516. doi:10.1109/3477.865168
- A. V. Topalov and O. Kaynak, “Online Learning in Adaptive Neurocontrol Schemes with a Sliding Mode Algorithm,” IEEE Transactions on Systems, Man and Cybernetics, Part B: Cybernetics, Vol. 31, No. 3, 2001, pp. 445-450. doi:10.1109/3477.931542
- P. Pivonka, “Comparative Analysis of Fuzzy PI/PD/PID Controller Based on Classical PID Controller Approach,” Proceedings of the 2002 IEEE World Congress on Computational Intelligence, Honolulu, 12-17 May 2002, pp. 541-546.
- R. K. Mudi and N. K. Pal, “A Self-Tuning Fuzzy PI Controller,” Fuzzy Sets and Systems, Vol. 115, No. 2, 2000, pp. 327-328. doi:10.1016/S0165-0114(98)00147-X
- Y. Zhao and E. G. Collins, “Fuzzy PI Control Design for an Industrial Weigh Belt Feeder,” IEEE Transactions on Fuzzy Systems, Vol. 11, No. 3, 2003, pp. 311-319. doi:10.1109/TFUZZ.2003.812686
- “AD637 High Precision, Wideband RMS-to-DC Converter,” Analog Devices, Inc., Norwood, 2007. http://www.analog.com/static/imported-files/data_sheets/AD637.pdf
- W. Z. Qiao and M. Mizumoto, “PID Type Fuzzy Controller and Parameters Adaptive Method,” Fuzzy Sets and Systems, Vol. 78, No. 1, 1996, pp. 23-35.
- “DT300 Series User’s Manual,” Data Translation, Inc., Marlboro, 2010. https://datatranslation.box.com/shared/static/266a9bd237838583dd3b.pdf
NOTES
1This is a revised and extended version of the paper, “Constant force feedback controller design using fuzzy technique for a tapping mode Atomic Force Microscope,” published at the 2009 Chinese Control and Decision Conference.