Materials Sciences and Applications
Vol.4 No.8A(2013), Article ID:35816,14 pages DOI:10.4236/msa.2013.48A003
Analysis of the Tracer Diffusion Phenomena through Cracks in the Porous Media by Means of X-Ray CT
![]()
Graduate School of Science and Technology, Kumamoto University, Kumamoto, Japan.
Email: asato@kumamoto-u.ac.jp
Copyright © 2013 Akira Sato. This is an open access article distributed under the Creative Commons Attribution License, which permits unrestricted use, distribution, and reproduction in any medium, provided the original work is properly cited.
Received June 11th, 2013; revised July 12th, 2013; accepted July 20th, 2013
Keywords: Porous rock; advection; diffusion; contamination; crack; X-ray CT
ABSTRACT
The migration process of contamination materials in the porous rock mass was visualized and analyzed by X-ray CT image data. In this study, Kimachi sandstone, which had approximately 26% porosity, was used as a rock sample. Here two cases of diffusion phenomena were analyzed. One is the case that solute diffuses into the porous rock mass from the crack surfaces, and it simulates the contamination process of rock mass. Another is the case that the solute diffuses out of the porous rock mass, and it simulates the process that the contamination materials spread from highly contaminated sources. It was found that the diffusion phenomena were clearly visualized by X-ray CT method. By introducing the parameter, coefficient of tracer density increment α, quantitative analysis of tracer density became possible, and the relation between the density distribution of tracer and the crack apertures and the relation between the density distribution and porosity distribution became clear.
1. Introduction
Japan has been operating nuclear power plants since 1963. The disposal of the high level radioactive wastes is a serious problem. Because of the problems of the costs and the security, the permanent storage of the high level radioactive wastes on the surface is very difficult, and the geological disposal is thought to be one and the only solution to this problem [1].
In order to access the safety of the disposal site, the leakage of the wasted materials from the disposal site to the biosphere is the crucial factor in the projects. Here the advection and diffusion of the wasted materials due to the water flow in the rock mass is thought to be the main reason, and the evaluation of rock mass as a natural barrier is an important issue in the rock engineering [2-4]. Fractures in the rock masses have important roles in the material transportations and a number of analyses of water and material flow in the fractured rock, such as radionuclide transport in geological repositories [5,6], groundwater contamination in fractured aquifers [7], are conducted. In Japan, the studies related to the material migration problem have been conducted towards mainly two types of rocks, that is, the crystalline rocks such as granite [8] and the sedimentary rocks such as sandstones [9]. In the case of crystalline rocks, the material migration is mainly caused by the fluid flow in the cracks, and the studies such as the analysis of migration process using 3-dimensional channel network system [10] are conducted. Moreover the evaluation of uncertainties related to conceptual models and parameters, such as crack apertures, used in the migration process analysis has been conducted [11,12]. On the other hands, in the case of sedimentary rocks, still the water flow through fractures is a serious problem [13], and rock masses are porous in many cases and the retardation effect of the contamination materials due to the matrix diffusion is expected [14, 15]. However, once the contamination materials are fully stored in the porous rock, it has to be also considered the process that the materials diffuse out of the rock mass into the fractured region. Therefore, not only the water flow through fractures but also the processes of the diffusion into and diffusion out of the rock matrix are inevitable factors of the material migration problem in the sedimentary rocks.
The purpose of this study is to analyze and evaluate the migration and diffusion processes of contamination materials in the porous rock mass. The characteristic point of this study is that the processes are visualized and analyzed by X-ray CT image data. The X-ray CT is one of the useful non-destructive inspection systems, and the applications of the system to the rock engineering field are increasing recently [16-18]. When the target rock mass is porous rock such as sedimentary rocks, the contamination materials migrates with diffusion phenomena into the rock mass. In order to simulate the material migration with diffusion phenomena, Kimachi sandstone which has approximately 26% porosity is used as a rock sample. Here we consider the two cases of material migrations. One is the case that firstly the contamination materials flow in the cracks and that the materials diffused into the rock matrix part. This is the process that the rock has been contaminated by materials. Here high density tracer, the mixture of Potassium Iodide (KI) solution and a medical contrast agent [19], is used as contamination materials. Another is the case that rock is fully contaminated by materials at first. In this case, the water is flowing in the crack, and the process that materials diffuse out of the rock matrix into the water in the crack through crack surfaces is simulated. These migration processes stated above are visualized by X-ray CT scanner system and analyzed through the X-ray CT image data. Generally speaking, the X-ray CT image is very convenient to confirm the geometry of the sample and the transitional phenomena. However, X-ray CT image contains a lot of noise and false information [20]. In order to get rid of the unnecessary information and extract the information related to the tracer migration, the image subtraction method [21] is applied to the X-ray CT image data. Moreover, a new parameter, the coefficient of tracer density increment, is defined. This is the parameter which expresses the density of the tracer in the pores and crack from the X-ray CT images, and the migration and diffusion process can be quantitatively evaluated. In this study, the influence of the crack structure, sedimentary layers and pores towards the material migration process is discussed.
2. X-Ray CT Scanner System
Rock mechanics group of Kumamoto University has been operating industrial use of X-ray CT scanner system (TOSCENNER-20000RE) since 1997 [21] (Figure 1). The maximum X-ray tube voltage is higher than the medical use (300kV/2mA). Therefore, it is suitable for the visualization of higher density materials such as rock samples, and it has been applied to several studies related to rock engineering [17,18,21]. Other important factor of X-ray CT scanner is the number the pixels which composes a CT image. Generally an image is consisted by n x n pixels, and the maximum number is n = 2048 in the case of our system. As for the visualization area, two modes such as f = 150mm and 400mm can be selected. If the pixel number of n = 2048 and visualization area of f = 150 mm are chosen, the minimum pixel size of 0.073mm is available. However, the value means only
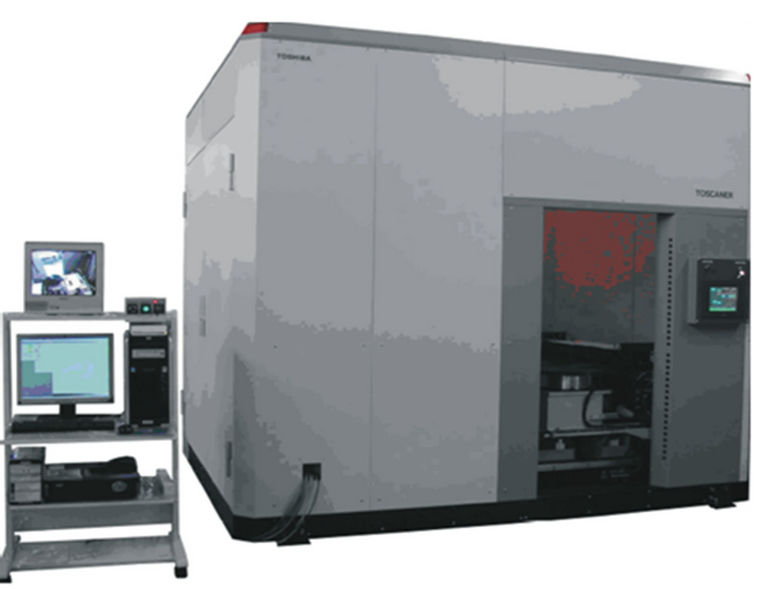
Figure 1. X-Ray CT scanner operated by Kumamoto university (TOSCANNER-20000RE).
the pixel size and different from the definition of the spatial resolution. In order to take one CT image, the scanner has three scan modes such as half, full and double scan mode. The necessary times for tomographying are 3, 5 and 10 minutes respectively. As the scan time becomes longer, the amount of obtained data become lager and the quality of images becomes better. These differences of scan times correspond to the time resolution of the X-ray CT scanner system. In this study, the area of f = 150 mm, pixel size of n = 2048 and the full scan mode are selected.
3. Experimental Methods and Rock Sample
3.1. Rock Sample
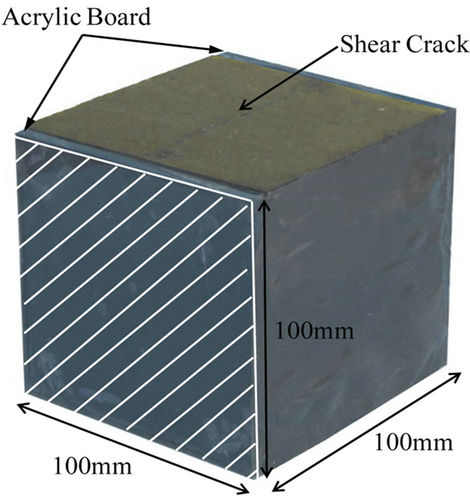
A 100 mm × 100 mm × 100 mm cubic Kimachi sandstone sample shown in Figure 2 is used for the tracer diffusion test. The mean porosity of the sample is 26%. At first, the shear test is conducted and the one major crack was induced at the center of the sample. Acrylic boards are fixed at the side surface of the sample in order to fix the separated blocks (Figure 2(a)). Other surfaces which do not include cracks are sealed by epoxy resin. The coordinate system and tomography regions are also shown in Figure 2(b). As this figure shows, x-axis is taken in the direction perpendicular to the major crack surface. Since tomographying on the horizontal plane is possible in the case of the X-ray CT scanner used in this study, five planes parallel to x-y plane are set as tomography regions.
3.2. Experimental Apparatus and Procedure of Diffusion Tests
In order to observed diffusion phenomena through cracks, two different states are considered in this study. One is the case that the high density tracer flows in the crack, and the solute of the tracer diffuses into the rock matrix
 (a)
(a)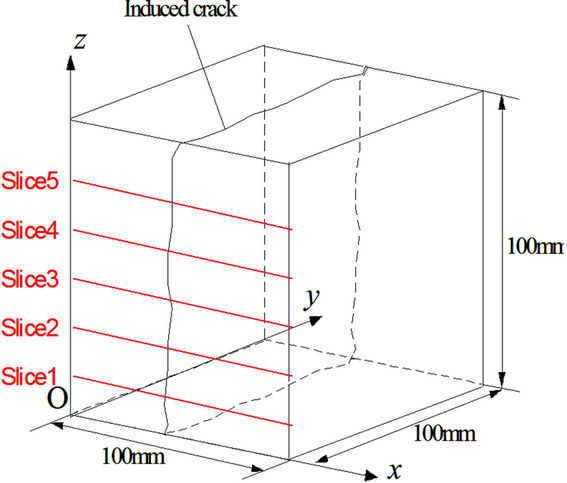 (b)
(b)
Figure 2. Kimachi sandstone rock sample which has share crack at the center. (a) Rock sample; (b) Coordinate system and tomography region.
part from crack surfaces (Case 1). This can simulate the process that the waste materials diffuse into water in the cracks and spreads from a contaminated resource. Another case is that the rock mass is fully saturated by tracer initially, and the solute in the rock matrix diffuses into the crack from crack surfaces (Case 2). This can simulate that the process the waste materials diffuses into water in the cracks and spreads from a contaminated resource.
The tracer/water flow system used in this study is shown in Figure 3. This system is installed in the X-ray CT scanner and the images are taken during diffusion tests. In order to avoid from the X-ray attenuation during diffusion tests, the rock sample is fixed by the acrylic board on the turn table. As shown in Figure 2, the rock sample is located at which the surfaces of induced crack are in the vertical direction. Syringe pump is installed above the rock sample and the tracer or water is push into the rock sample under the constant flow condition. As Figure 4 shows, the tube is fixed at the bottom part of the rock sample and the tracer or water is supplied into the crack. Therefore, the tracer or water mainly flows into the vertical direction in the crack.
In this study, the mixture of Potassium Iodide (KI) so-
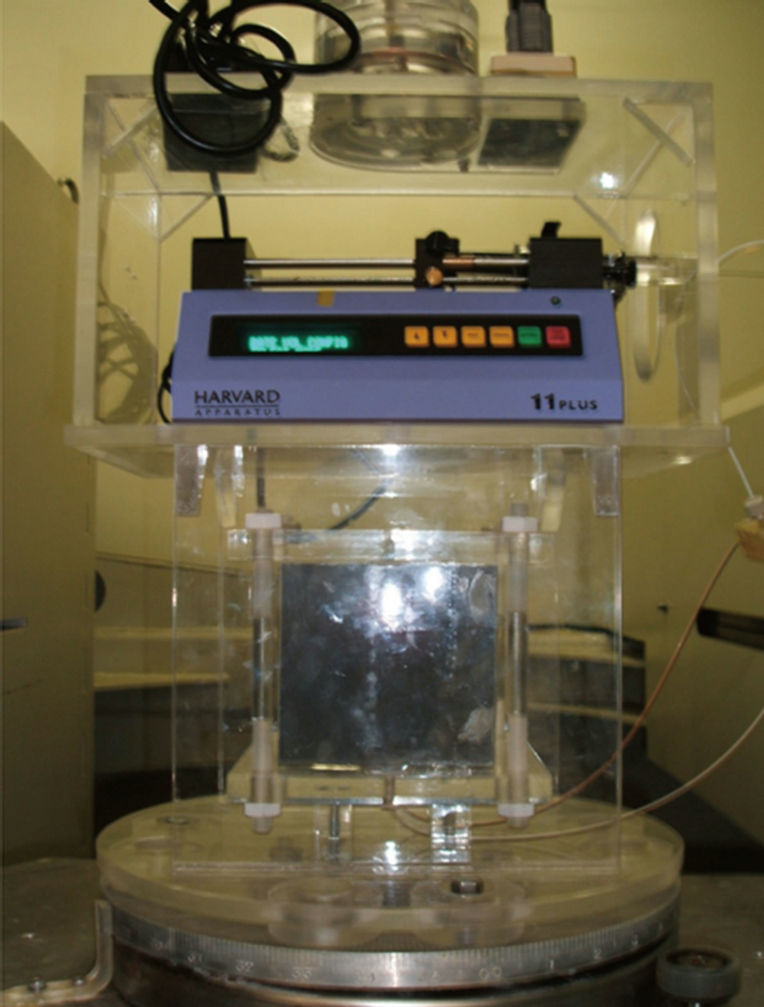
Figure 3. Tracer injection test apparatus.
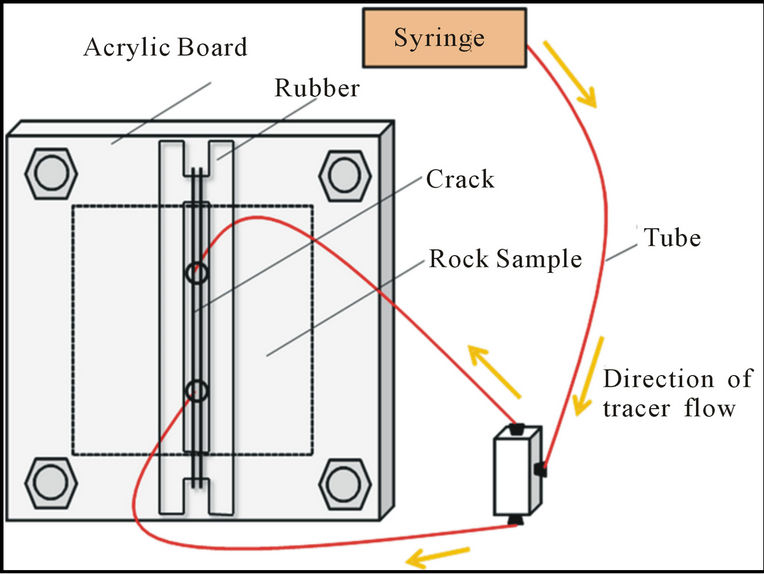
Figure 4. Details of the tracer injection entrance at the bottom of the rock sample.
lution and a medical contrast agent is applied as a tracer. The X-ray CT scanner is the system to visualize the density distribution, and it is necessary to detect the density change in the rock pores or cracks due to the diffusion phenomena. Therefore, the density of the tracer should be high enough in order to detect the density change by CT scanner. In this study, the initial density of the tracer is set to be 1254 kg/m3 which corresponds to 30 weight percent.
4. Visualization of Diffusion Phenomena
4.1. CT Images
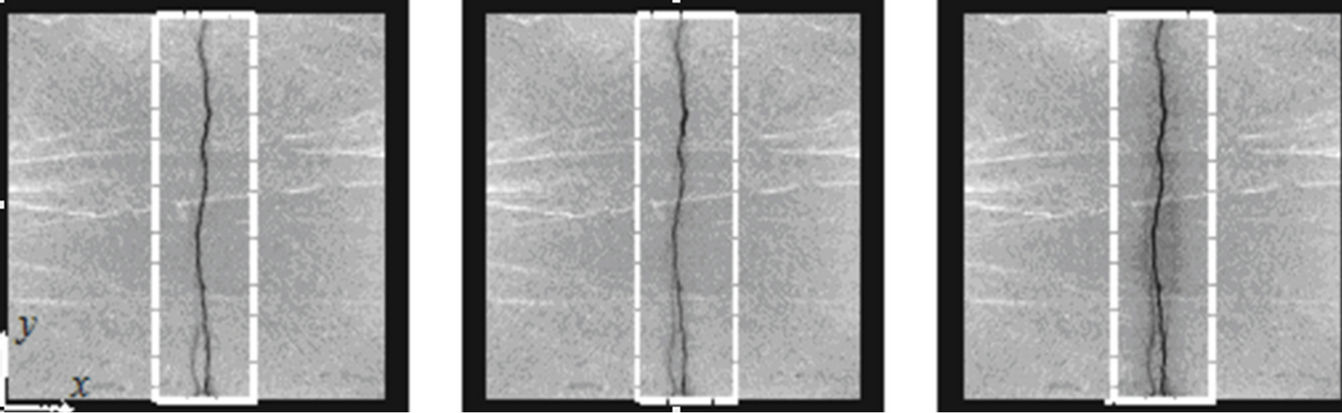
An X-ray CT image in the state that the rock sample is fully saturated by water is shown in Figure 5. This is the state before the diffusion tests and is called initial condition in this study. In the X-ray CT images, relatively higher density regions are expressed as brighter region. On the other hand, lower density regions are expressed dark region. In Figure 5, cracks are filled with water and its density is lower than the one of rock matrix part. In this case, cracks are expressed dark lines at the center of rock sample, and the geometries of induced cracks and approximate distribution of crack aperture are easily confirmed. Moreover, sedimentary layers of sandstone are also confirmed in the figures. Here, the main crack is approximately induced perpendicular to the sedimentary layers.
X-ray CT images during the Case 1 of diffusion tests, that is the case the high density tracer is push into the crack, are shown in Figure 6. Even though the crack part is dark initially, it is confirmed that the crack part is getting brighter since the nominal density becomes higher due to the flow of the high density tracer into the tomography regions (inside of the dotted lines in Figure 6). Then, the rock matrix regions along the cracks are also getting brighter due to the diffusion of tracer solute into rock pores from the crack surfaces. X-ray CT images during the Case 2 of diffusion tests are also show in Figure 7. In this case, the rock sample is fully saturated by the tracer initially and the water is push into the crack. It is confirmed that the region along the crack (inside of dotted line in Figure 7) is getting darker, since the solute in the pores diffuses into the water in the crack and the nominal density becomes lower. As these figures shows, the diffusion phenomena of the tracer in the porous rock can be clearly visualized by the X-ray CT system.
4.2. Extraction of Tracer Information
It is proved that the tracer diffusion is visualized by X-ray CT system. However, those images contain not only the information of the density change due to the diffusion, but also the various kinds of information such as density distribution of rock matrix itself and noise components. In order to get rid of the extra information except for the density change due to the diffusion, the image subtraction method is known as one of the most efficient method. By applying the method, it is also possible to remove the noise components in the images. So called beam hardening (cupping effect) is also the crucial problem in the X-ray CT image analysis in the study utilizing X-ray CT scanner in which the general X-ray tube is installed [20]. This problem becomes serious in the case the density of the photographying target is
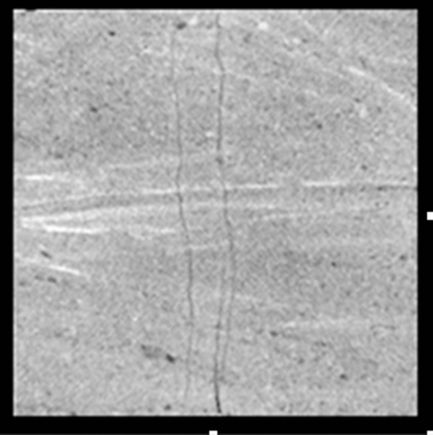
Figure 5. Examples of initial X-ray images.
 (a)
(a)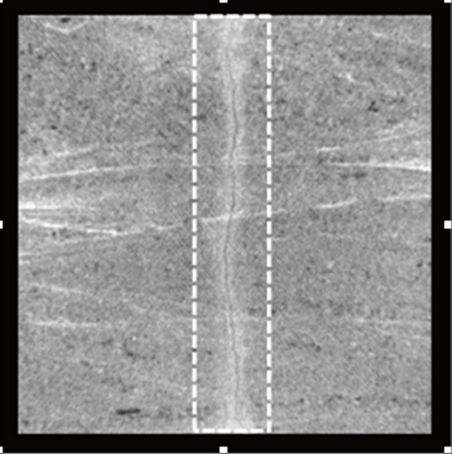 (b)
(b)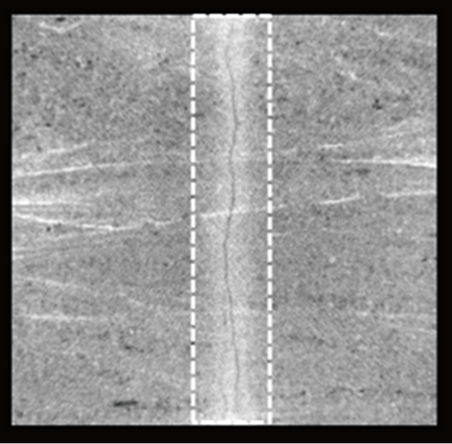 (c)
(c)
Figure 6. X-ray CT images during Case 1 of tracer diffusion test (Slice1). (a) t = 19 minutes; (b) t = 174 minutes; (c) t = 1361 minutes.
higher such as rock sample. The image subtraction method is also effective to the elimination of the beam hardening effect. In this study, the density change due to the diffusion is extracted by applying the image subtraction method to the X-ray CT images.
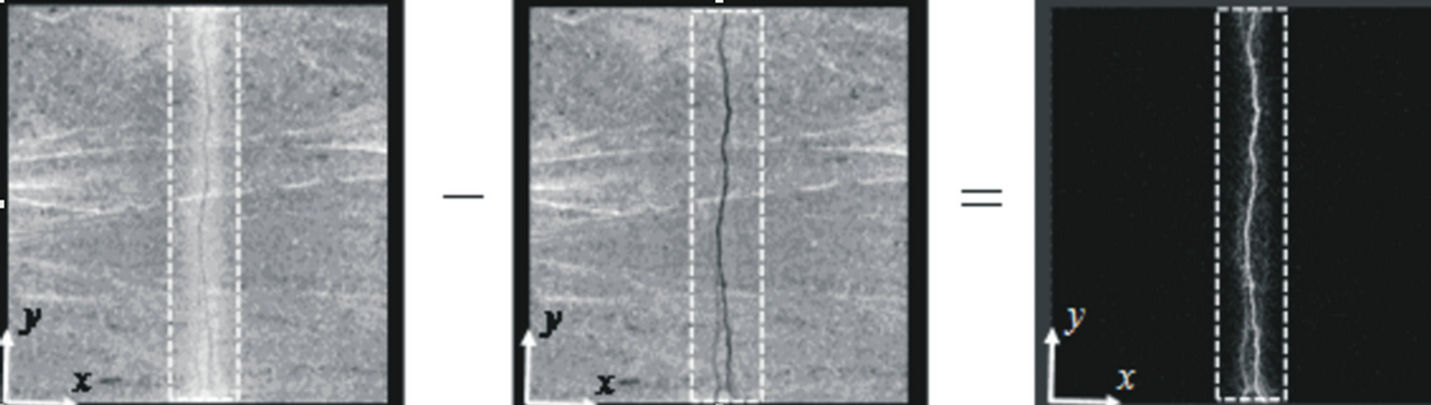
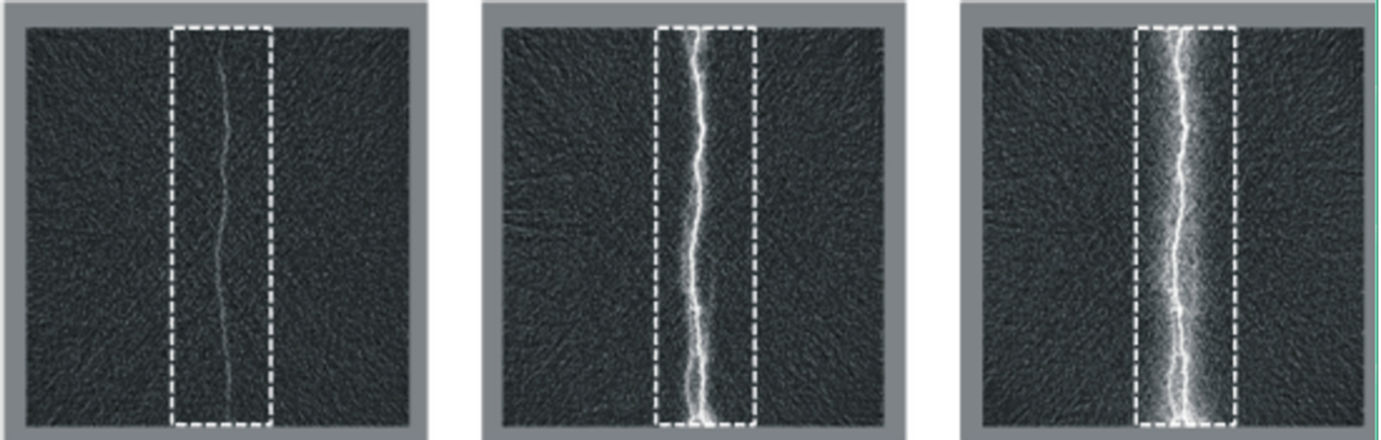
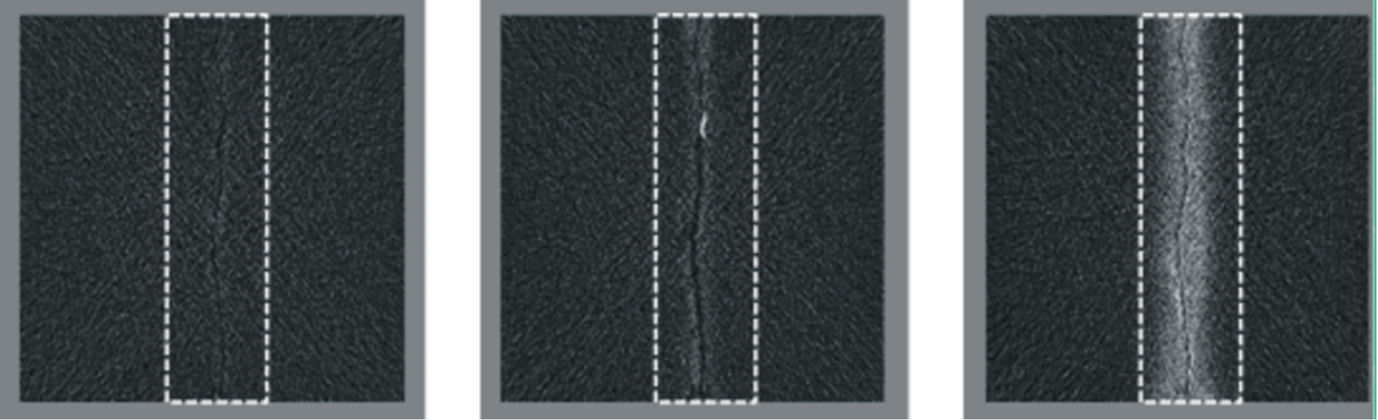
The procedure of the image subtraction method is as follows. Photographying has been conducted in the initial condition which is the state the rock sample is fully saturated by water. This is called initial image. The subtraction is conducted between this initial image and the images after commencement of diffusion tests. The concept of the method is shown in Figure 8. Examples after applying the image subtraction method are also shown in Figure 9 for Case 1 and Figure 10 for Case 2, respectively. As these figures show, heterogeneity of the rock sample and beam hardening effect are eliminated in both cases. Moreover the information of density changes due to the inflow of tracer to the tomography region and the diffusion into the rock matrix part is clearly extracted in images.
 (a) (b) (c)
Figure 7. X-ray CT images during Case 2 of tracer diffusion test (Slice1). (a) t = 19 minutes; (b) t = 186 minutes; (c) t = 1431 minutes.
 (a) (b) (c)
Figure 8. Concept of image subtraction method applied to the tracer test. (a) X-ray CT image after tracer test; (b) Initial CT image; (c) Subtraction image.
 (a) (b) (c)
Figure 9. Images after applying image subtraction method (Case1 at Slice 1). (a) t = 19 minutes; (b) t = 174 minutes; (c) t = 1361 minutes.
 (a) (b) (c)
Figure 10. Images after applying image subtraction method (Case 2 at Slice 1). (a) t = 0 minutes; (b) t = 186 minutes; (c) t = 1431 minutes.
4.3. Distribution of CT Value Increment
The distribution of CT value increment due to the tracer inflow and diffusion are obtained from CT image data as shown in Figures 9 and 10. In order to identify the regions where the tracer diffuses for the Cases 1 and 2, CT values of pixels are stacked, and the projections of CT values change are evaluated in the y-axis direction. The distributions of CT value increment along the x-axis are shown in Figure 11. As this figure shows, the region where the tracer has been diffused during the tests is identified within 20 mm on the both side of the crack surfaces. Therefore, the region is defined as analytical region in this study.
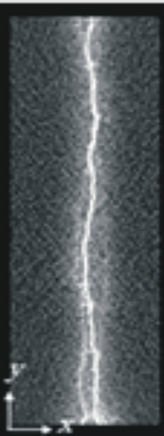
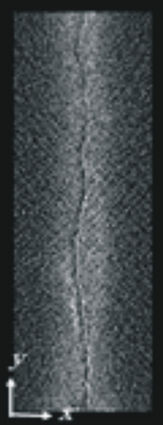
As stated above, the crack direction is almost parallel to the y-axis. Here simple moving averaging of 41 pixels along the y-axis is conducted and then the values are projected on to the y-axis. The distributions of CT value increment along the crack direction (y-axis direction) are shown in Figure 12 for Case 1 and in Figure 13 for Case 2. As these figures show, CT values are increasing with time and it is observed that the diffusion progresses faster in the Case 1 (the case the tracer diffuses into rock matrix part from crack surfaces).
5. Analysis of Diffusion Process
5.1. Definition of Tracer Density Increment
As stated before, it is possible to extract the increment of CT values due to the tracer migration and diffusion from X-ray CT image data. However, the value of the increment depends on the total amount of the tracer existing on the tomography region, and it takes larger value in the case that the aperture of induced cracks is larger and the more tracer can exist. That is, the increment of CT values is also including the information of crack aperture simultaneously. In order to analyze the tracer diffusion phenomena from crack surface into rock matrix part (Case 1) and the one out from rock matrix part (Case 2), it is necessary to extract the information of density of the tracer
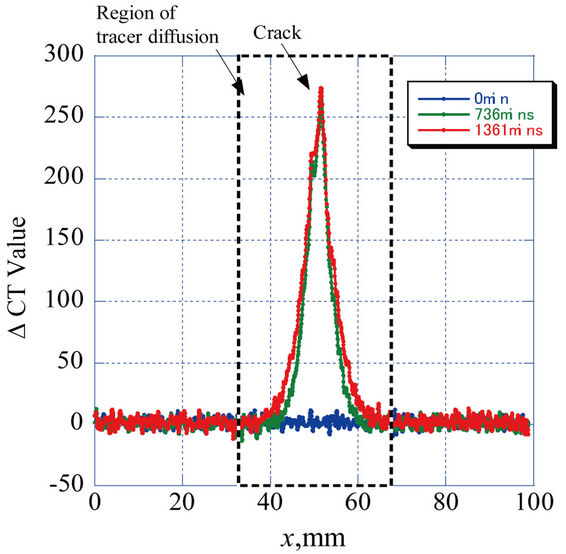
Figure 11. Distribution of CT value increment due to the tracer diffusion extracted by image subtraction method for Case 1.
 (a)
(a)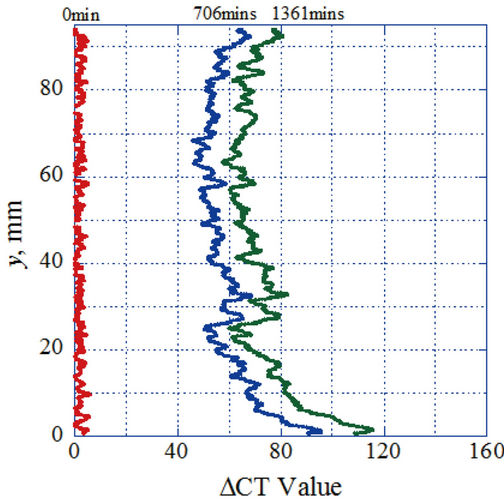 (b)
(b)
Figure 12. Extraction of CT value increment by image subtraction and moving averaging for Case 1. (a) CT image; (b) Distribution of CT values.
in the rock sample. The procedure of the method is as follows.
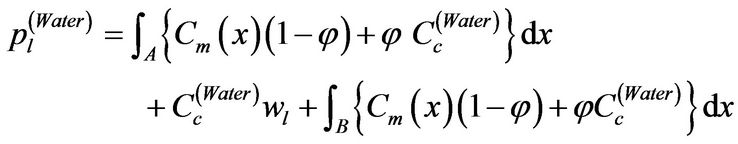
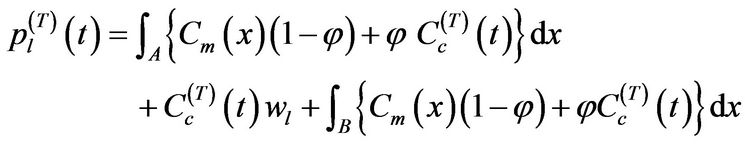
Here, the region which contains rock matrix parts and induced cracks becomes an analytical region, and the analytical region Vl is set as shown in Figure 14. The value l represents the number as the analytical region. Since the region contains a crack, the region is separated into three parts, that is Section A, crack part and Section B. The porosity of the rock and the crack aperture are denoted by f and wl respectively. At first, let us consider the dry condition of rock, that is, the condition that the inside of cracks and pores are filled with air. The projection pl of the analytical region Vl into the x-axis direction is given by
 (1)
(1)
where Cm is the CT value of minerals which compose the rock sample. Cc is also the CT value of the liquid which fills cracks and rock pores, and the superscript of (Air) represent the kind of liquid.
The equation (1) is express as the summation of three projections of rock sample. That is1) The projection of rock minerals;
2) The projection of the liquid in the rock pores;
3) The projection of the liquid in the cracks.
Here also, the projection when the cracks and pores of rock sample are filled with water is given by
 (a)
(a)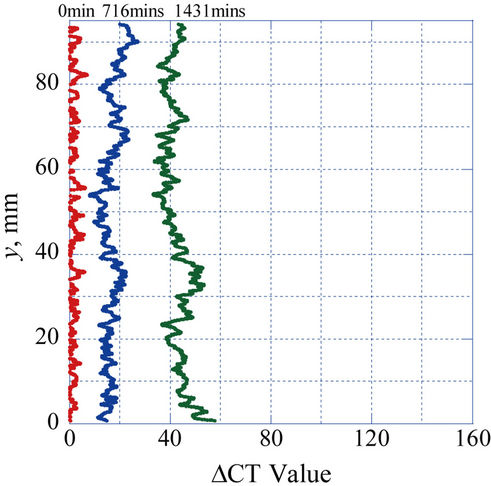 (b)
(b)
Figure 13. Extraction of CT value increment by image subtraction and moving averaging for Case 2. (a) CT image; (b) Distribution of CT values.
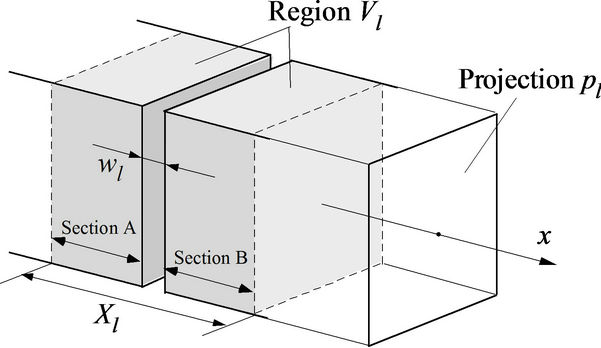
Figure 14. Analytical region for the evaluation of the tracer density increment.
(2)
where  is the CT values of water.
When the high density tracer flows in cracks as Case 1, the water initially existed in cracks is gradually replaced by the tracer. Moreover, the tracer diffuses into the rock matrix part and the nominal density of the liquid in the pores gradually changes. In the case of Case 2, the tracer diffuses out of the rock matrix part into the water in the crack, and the nominal density of the liquid in the pores and crack also gradually changes. That is, the density and the CT value of tracer is a function of time t due to the flow and diffusion. Therefore, the projection after commencement of diffusion tests  is given by
(3)
where  is the CT values of the liquid when the tracer migrates and diffuses in the analytical region. Here let us take a subtraction between equations (1) and (2), and the following relation is obtained.
 (4)
(4)
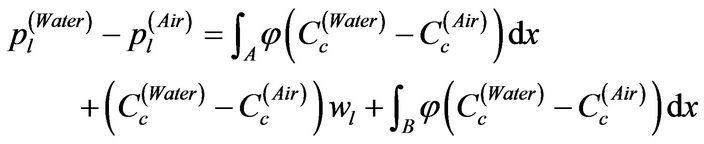
This procedure corresponds to the image subtraction between the dry condition and the fully saturated condition by water. The  in the equation (4) is the difference of CT values between the air and water. In the same way, the subtraction between equations (3) and (2) are given by as follows.
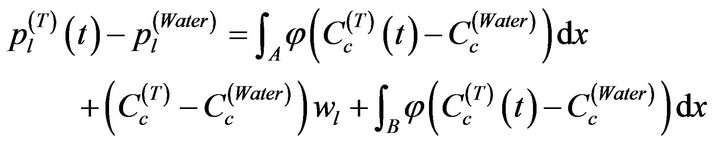 (5)
(5)
From equation (5), it is confirmed that this equation contains not only the information of density change due to the tracer flow and diffusion, but also the information related to the geometry of the rock such as crack aperture wl and porosity f.
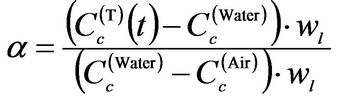
Let us consider the difference of projections after commencement of diffusion tests given by equation (5) is proportional to the difference of the projection between the water and air. When the ratio between equations (5) and (4) is noted by a, the following relation is obtained.
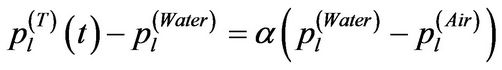 (6)
(6)
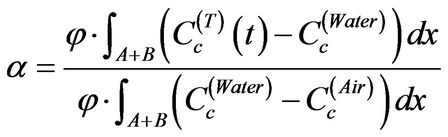
Then the a is given by (7)
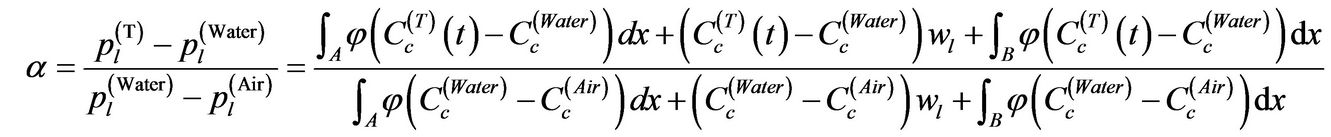
here, let us discuss the meaning of the equation (7). When the region which contains only rock matrix part as a analytical region, cracks does not exist and crack aperture wl is 0. Therefore, equation (7) is rewritten as follows.
 (8)
(8)
When the integrations in equation (8) are conducted in the same intervals, the a represents the quantity which the density difference between the tracer in the rock sample and the water is normalized by the density difference between the water and the air. Moreover, when only the crack part is set as an analytical region, equation (7) is rewritten as follows.
 (9)
(9)
In this case also, the a represents the quantity which the density difference between the tracer in the crack and the water is normalized by the density difference between the water and the air. That is, the relations stated above show that it is possible to extract only the information related to the density of the tracer itself in the pores and cracks of rock sample. Here after, this value is called the coefficient of tracer density increment. When the rock sample has very dense structure and the porosity is very low such as granite rock, equation (7) is approximated as equation (9) by assuming f = 0. In this case, the amount of tracer due to the diffusion is negligible, and it is possible to extract the tracer information even if the analytical region includes rock matrix part.
5.2. Relation between Rock Structure and Tracer Diffusion
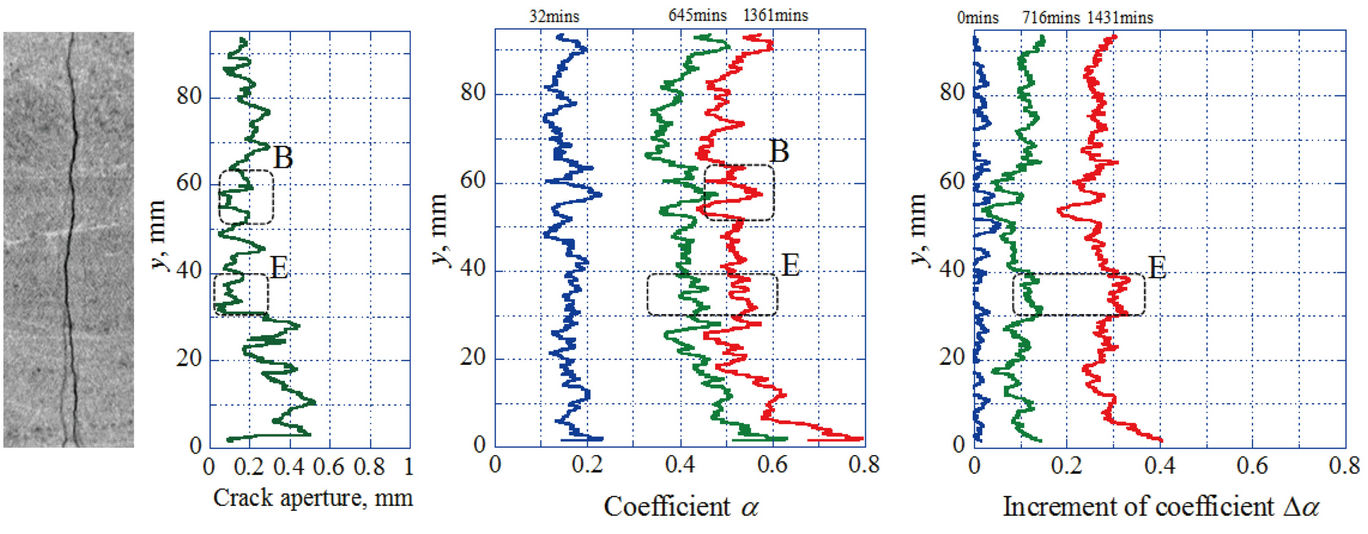
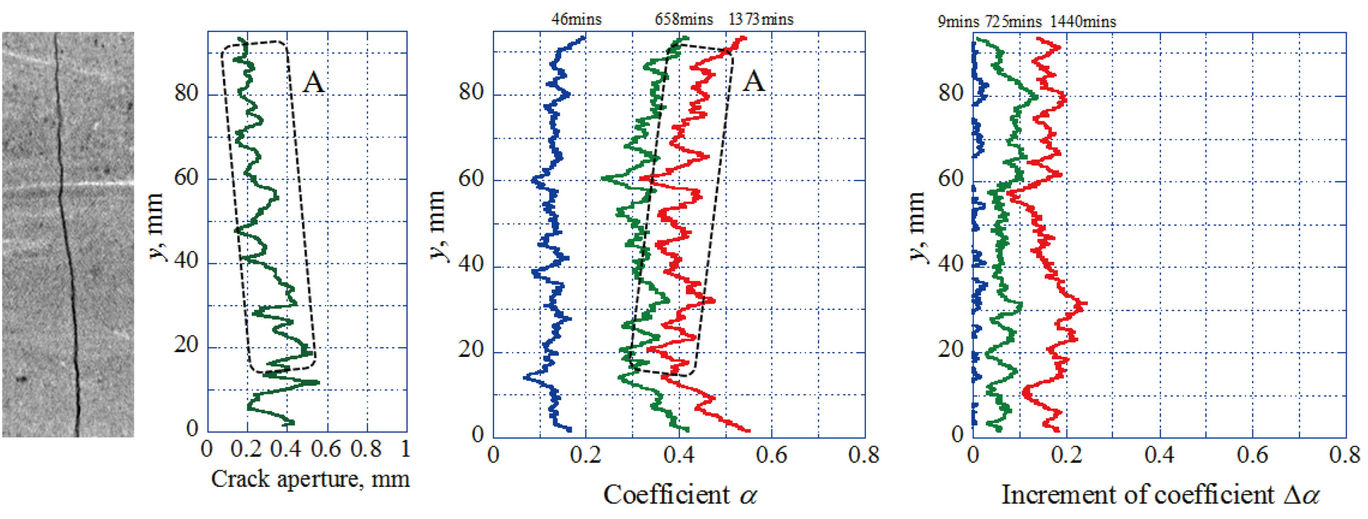
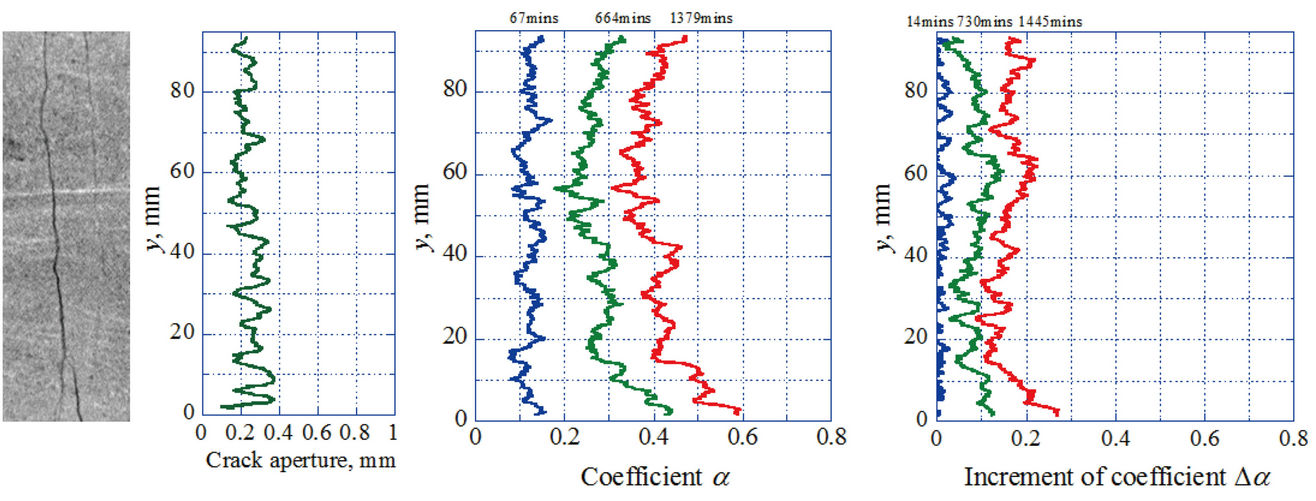
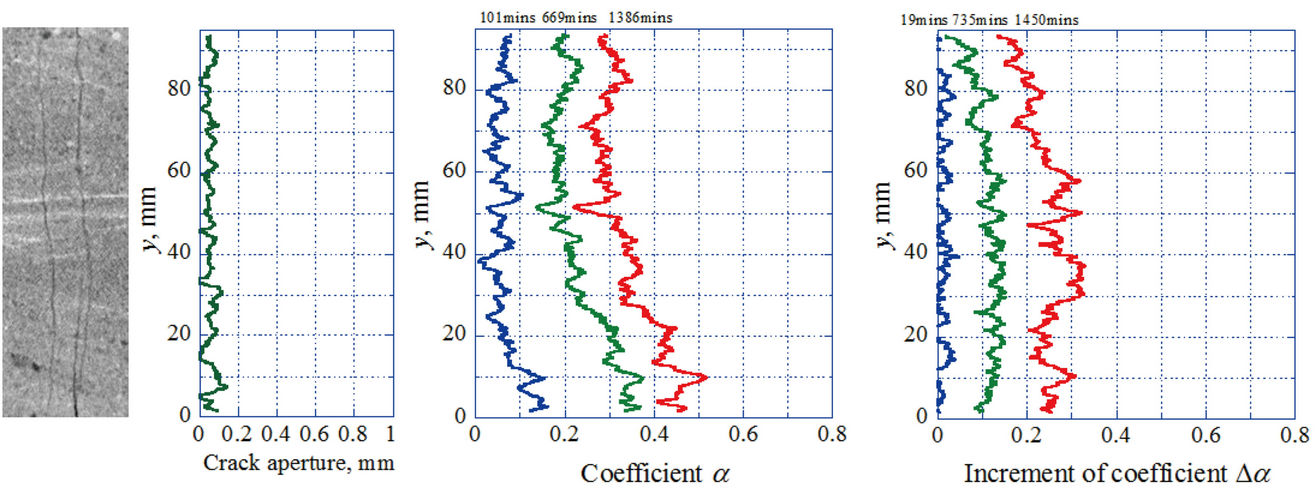
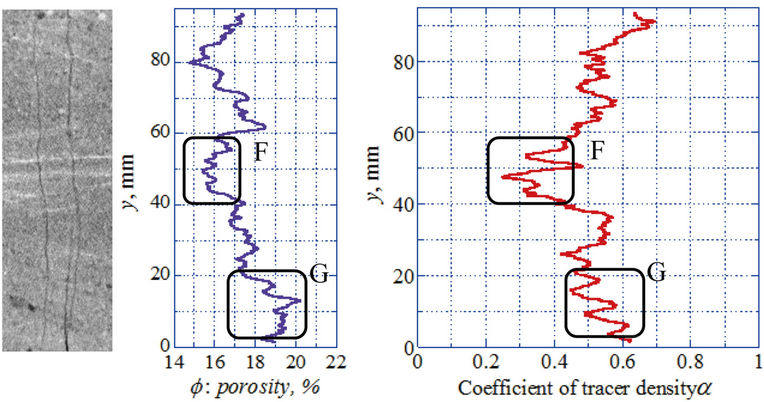
The coefficients of tracer density increment in the rock matrix are evaluated from the CT value distribution on each tomography region obtained by diffusion tests. At first, the results of the Case 1 are shown in graphs (c) of Figures 15-19. As for the value of a, the moving averaging in the y-axis direction is conducted and the value of each pixel is projected on the y-axis. As stated before, the large value of a represents that the density change in the analytical region is larger. That is, the more tracer diffused in the region during relatively short time compare with the other regions. As for the Case 2, initially the rock sample is fully saturated by tracer and the tracer diffuses out of rock matrix part from the crack surfaces during the test. Therefore, the density change from the fully saturated condition is analyzed in the Case 2. Here, the deference of the coefficient a from the initial value, that is Da, is evaluated. The distributions of Da are shown in graphs (d) of Figures 15-19. In this case also, the moving averaging in the y-axis direction is conducted and the value Da of each pixel is projected on the y-axis. For the comparison, X-ray CT images of the analytical regions which include induced cracks, crack aperture distributions are also shown in Figures 15-19.
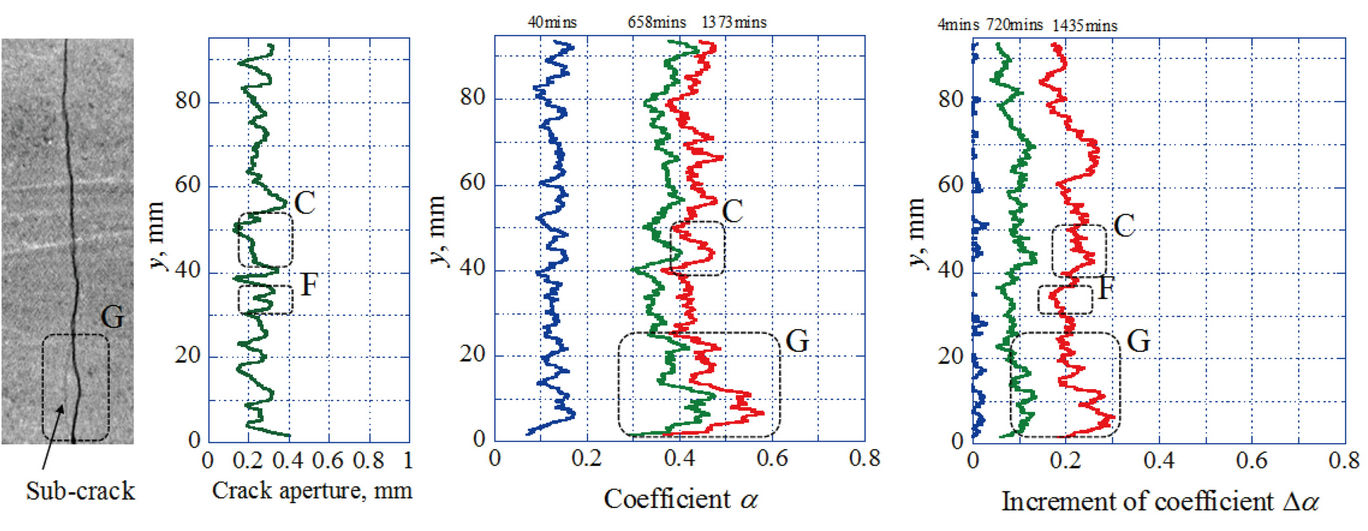
Firstly, let us discuss the relation between tracer diffusion and crack structure for Case 1. By focusing on the crack aperture distribution and the distribution of tracer diffusion, the value of a tends to become smaller at where the crack aperture is larger in the case that the single crack exists in the tomography region such as Slice 3 (Figure 17, region A). On the other hand, the value of a tends to become larger at where the crack aperture is smaller as shown in region B of Figure 15 and in region C of Figure 16. This means that the much tracer diffused into the rock mass at the region near the small aperture. The water in the small crack region is easily replaced by the tracer, and also the tracer is rapidly supplied at the region. This is because that the tracer is injected into the crack under the constant flow condition and that the flow velocity in the region of small crack aperture will be faster. As a result, the tracer density in the crack of small aperture tends to be relatively higher and the density gradient becomes larger. Secondly, let us focus on the region where the multiple cracks exist in a region. As Figure 16 (a) shows, another crack, except for the induced crack which consists the main fracture, is very small and it may be separated from the major crack. Here let us call these cracks are sub-cracks. Region G in Figure 16 (Slice 2) is an example that the sub-crack is observed, and the value of a in the rock matrix part is larger. In this case, the area of crack surfaces is larger due to the existence of sub-cracks, much tracer can diffuse into rock matrix part.
Let us discuss the relation between tracer diffusion and crack structure for Case 2. The relation between the crack aperture distribution and the distribution of tracer which diffuses out of the rock matrix part is discussed. Generally the value of Da becomes larger at the region where the crack aperture is relatively small. The Slice4 and 5 (Figure 18 and Figure 19) are examples that the crack aperture distribution is small all over the tomogram-
|
|
 (a) (b) (c) (d)
Figure 15. Distribution of the coefficient of tracer density increment in the rock matrix part (Slice 1). (a) CT image; (b) Crack aperture distribution; (c) Distribution of a during diffusion test of Case 1; (d) Distribution of a during diffusion test of Case 2.
 (a) (b) (c) (d)
Figure 16. Distribution of the coefficient of tracer density increment in the rock matrix part (Slice 2). (a) CT image; (b) Crack aperture distribution; (c) Distribution of a during diffusion test of Case 1; (d) Distribution of a during diffusion test of Case 2.
 (a) (b) (c) (d)
Figure 17. Distribution of the coefficient of tracer density increment in the rock matrix part (Slice 3). (a) CT image; (b) Crack aperture distribution; (c) Distribution of a during diffusion test of Case 1; (d) Distribution of a during diffusion test of Case 2.
 (a) (b) (c) (d)
Figure 18. Distribution of the coefficient of tracer density increment in the rock matrix part (Slice 4). (a) CT image; (b) Crack aperture distribution; (c) Distribution of a during diffusion test of Case 1; (d) Distribution of a during diffusion test of Case 2.
 (a) (b) (c) (d)
Figure 19. Distribution of the coefficient of tracer density increment in the rock matrix part (Slice 5). (a) CT image; (b) Crack aperture distribution; (c) Distribution of a during diffusion test of Case 1; (d) Distribution of a during diffusion test of Case 2.
phy region, the Da take relatively lager values. Let us discuss this tendency in the local regions, such as region E in Figure 15 and region C in Figure 16. In these regions, crack aperture is relatively small in each tomography region and the value of Da takes relatively lager values. On the other hand, in some region where crack aperture is relatively larger, such as region F in Figure 16, the value of Da takes relatively small values. This is because that the flow velocity in the crack will be faster at the region of small crack apertures, and the diffused tracer is smoothly flown out of the tomography region. Therefore, the density gradient between the water in the crack and the rock matrix is always larger and much tracer is diffused out of the matrix.
At the region where the sub-crack exists, such as region G in Figure 16, the value Da also tends to take relatively lager values at the region. However, Slice 1 (Figure 15) also contains sub cracks, the value Da is not so larger. The amount of migrated material is influenced by the connectivity of cracks and how much cracks contribute to the fluid flow.
5.3. Relation between Porosity and Tracer Diffusion
The relation between the porosity of the rock sample and the diffusion phenomena is discussed. The porosity distribution is evaluated from CT images, and the procedure is as follows. The rock sample is firstly dried completely under the temperature of 104 degrees Centigrade. The dry condition is confirmed by measuring the weight change. Then, the rock sample is fully saturated by water. Samples are put in the water vessel and the vessel is kept in the vacuum chamber. Saturation is also confirmed by measuring the weight change. Here, X-ray CT images are taken in both dry and water saturated conditions. By applying image subtraction method to the images, the increment of CT value which corresponds to the density change due to the water saturation is extracted. The increment of CT value represents the volume of the water which is permeated into the rock sample, and it corresponds to the porosity.
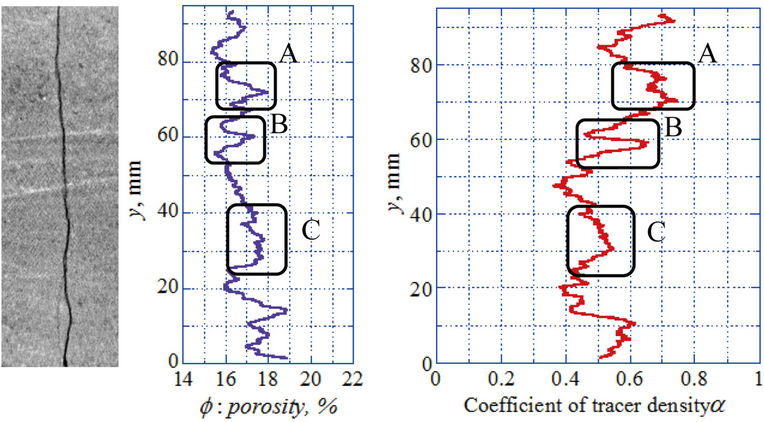
Let us discuss the relation between the porosity and the amount of tracer stored in the rock matrix. The distibution of porosity along the crack, the distributions of α when the rock sample is fully saturated by tracer, that is the condition of initial state of Case 2, are shown in Figures 20-23 together with the CT images on the slice and the CT value distribution of rock matrix part. The tendency is confirmed that amount of stored tracer depends on the porosity. The regions A, B and C in Figure 20 are the region where the porosity is relatively is relaively higher and the much tracer is stored. The same tendency is observed in region G in Figure 23. On the other hand, the amount of tracer is smaller in the region F in Figure 23 which is relatively low porosity region. However, the region E in Figure 22 is the opposite example that the relatively much tracer is stored in the low porosity region. The region D in Figure 21 is another example of the higher porosity region due to the existence of relatively large pore as shown in X-ray CT image. However, the value of α at the initial condition of Case 2 is not so high. This is because of the large pore confirmed in region D is almost isolated from others and the connectivity of pores is also an important factor. Figure 24 shows the 3-imenional pore distribution image of Kimachi sandstone taken by micro-focus X-ray CT system. The bright region represents pores, and it is confirmed that the relatively larger pores are connected by very narrow paths like as a bottle neck. In this case, the tracer has to diffuse though these narrow paths and the amount of diffused tracer is not only governed by the porosity but also by the narrow paths.
5.4. The Change of α with Time
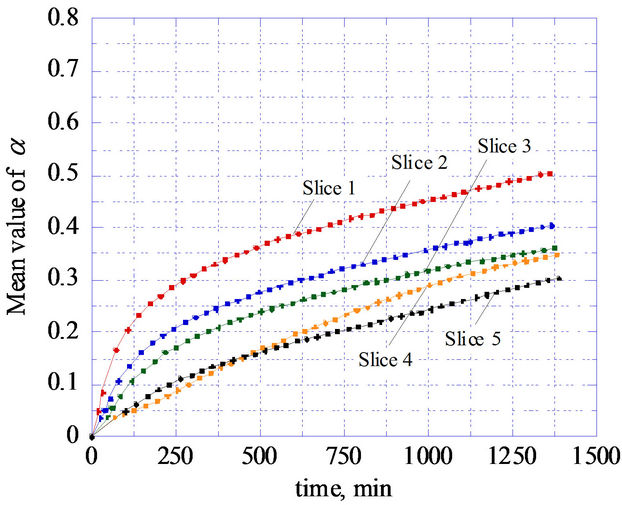
The change of the mean value of α with time on each slice is shown in Figure 25. This is the mean value of α in the analytical region and it represents the mean density of tracer which exists in the pores of rock sample. Figures 25(a) and (b) are the distribution for Case 1 and Case 2 respectively. As for Case 1, the rapid increase of is observed for each slice, since the density gradient at the initial stage of diffusion is very large. The absolute value of α is in order of the distance from the inlet surface, that is the slice number. The slice 1 is the closest tomography region and the density of the tracer in the crack should be higher. As the distance from the inlet surface is longer, the tracer has diffused into the rock matrix part and the density in the crack becomes lower when the tracer reaches to the farther tomography region. As a result, the mean value of α on the farther tomogramphy region is smaller. In the case that some contaminated
 (a) (b) (c)
Figure 20. Relation between porosity, CT value distribution of rock matrix part and the amount of diffused tracer at the initial condition of Case 2 (Slice 2). (a) CT image; (b) Prosity distribution; (c) Initial distribution of α for Case 2.
 (a) (b) (c)
Figure 21. Relation between porosity, CT value distribution of rock matrix part and the amount of diffused tracer at the initial condition of Case 2 (Slice 3). (a) CT image; (b) Prosity distribution; (c) Initial distribution of α for Case 2.
 (a) (b) (c)
Figure 22. Relation between porosity, CT value distribution of rock matrix part and the amount of diffused tracer at the initial condition of Case 2 (Slice 4). (a) CT image; (b) Prosity distribution; (c) Initial distribution of α for Case 2.
fluid flows in the fractured rock masses, the solute of the fluid diffuses in the rock mass during the flow process. That is, this result represents that the density of the contaminated solute in fluid becomes smaller at the farther point from the contamination source and that the porous media such as sandstones works as rapping system of
 (a) (b) (c)
Figure 23. Relation between porosity, CT value distribution of rock matrix part and the amount of diffused tracer at the initial condition of Case 2 (Slice 5). (a) CT image; (b) Prosity distribution; (c) Initial distribution of α for Case 2.
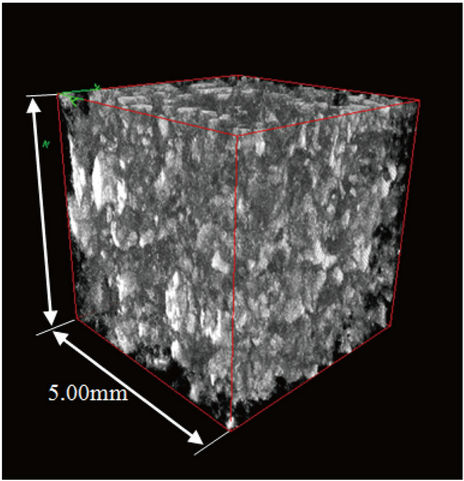
Figure 24. Three-dimensional pore distribution image of Kimachi sandstone taken by micro-focus X-ray CT system.
contamination materials.
The significant differences depends on the distance from the inlet surface, that is the slice number, are not observed as for the Case 2. In this case, the mean density gradient between the water in the crack and the tracer in the pores at the initial condition should be almost same at each slice. Then the tracer diffuses almost simultaneously from the crack surfaces. That is, once the fractured rock mass is fully contaminated by some materials, the solute in stored in the pores are gradually and equally diffuses out of rock mass.
6. Conclusions
The purpose of this study is to analyze and evaluate the migration process of contamination materials in the porous rock mass. Especially we focused on the two different kinds of diffusion phenomena between the fluid in cracks and porous rock mass. One is the case that the high density tracer flows in the crack, and the solute of the tracer diffuses into the rock matrix part from crack surfaces (Case 1). Another case is that the rock mass is fully saturated by tracer initially, and the solute in the rock matrix diffuses into the crack from crack surfaces
 (a)
(a)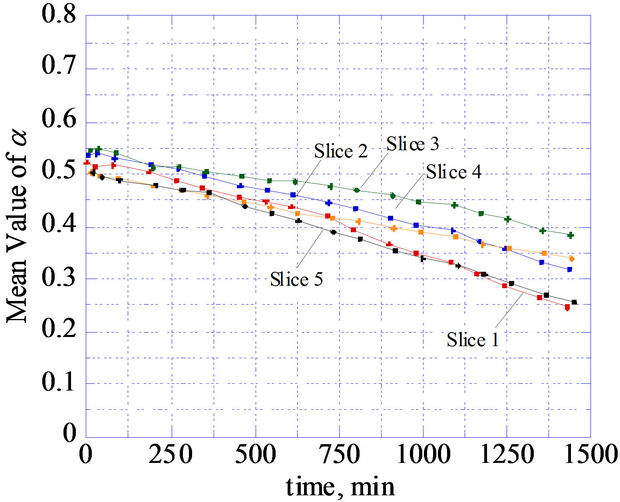 (b)
(b)
Figure 25. Change of the mean value of α with time. (a) Case 1; (b) Case 2.
(Case 2). The characteristic point of this study is that the diffusion phenomena is visualized and analyzed by X-ray CT image data. In order to extract the density change due to the diffusion, the coefficient of tracer density increment is defined and the quantitative relation between the geometry of porous rock sample and amount of diffused tracer for each Case 1 and Case 2.
As for Case 1, it is found that the value of α tends to become larger at where the crack aperture is smaller in the case that the single crack exists by focusing on the crack aperture distribution. The velocity of the fluid becomes faster in the small crack region since the fluid is injected under the constant flow condition. The water in the region is easily replaced by the tracer, and also the tracer is rapidly supplied at the region. As for Case 2, it is also found that the value of Dα becomes larger at the region where the crack aperture is relatively small. This is also the same reason as the Case 1 that the fluid velocity becomes faster at the small crack region and the density gradient tends to be larger. The existence of subcrack also influences the results. However, it depends on the connectivity of cracks and how much cracks contribute to the fluid flow.
Porosity is another factor which influences the diffusion phenomena. In many cases, the region where the porosity is relatively higher and the much tracer is stored. However, in the case of Kimachi sandstone, the relatively larger pores are connected by very narrow paths like as a bottle neck. In this case, the tracer has to diffuse though these narrow paths and the amount of diffused tracer is not only governed by the porosity but also by the narrow paths.
The change of mean value of α with time on each tomography region is also evaluated for both cases. As for Case 1, the rapid increase of α is observed for each slice, since the density gradient at the initial stage of diffusion is very large. The absolute value of α is in order of the distance from the inlet surface. However, the significant differences depended on the distance from the inlet surface are not observed as for the Case 2. This is because that the mean density gradient between the water in the crack and the tracer in the pores at the initial condition should be almost same at each slice. Then the tracer diffuses almost simultaneously from the crack surfaces.
REFERENCES
- JNC, “Project to Establish the Scientific and Technical Basis for HLW Disposal in Japan,” JNC Technical Report, Japan Nuclear Cycle Development Institute, Ibaraki, 2000.
- S. S. D. Foster, “The Chalk Groundwater Tritium Anomaly—A Possible Explanation,” Journal of Hydrology, Vol. 25, No. 1-2, 1975, pp. 159-165. doi:10.1016/0022-1694(75)90045-1
- M. Mazurek, W. R. Alexander and A. B. MacKenzie, “Contaminant Retardation in Fractured Shales: Matrixdiffusion and Redox Front Entrapment,” Journal of Contaminant Hydrology, Vol. 21, No. 1-4, 1996, pp. 71-84. doi:10.1016/0169-7722(95)00034-8
- P. M. Jardine, W. E. Sanford, J. P. Gwo, O. C. Reedy, D. S. Hicks, J. S. Riggs and W. B. Bailey, “Quantifying Diffusive Mass Transfer in Fractured Shale Bedrock,” Water Resource Research, Vol. 35, No. 7, 1999, pp. 2015-2030. doi:10.1029/1999WR900043
- E. A. Sudicky and Eo. Frind, “Contaminant Transport in Fractured Porous Media: Analytical Solutions for a System of Parallel Fractures,” Water Resource Research, Vol. 18, No. 6, 1982, pp. 1634-1642. doi:10.1029/WR018i006p01634
- H. H. Liu, S. Mukhopadhyay, N. Spycher and B. M. Kennedy, “Analytical Solutions of Tracer Transport in Fractured Rock Associated with Precipitation-Dissolution Reactions,” Hydrogeology Journal, Vol. 19, No. 6, 2011, pp. 1151-1160. doi:10.1007/s10040-011-0749-7
- R. A. Freeze and J. A. Cherry, “Groundwater,” Prenticehall, Englewood Cliffs, 1979.
- H. Saegusa, et al., “Final Report on the Surface-Based Investigation (Phase I) at the Mizunami Underground Laboratory Project,” JAEA-Research, Japan Atomic Energy Agency, Ibaraki, 2007.
- K. Ota, et al., “Horonobe Underground Research Laboratory Project Synthesis of Phase I Investigations 2001- 2005,” JAEA-Research, Japan Atomic Energy Agency, Ibaraki, 2007.
- Y. Ijiri, A. Sawada, K. Sakamoto, W. S. Dershowitz, M. Uchida, K. Ishiguro and H. Ueki, “Evaluation of Scale Effects on Hydraulic Characteristics of Fractured Rock Using Aperture Network Model,” Journals of the Japan Society of Civil Engineers, Vol. 694, 2001, pp. 229-243.
- Y. Ijiri, A. Hata, K. Hosono and A. Sawada, “Study on Uncertainties of Radionuclide Migration Parameter Values Obtained from in Situ Tracer Tests,” Journals of the Japan Society of Civil Engineers, Vol. 778, No. III-69, 2004, pp. 85-97.
- K. Hatanaka, M. Uchida, M. Shimo, H. Yamamoto and S. Kumamoto, “Laboratory Experiment on the Hydraulic and Transport Properties of Fractured Soft Sedimentary Rocks,” Proceedings of the 33rd Annual Symposium on Rock Mechanics, Tokyo, 29-30 January 2004, pp. 313- 318.
- I. Neretnieks, “Solute Transport in Fractured Rock-Applications to Radionuclide Waste Repositories,” Flow and Contaminant Transport in Fractures Rock, Academic Press, San Diego, 1993, pp. 39-127.
- H. Yoshida, H. Sato and T. Semba, “Evaluation of an Investigation Methodology for Nuclide Retardation by Matrix Diffusion,” Journal of the Japan Society of Engineering Geology, Vol. 43, No. 2, 2002, pp. 24-34.
- T. Hirono, S. Nakashima, W. Lin and M. Takahashi, “Delay Effect on Advection and Diffusion Phenomena by Physicochemical Change of Pore Water in Nanopores,” Journal of the Japan Society of Engineering Geology, Vol. 45, No. 3, 2004, pp. 118-124.
- W. C. Zhu, J. Liu, D. Elsworth, A. Polak, A. Grader, J. C. Sheng and J. X. Liu, “Tracer Transport in Fractured Chalk: X-Ray CT Characterization and Digital-Image-Based (DIG) Simulation,” Transport in Porous Media, Vol. 70, No. 1, 2007, pp. 25-42. doi:10.1007/s11242-006-9080-5
- A. Sato, T. Arimizu, H. Yonemura and A. Sawada, “Visualization and Analysis of the Tracer Migration Process in the Crack by Means of X-Ray CT,” Journal of MMIJ, Vol. 125, No. 4-5, 2009, pp. 146-155.
- A. Sato, H. Yonemura and K. Sasa, “Analysis of Advection and Diffusion Phenomena in Cracks and into Rock Matrix Parts of Porous Rock by X Rays CT Method,” Journal of MMIJ, Vol. 126, 2010, pp. 647-653. doi:10.2473/journalofmmij.126.647
- D. Fukahori, A. Sato and K. Sugawara, “Development of a New X-Ray CT Permeation Test System and Application to Porous Rocks,” Proceedings of 2006 GeoCongress, Atlanta, February 26-March 1 2006.
- R. A. Ketcham and W. D. Carlson, “Acquisition, Optimization and Interpretation of X-Ray Computed Tomographic Imagery; Applications to the Geosciences,” Computers and Geosciences, Vol. 27, No. 4, 2001, pp. 381- 400. doi:10.1016/S0098-3004(00)00116-3
- A. Sato, D. Fukahori, A. Sawada and K. Katsuhiko Sugawara, “Evaluation of Crack Opening in the Heterogeneous Materials by X-Ray CT,” Shigen-toSozai, Vol. 120, No. 6-7, 2004, pp. 365-371. doi:10.2473/shigentosozai.120.365